




Want to hear our analysis of this year’s exams results and what they might mean for the year ahead? Join us for a free webinar on Thursday 10th September 2026.
The end of Summer Term this year has been eventful for schools. Not only have we seen widespread disruption to lessons due to heatwaves, there’s also been a flurry of activity in the DfE, including the appointment of a new education secretary.
While it appears that at least some of her early focus may be directed towards technical education, the task of tackling stubbornly high absence rates is likely to remain near the top of the agenda.
In this post we look back at the 2025/26 academic year as a whole, to see whether or not she’ll be met by signs of continued improvement. We’ll look at the end of the academic year in a bit more detail. As usual, we’ll be using data from our 10,000 or so Attendance Tracker schools.
Weekly absence
We start by plotting the percentage of sessions missed due to absence in each week of this year. In a paler hue, we plot the same for the equivalent weeks the previous year.
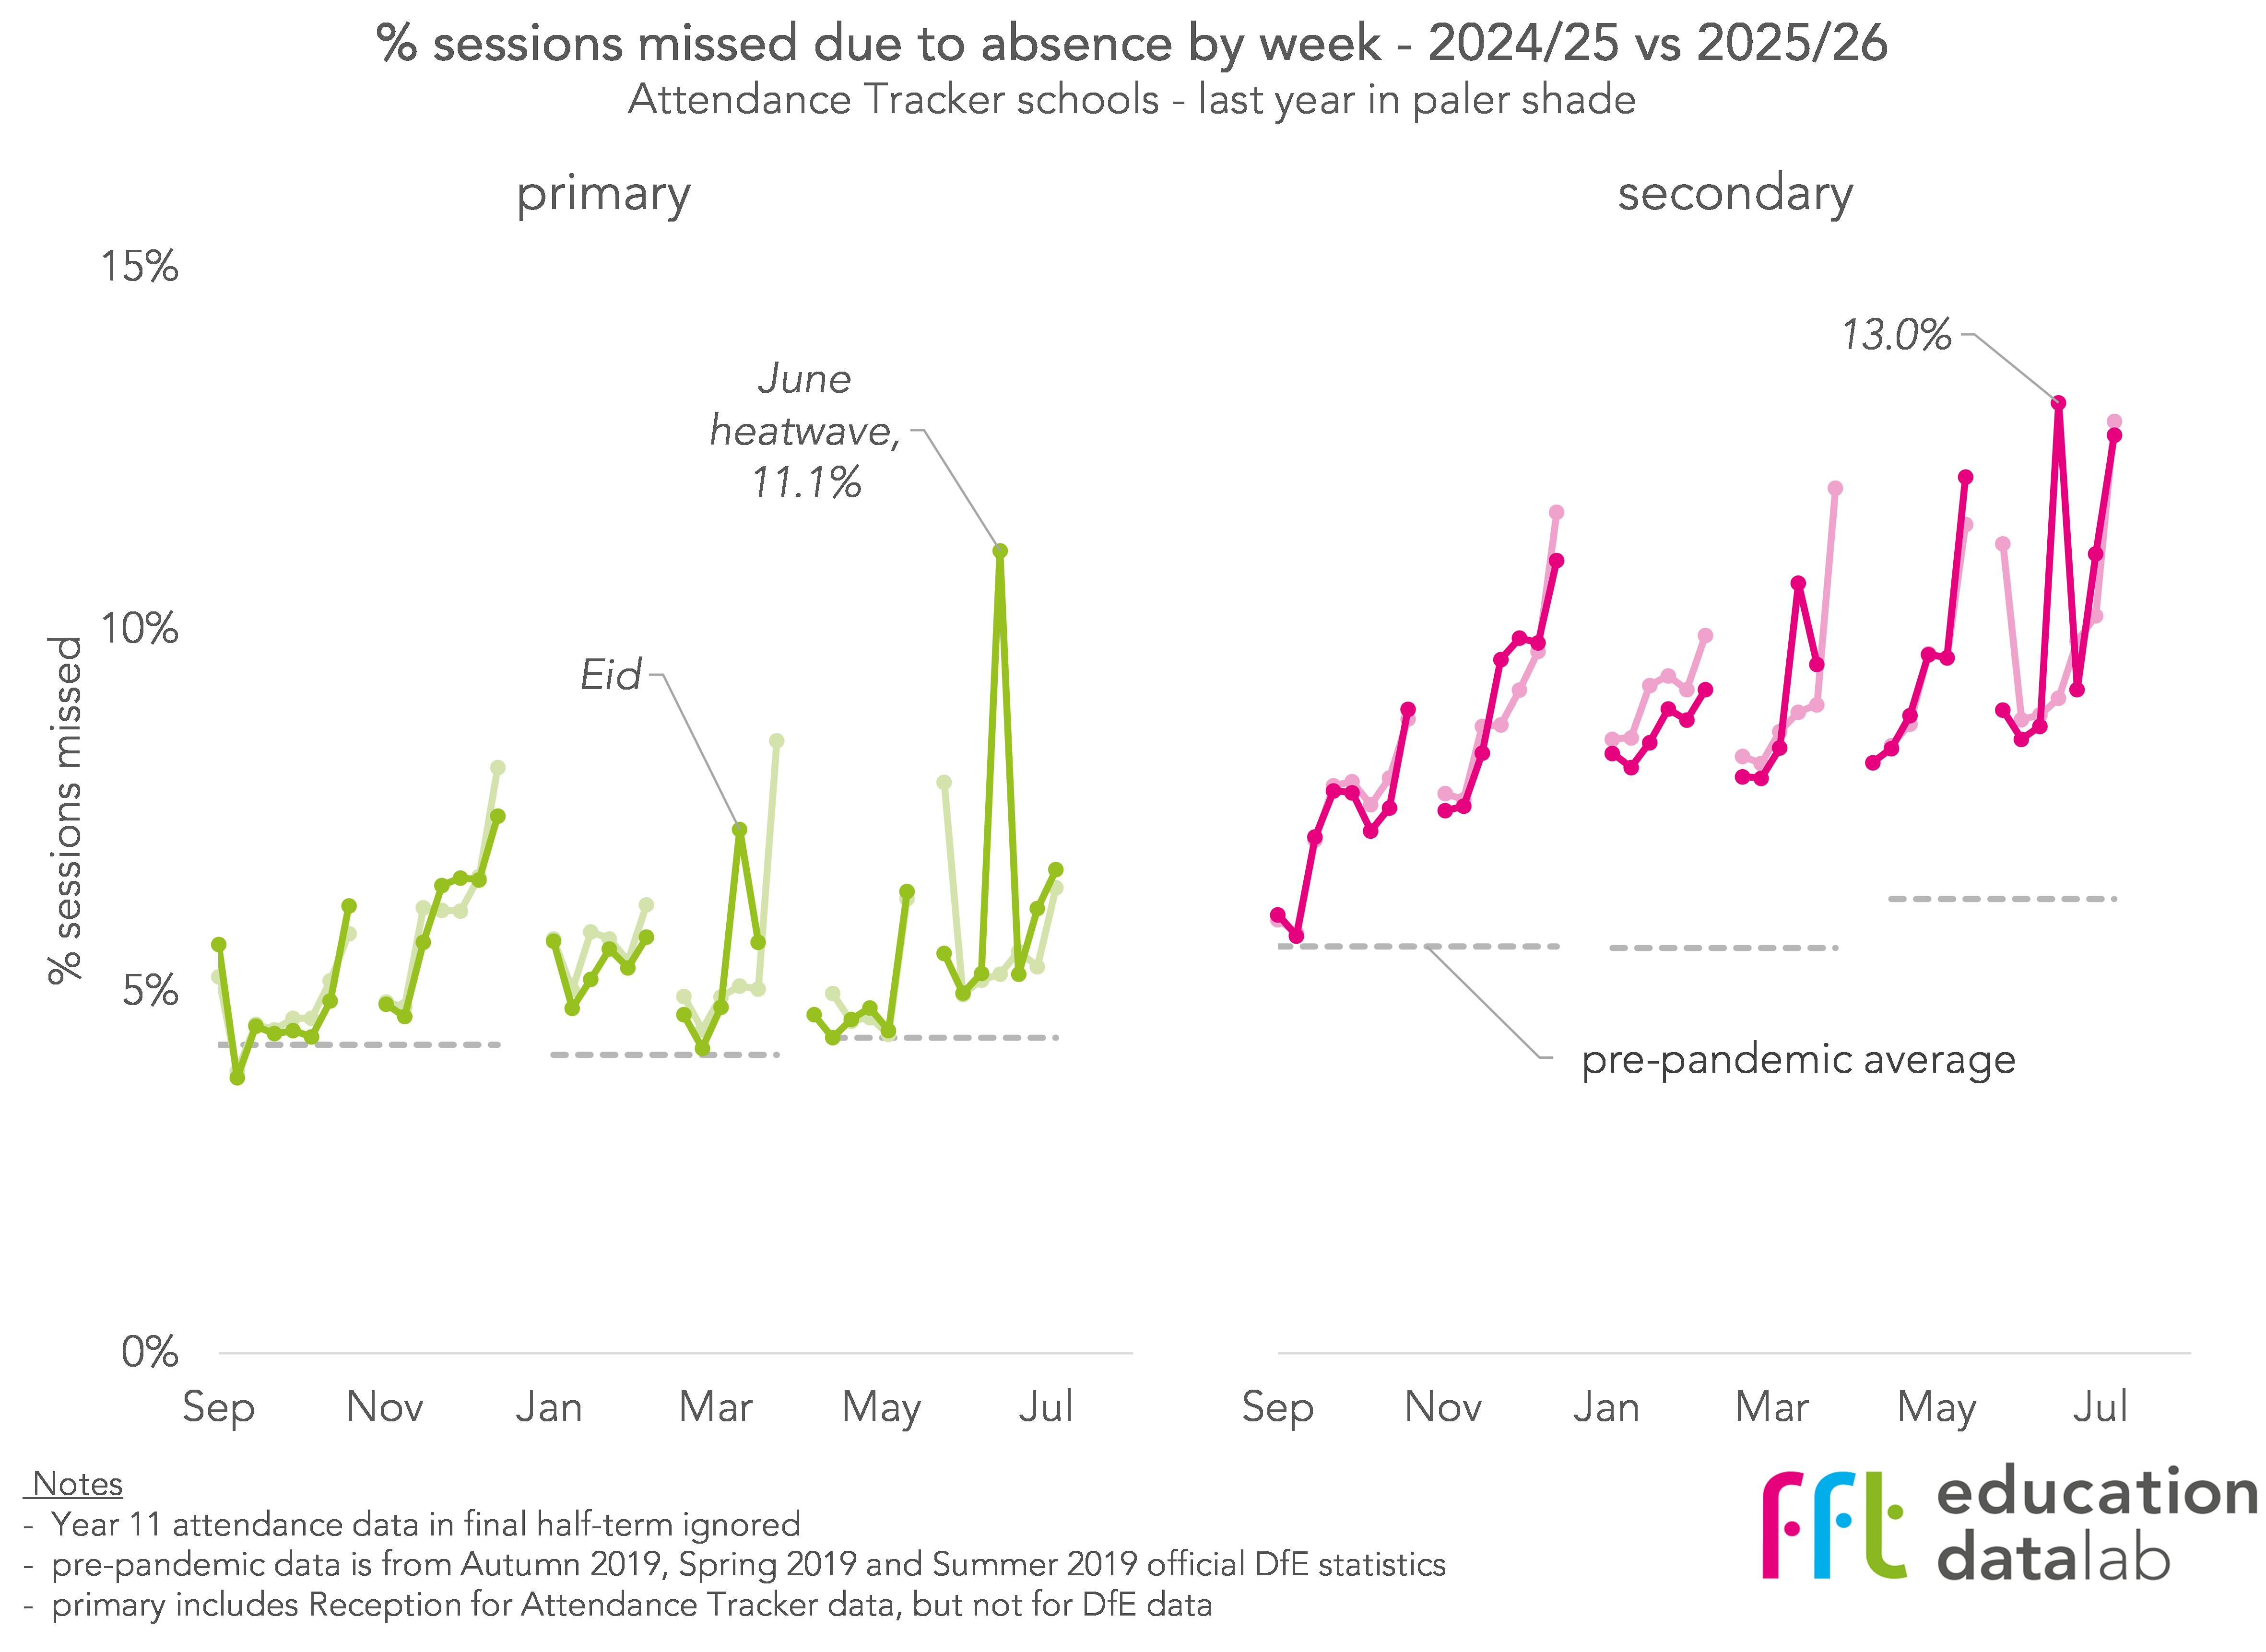
The general pattern is familiar: absence tending to increase as term goes on, with a broad peak in the weeks leading up to Christmas. The sharp peaks just before school holidays are also familiar (more later), as are those in the weeks containing Eid celebrations.
Absence in the second half of Autumn Term was slightly higher this year than last, and in the first half of Spring Term slightly lower.
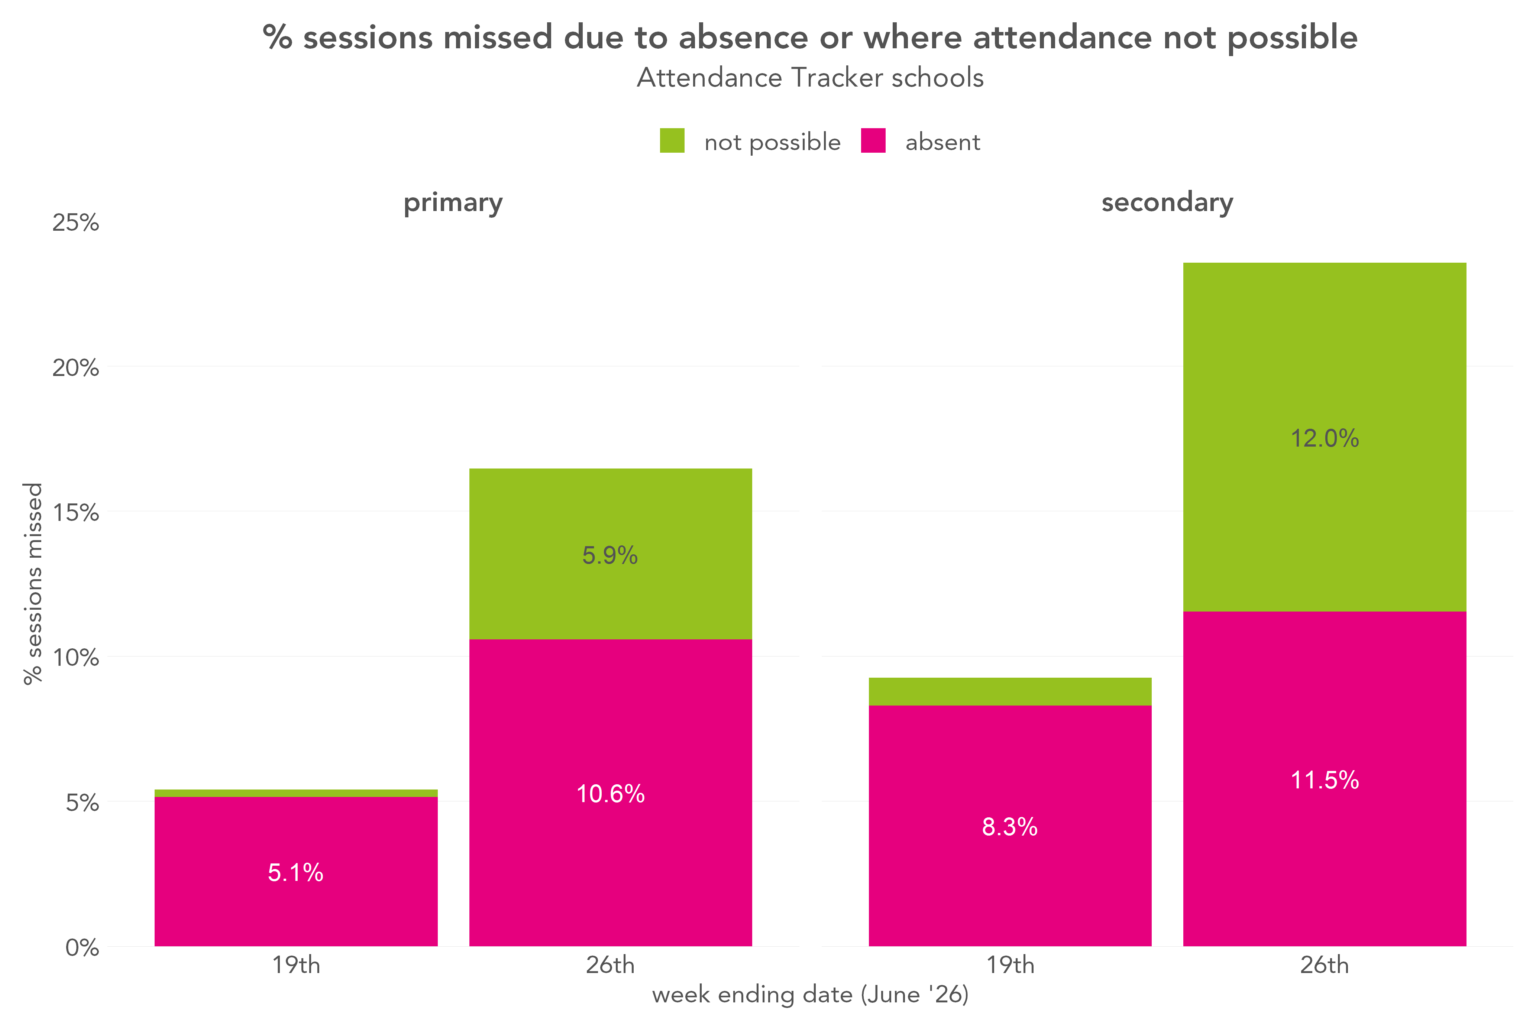
The big difference this year is the dramatic increase in absence in the June heatwave week. (As we wrote last month, this actually underplays just how much school was missed that week, because school closures are not recorded as “absences”[1].)
We can look at this in more detail by breaking it down by the reasons for absence recorded in schools’ registers. We use three categories: illness-related, any unauthorised, and other.
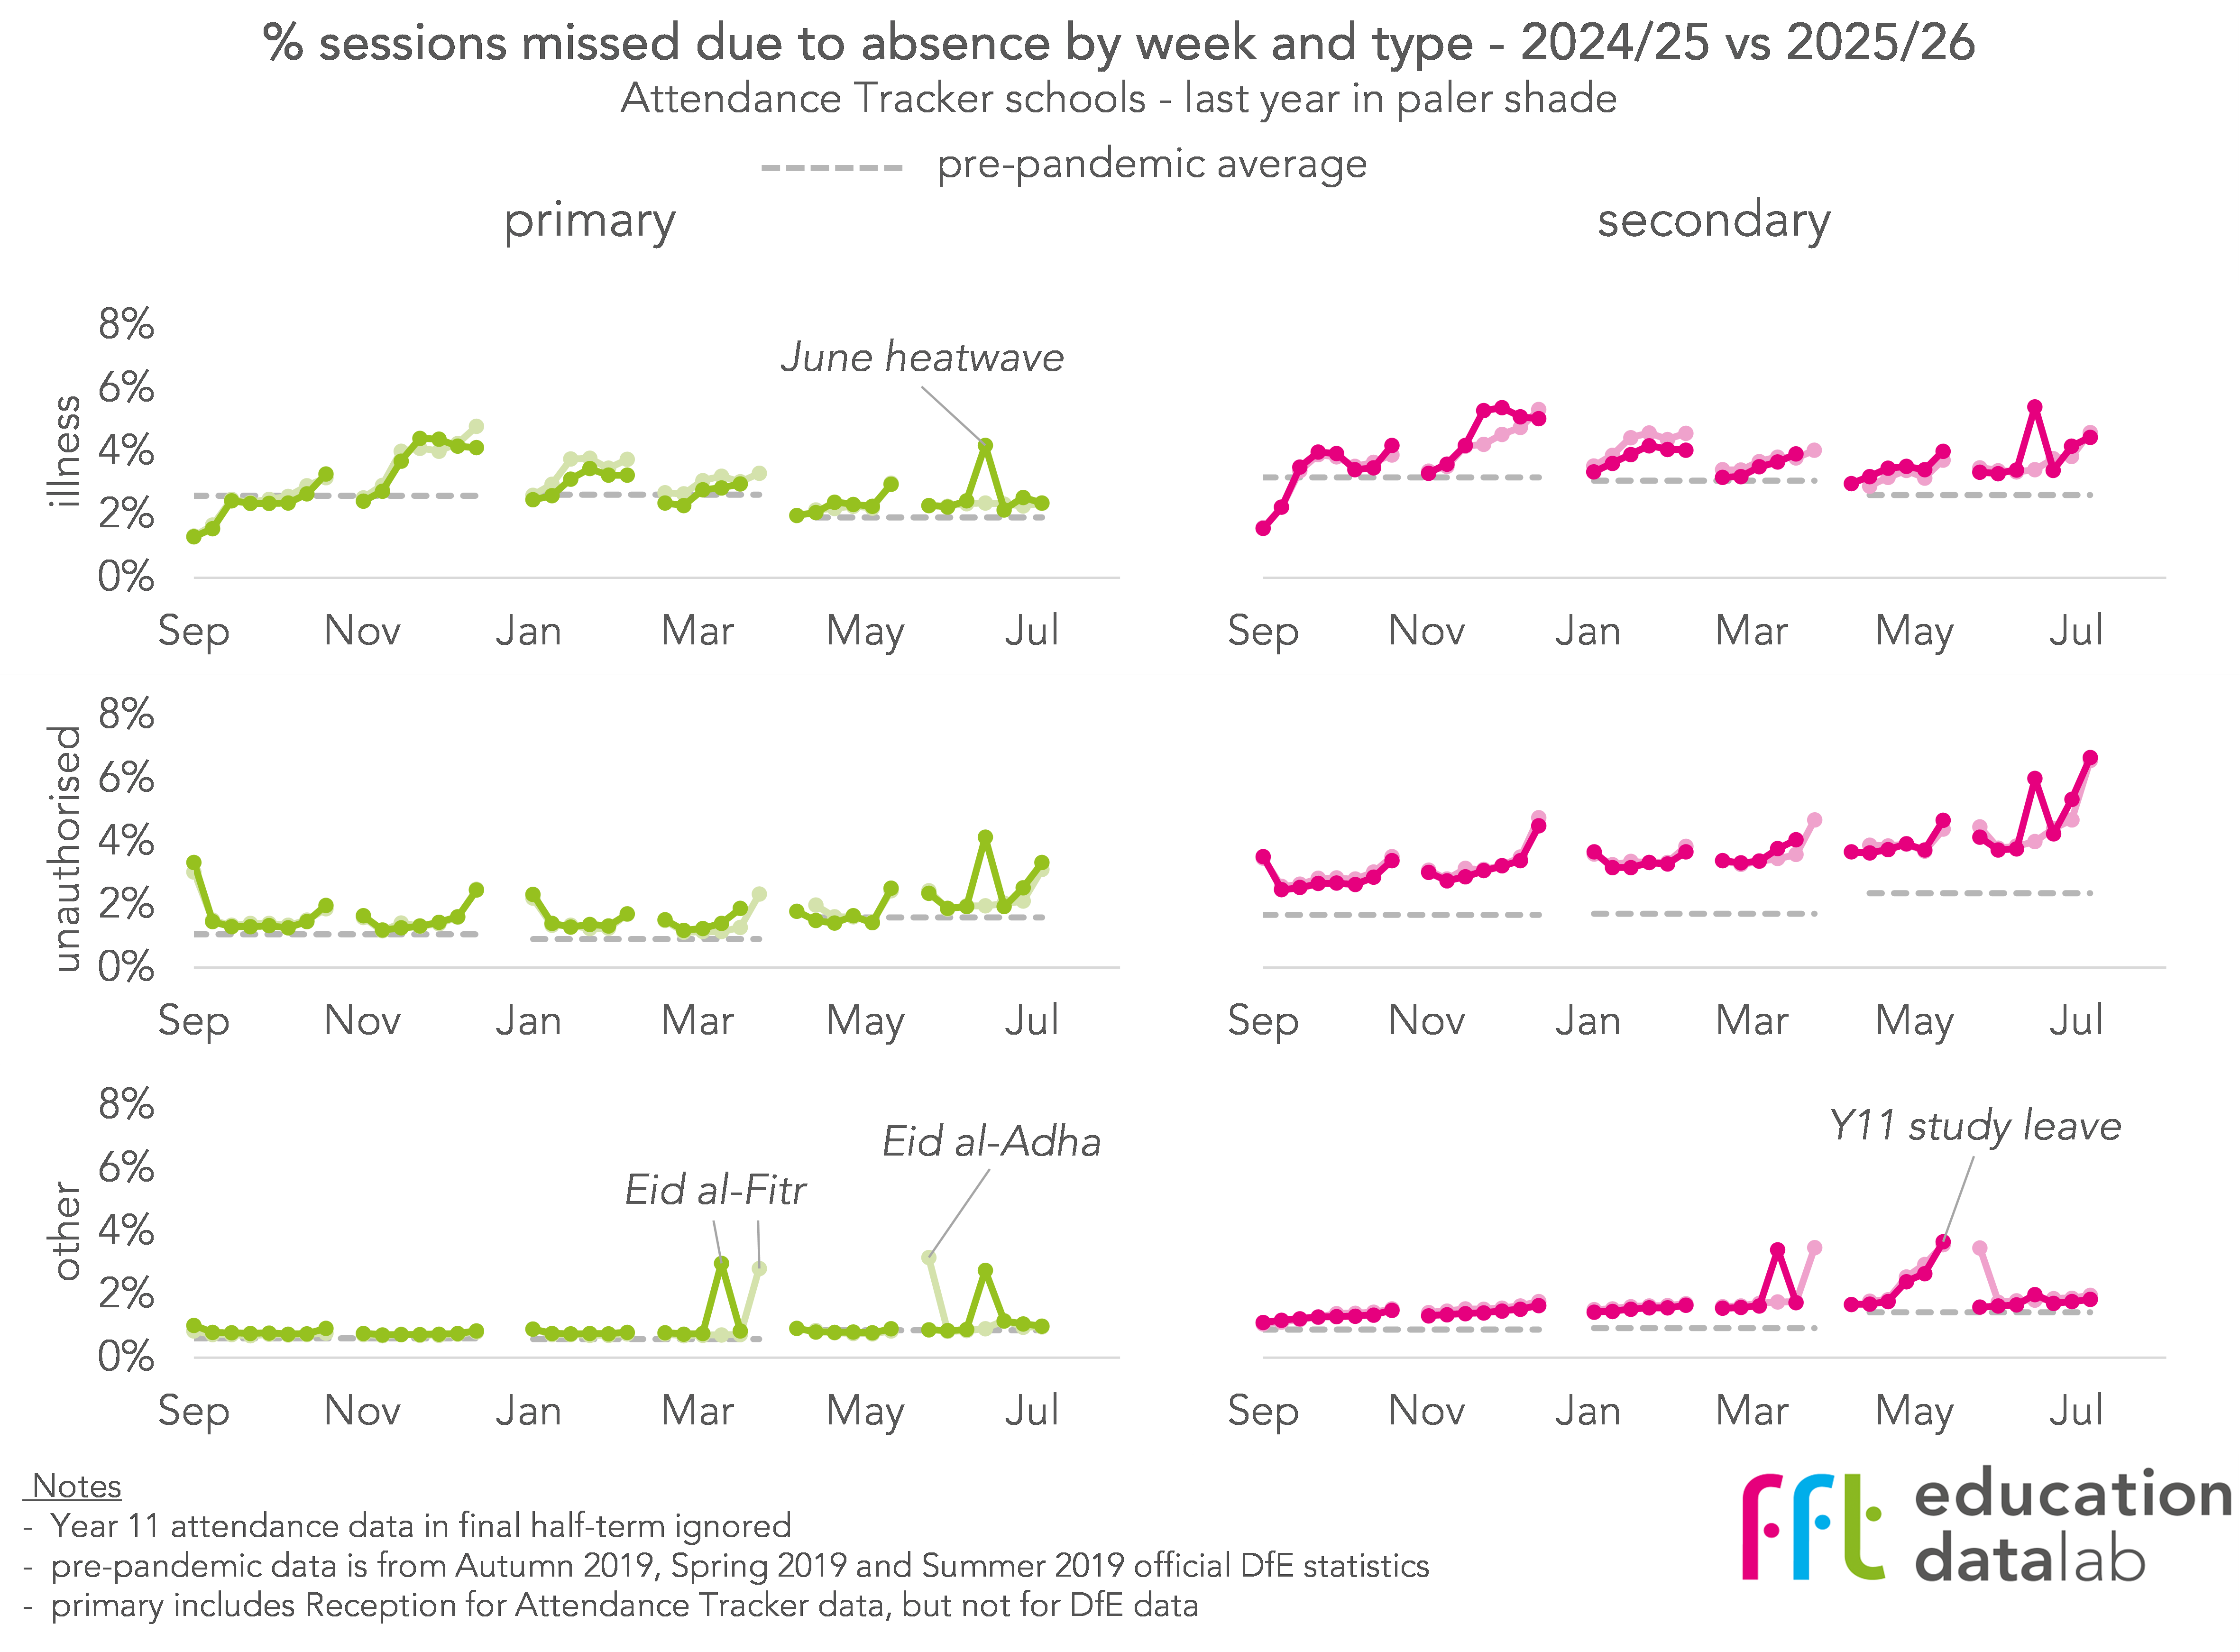
At primary, we see the impact of the June heatwave split roughly evenly across all three absence types. For each type, there was an increase compared with the equivalent week the previous year of around 2 percentage points (%pts). In the case of the “other” category, these are mostly “C”-coded absences, defined as leaves of absence granted by the school for “exceptional circumstances”.
At secondary, we see the same 2%pt increase in illness-related and unauthorised absence, but no rise in other absences.
We’re not sure why there’s such a difference in the prevalence of these leaves of absence between primary and secondary that week, though it could be related to school closures being around twice as common in secondary schools than primary. Perhaps primary schools were more likely to remain open, but to allow some pupils to stay at home even if they weren’t unwell, whereas secondary schools were more likely to close, either completely or partially.
Increased absence before the summer holidays
We now look at the last weeks of term in a bit more detail. Every year we see sharp peaks in absence before school holidays and this year is no different.
Below we plot absence in the last three weeks of term[2] by reason.
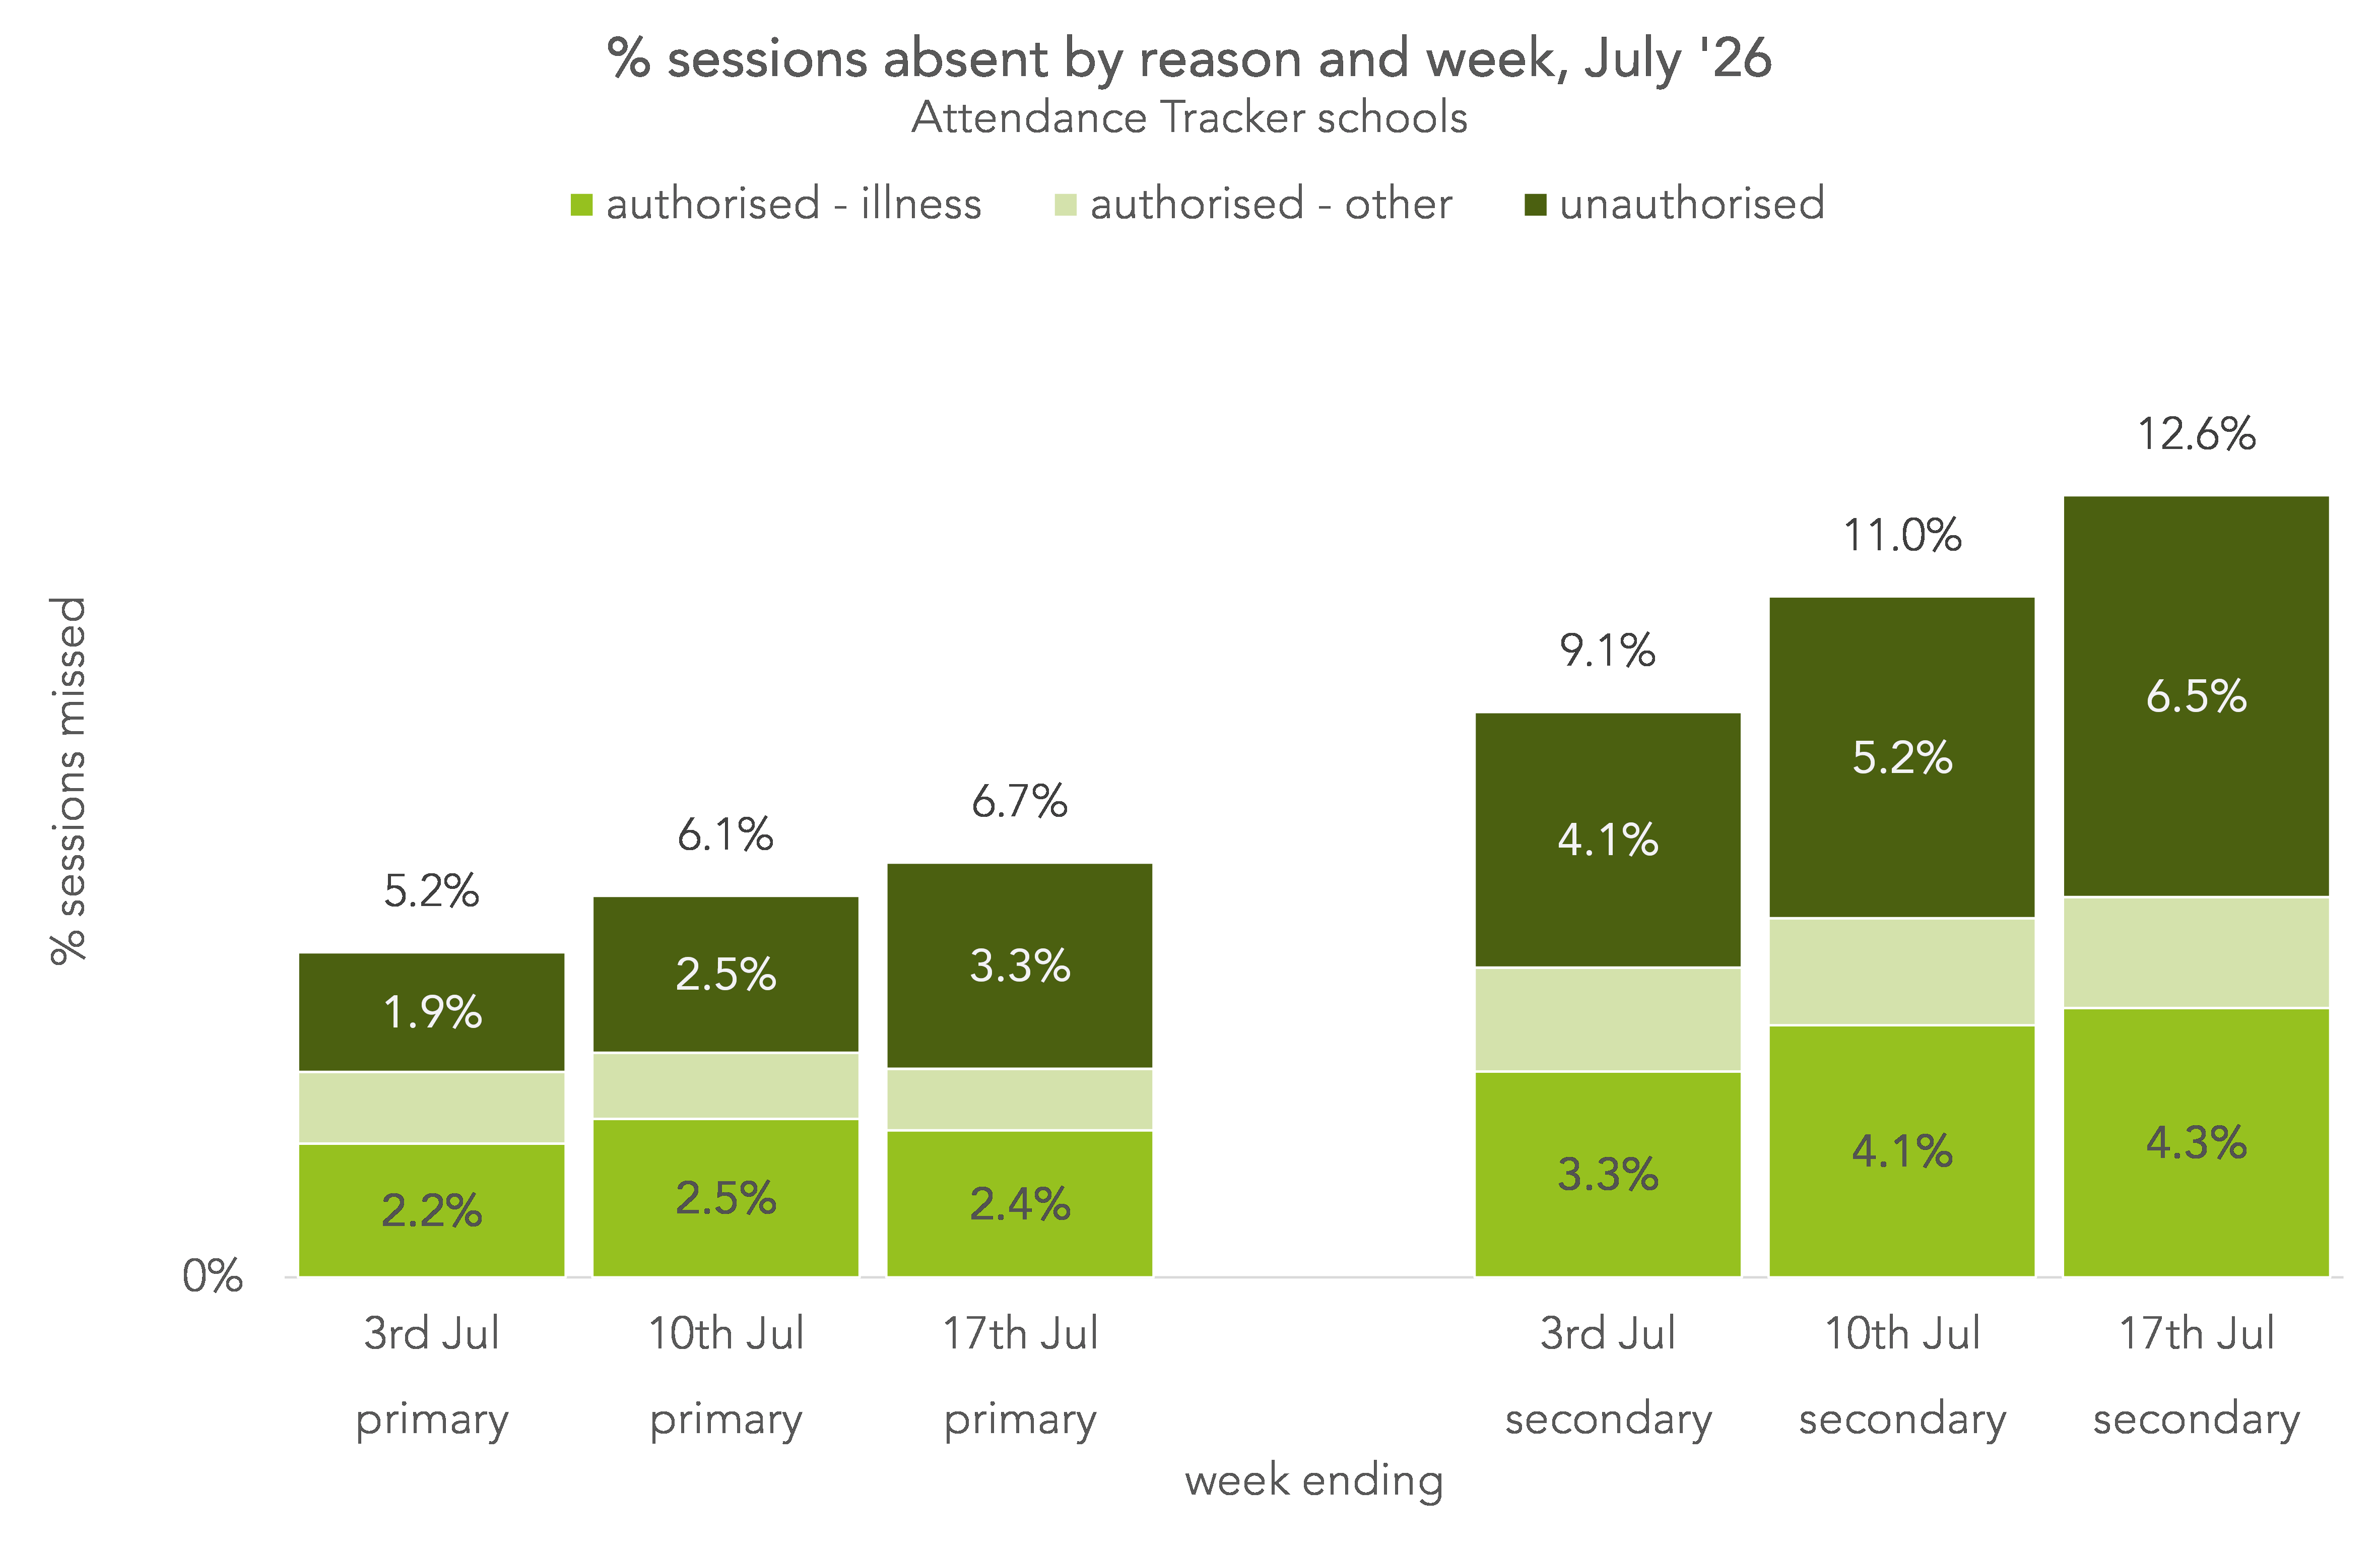
Absence at primary increased by 1.4%pts between the first week of July and the last week of term, while at secondary it increased by 3.5%pts. These figures are roughly equivalent to one additional primary pupil in every two classes missing the final week of term and one additional secondary pupil in every class.
Not all of this additional absence has been recorded in schools’ registers with the dedicated unauthorised holiday “G” code (included in the “unauthorised absence” bar). Some has been recorded with general unauthorised absence codes (“N” and “O”) and, at secondary, around a third was recorded with illness codes (“I”). In reality, some of these extra N, O and I absences probably are the result of unauthorised holidays, despite not being recorded as such.
Because we have no way of knowing exactly how many, we’re not going to claim to be able to measure how many term-time holidays there were. Instead, we’re going to look at all additional absence in the final week of term (vs the first week of July). Some of this will be due to term-time holidays, and the rest will have other, unknown causes.
Below, we show how this additional absence varied by year group.
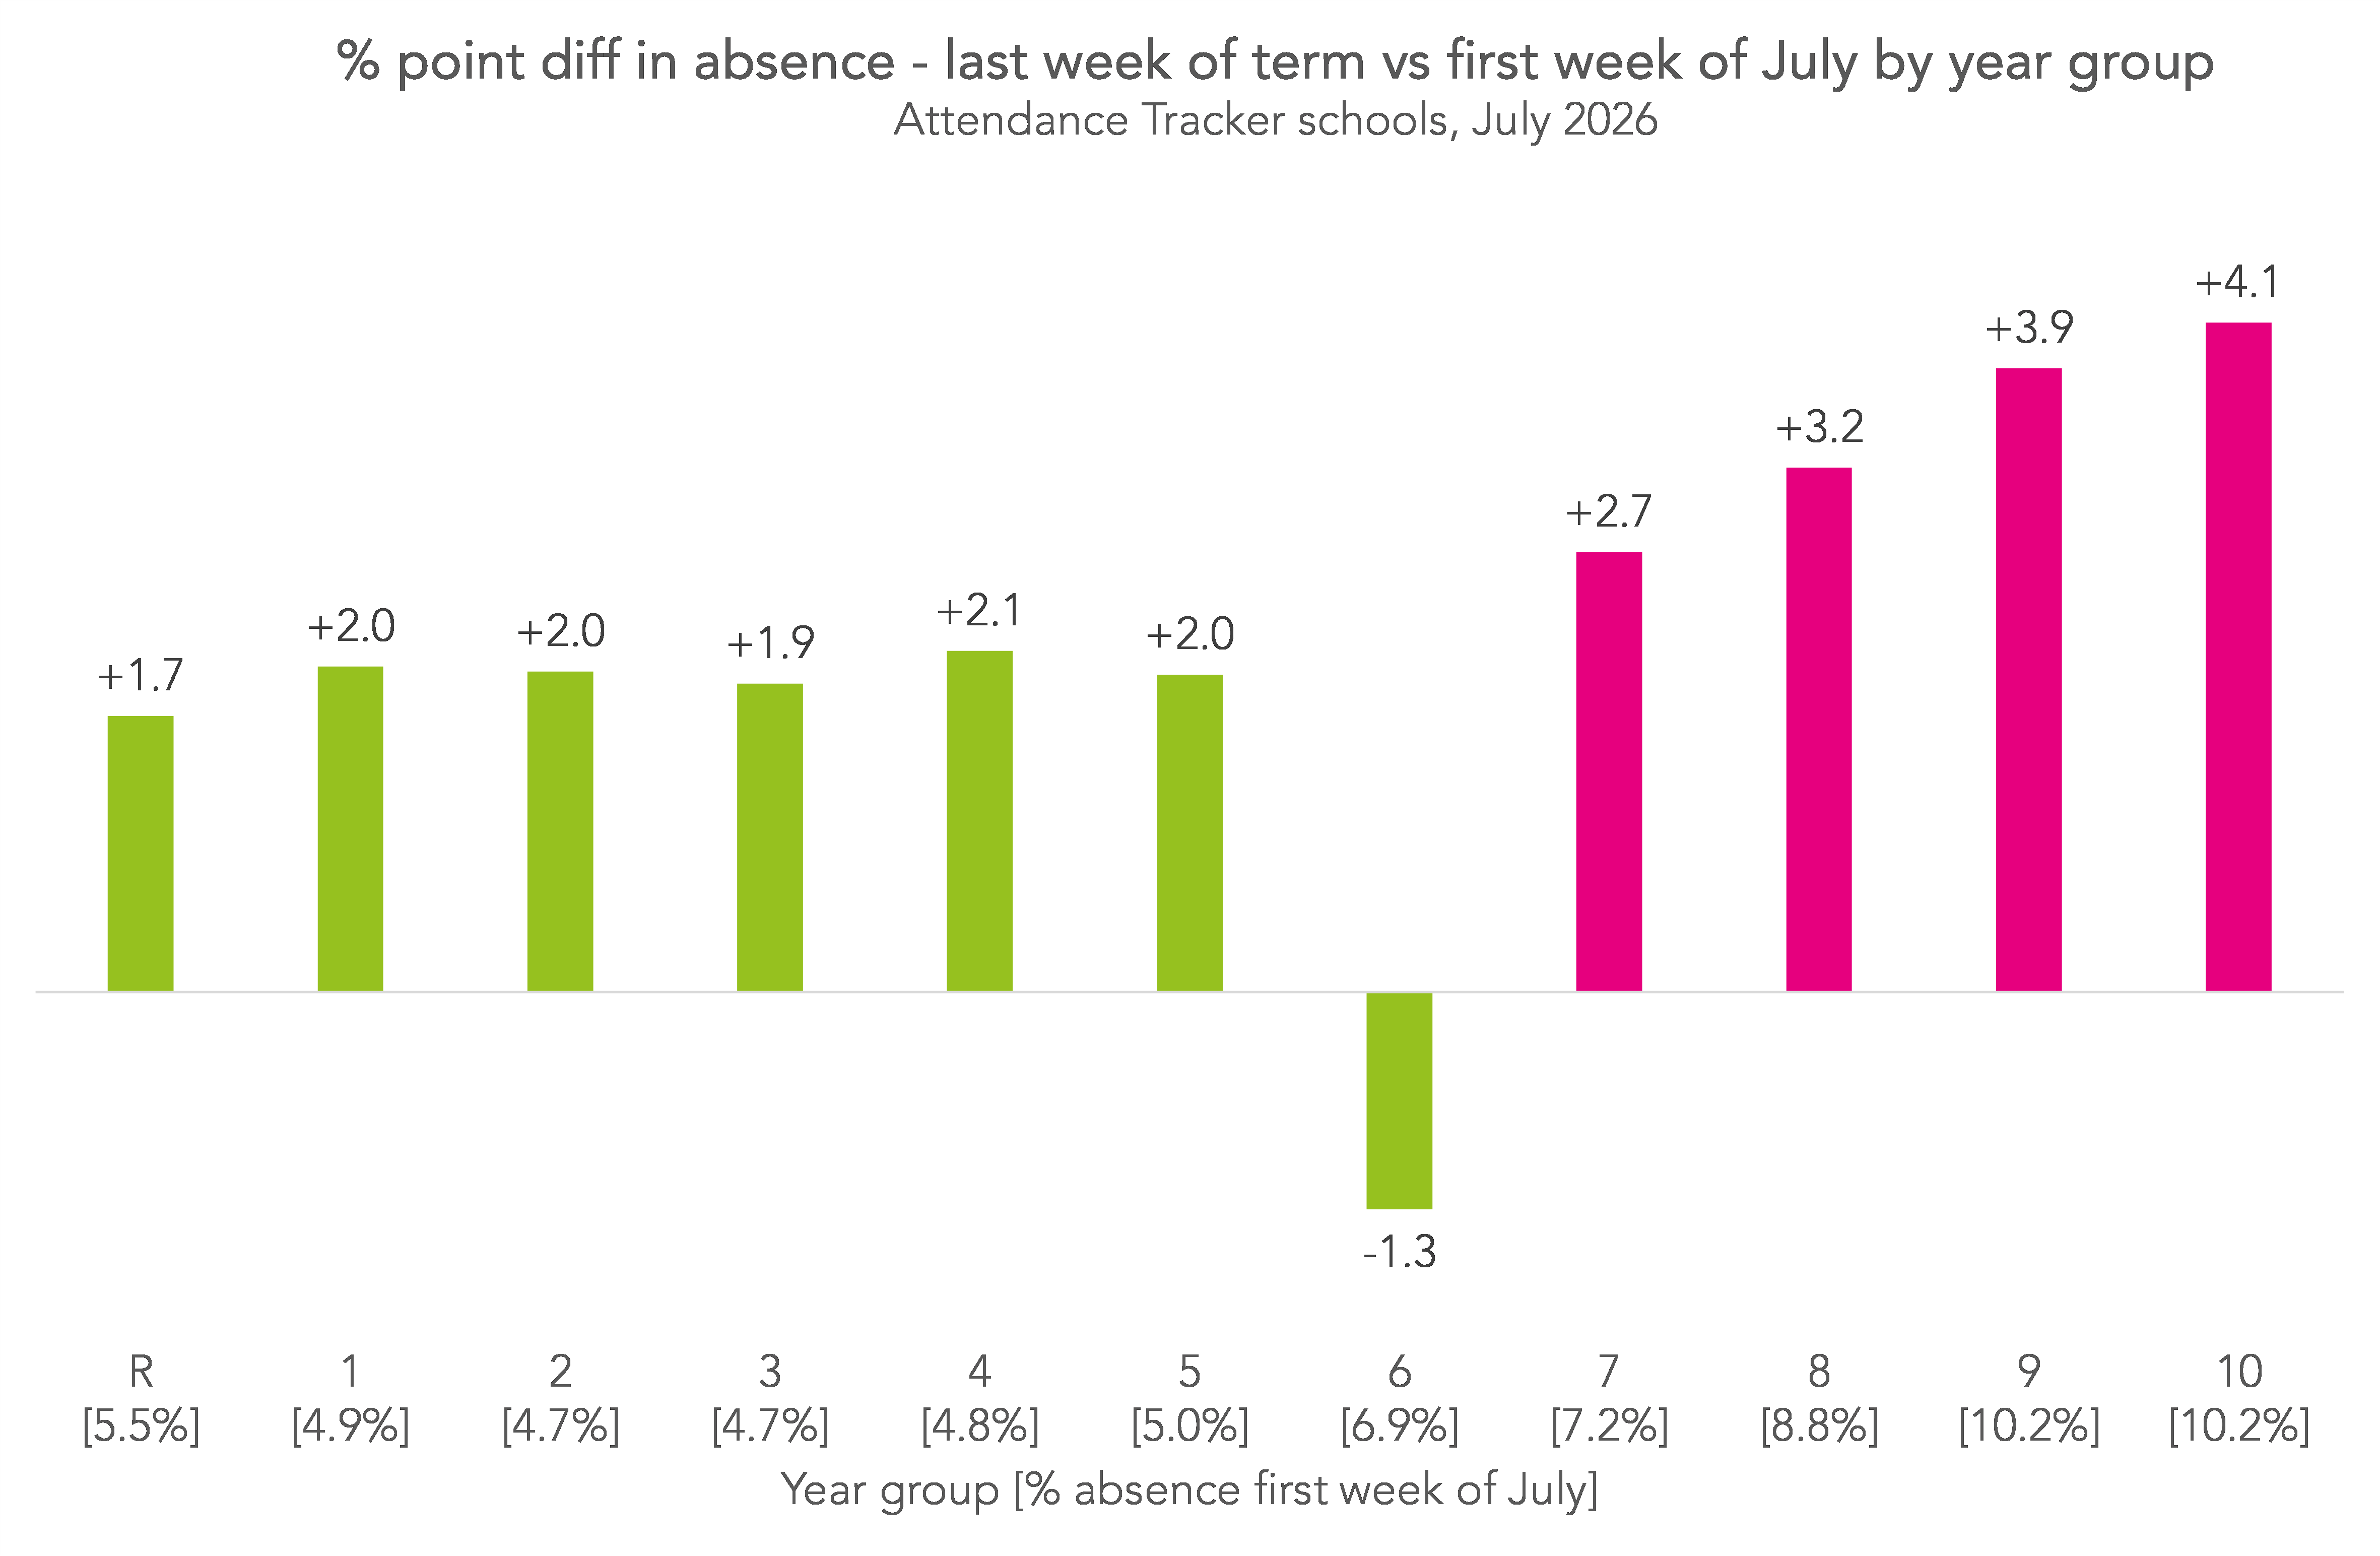
At primary, additional absence was shared out fairly evenly among all year groups apart from Year 6, the only year group where absence was lower in the final week of term than the first week of July. At secondary, older year groups, whose absence rates at the beginning of July were already higher, had higher rates of additional absence in the last week of term.
We also show how this varied by region.
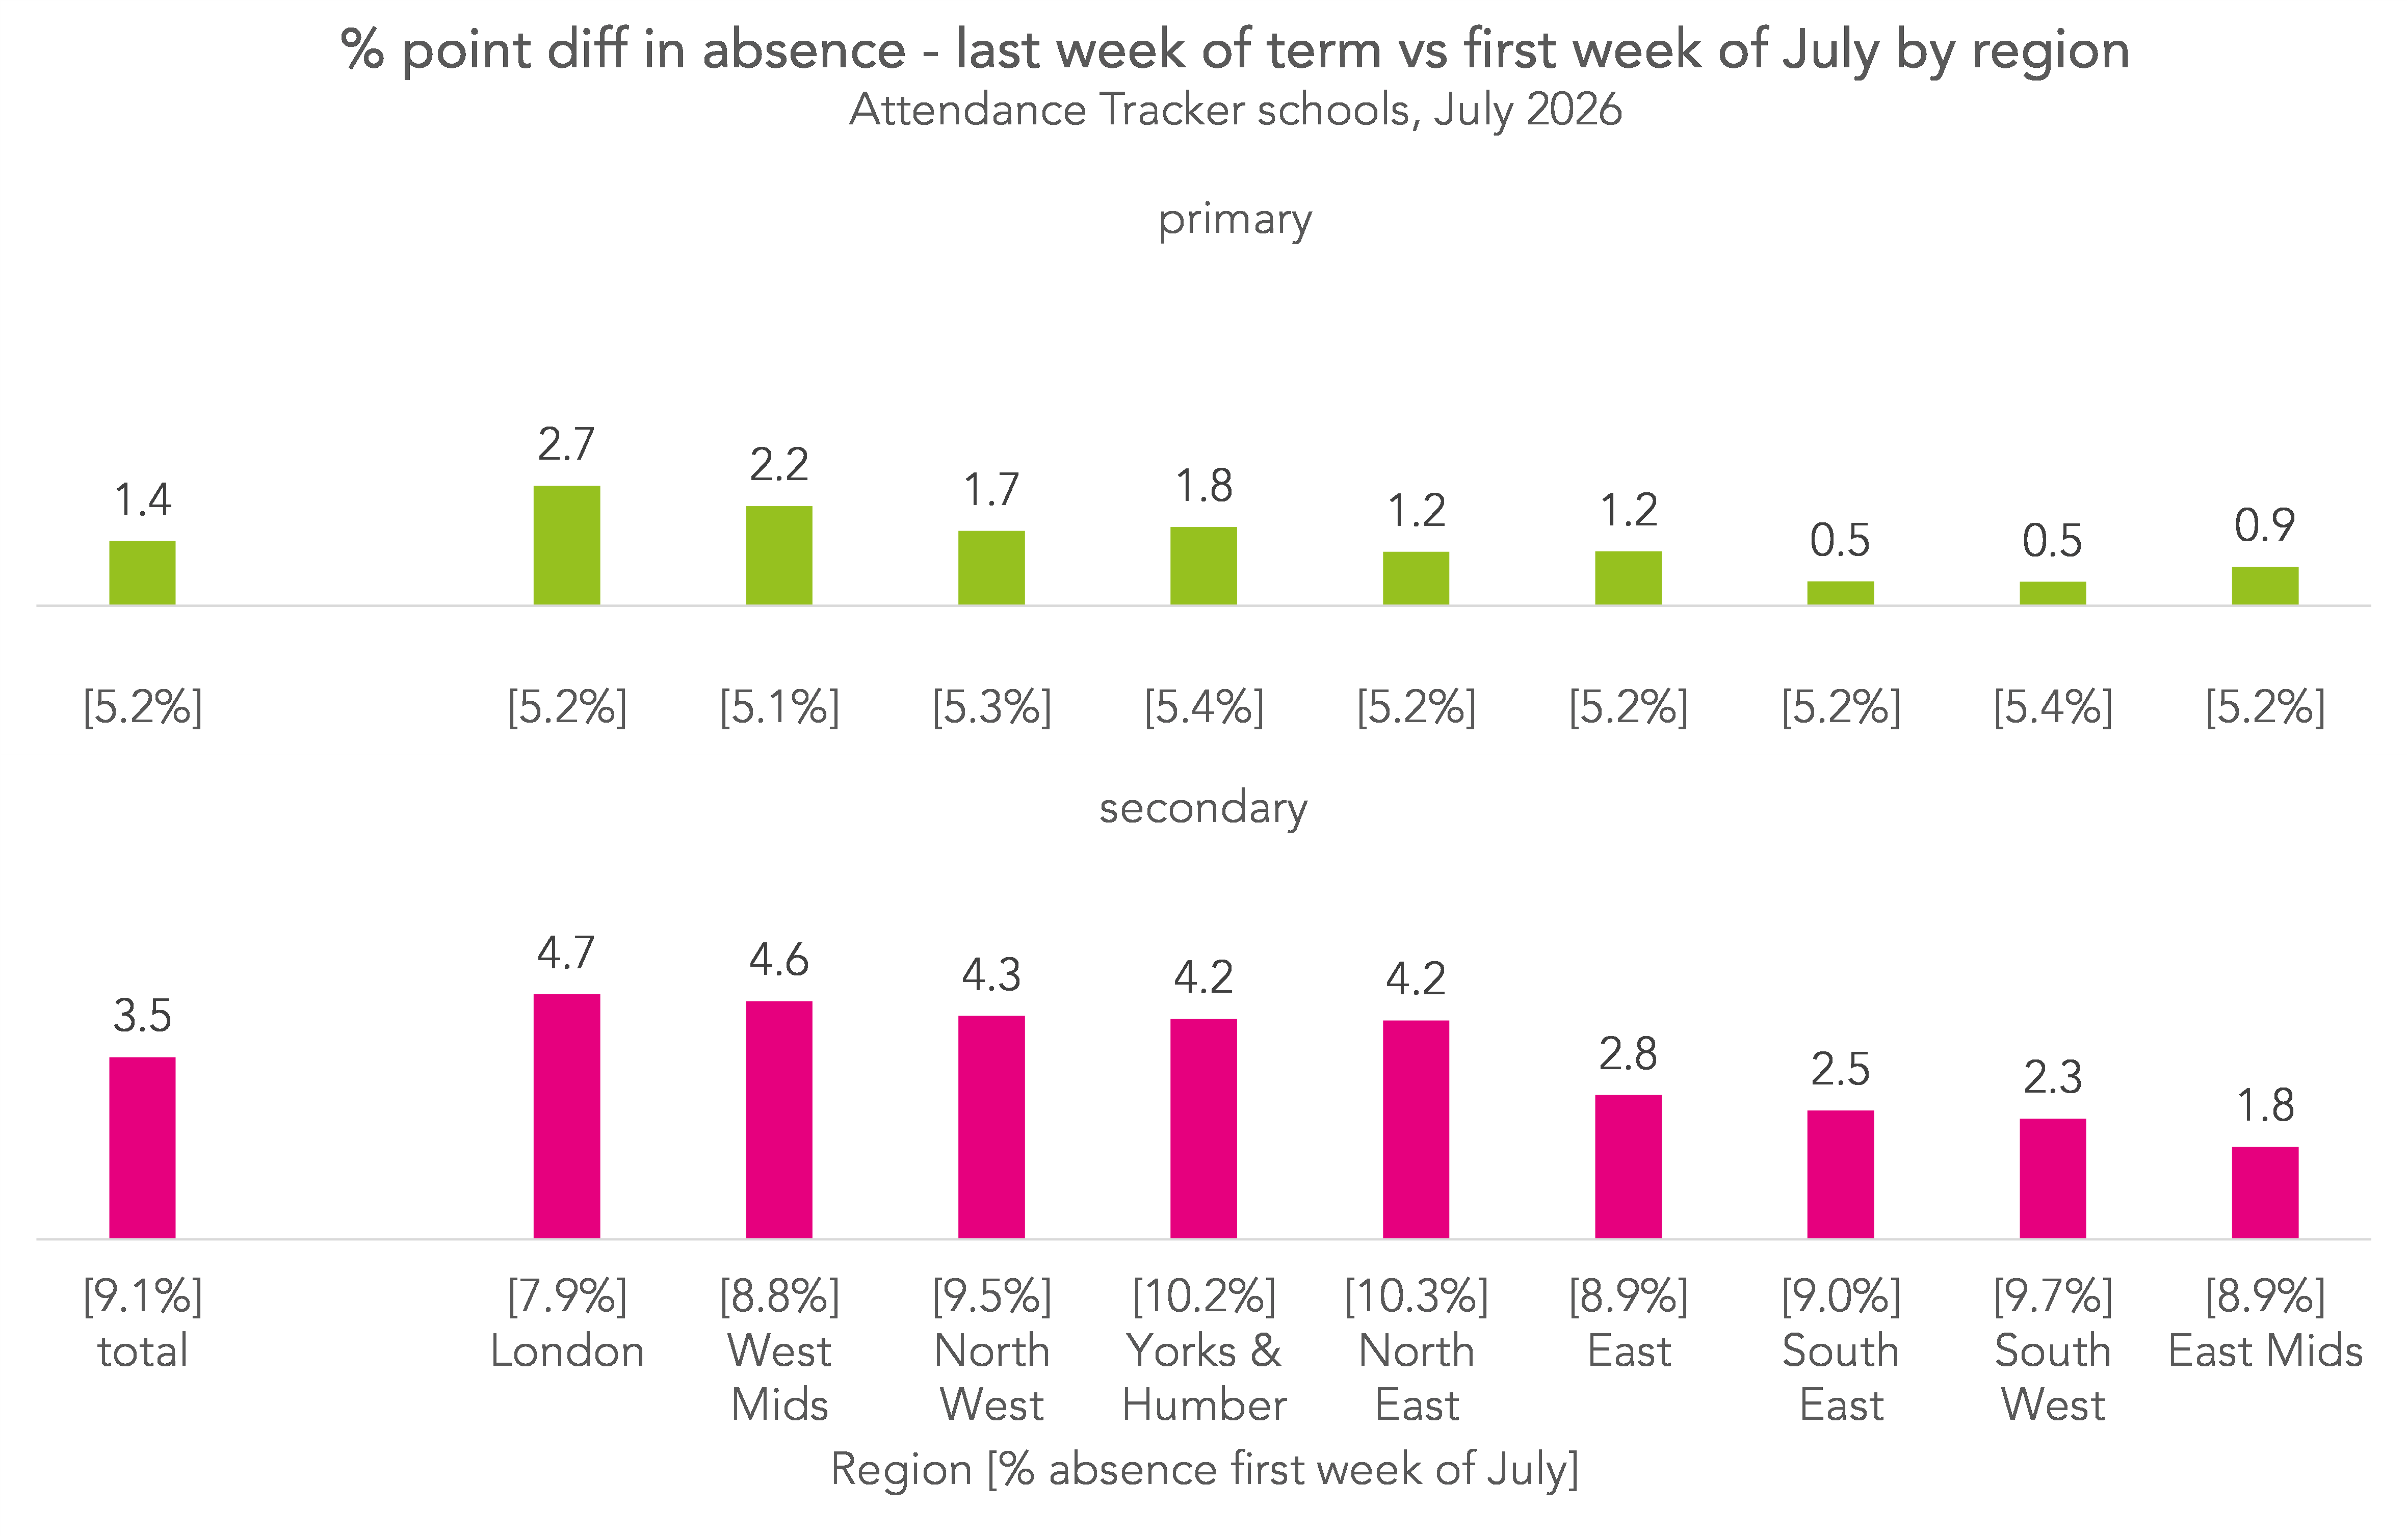
London had the highest rates of additional absence in the final week of term at both primary and secondary while the South East, South West and East Midlands had the lowest (though some schools in the East Midlands break up for the summer earlier than other parts of the country[3].) Rates were also above average at both primary and secondary in the West Midlands, North West, and Yorkshire and the Humber. The North East is the only region where rates were below average at primary and above average at secondary.
We finish this section by looking at how additional end of term absence varied by region and disadvantage, measured by “FSM6”[4].
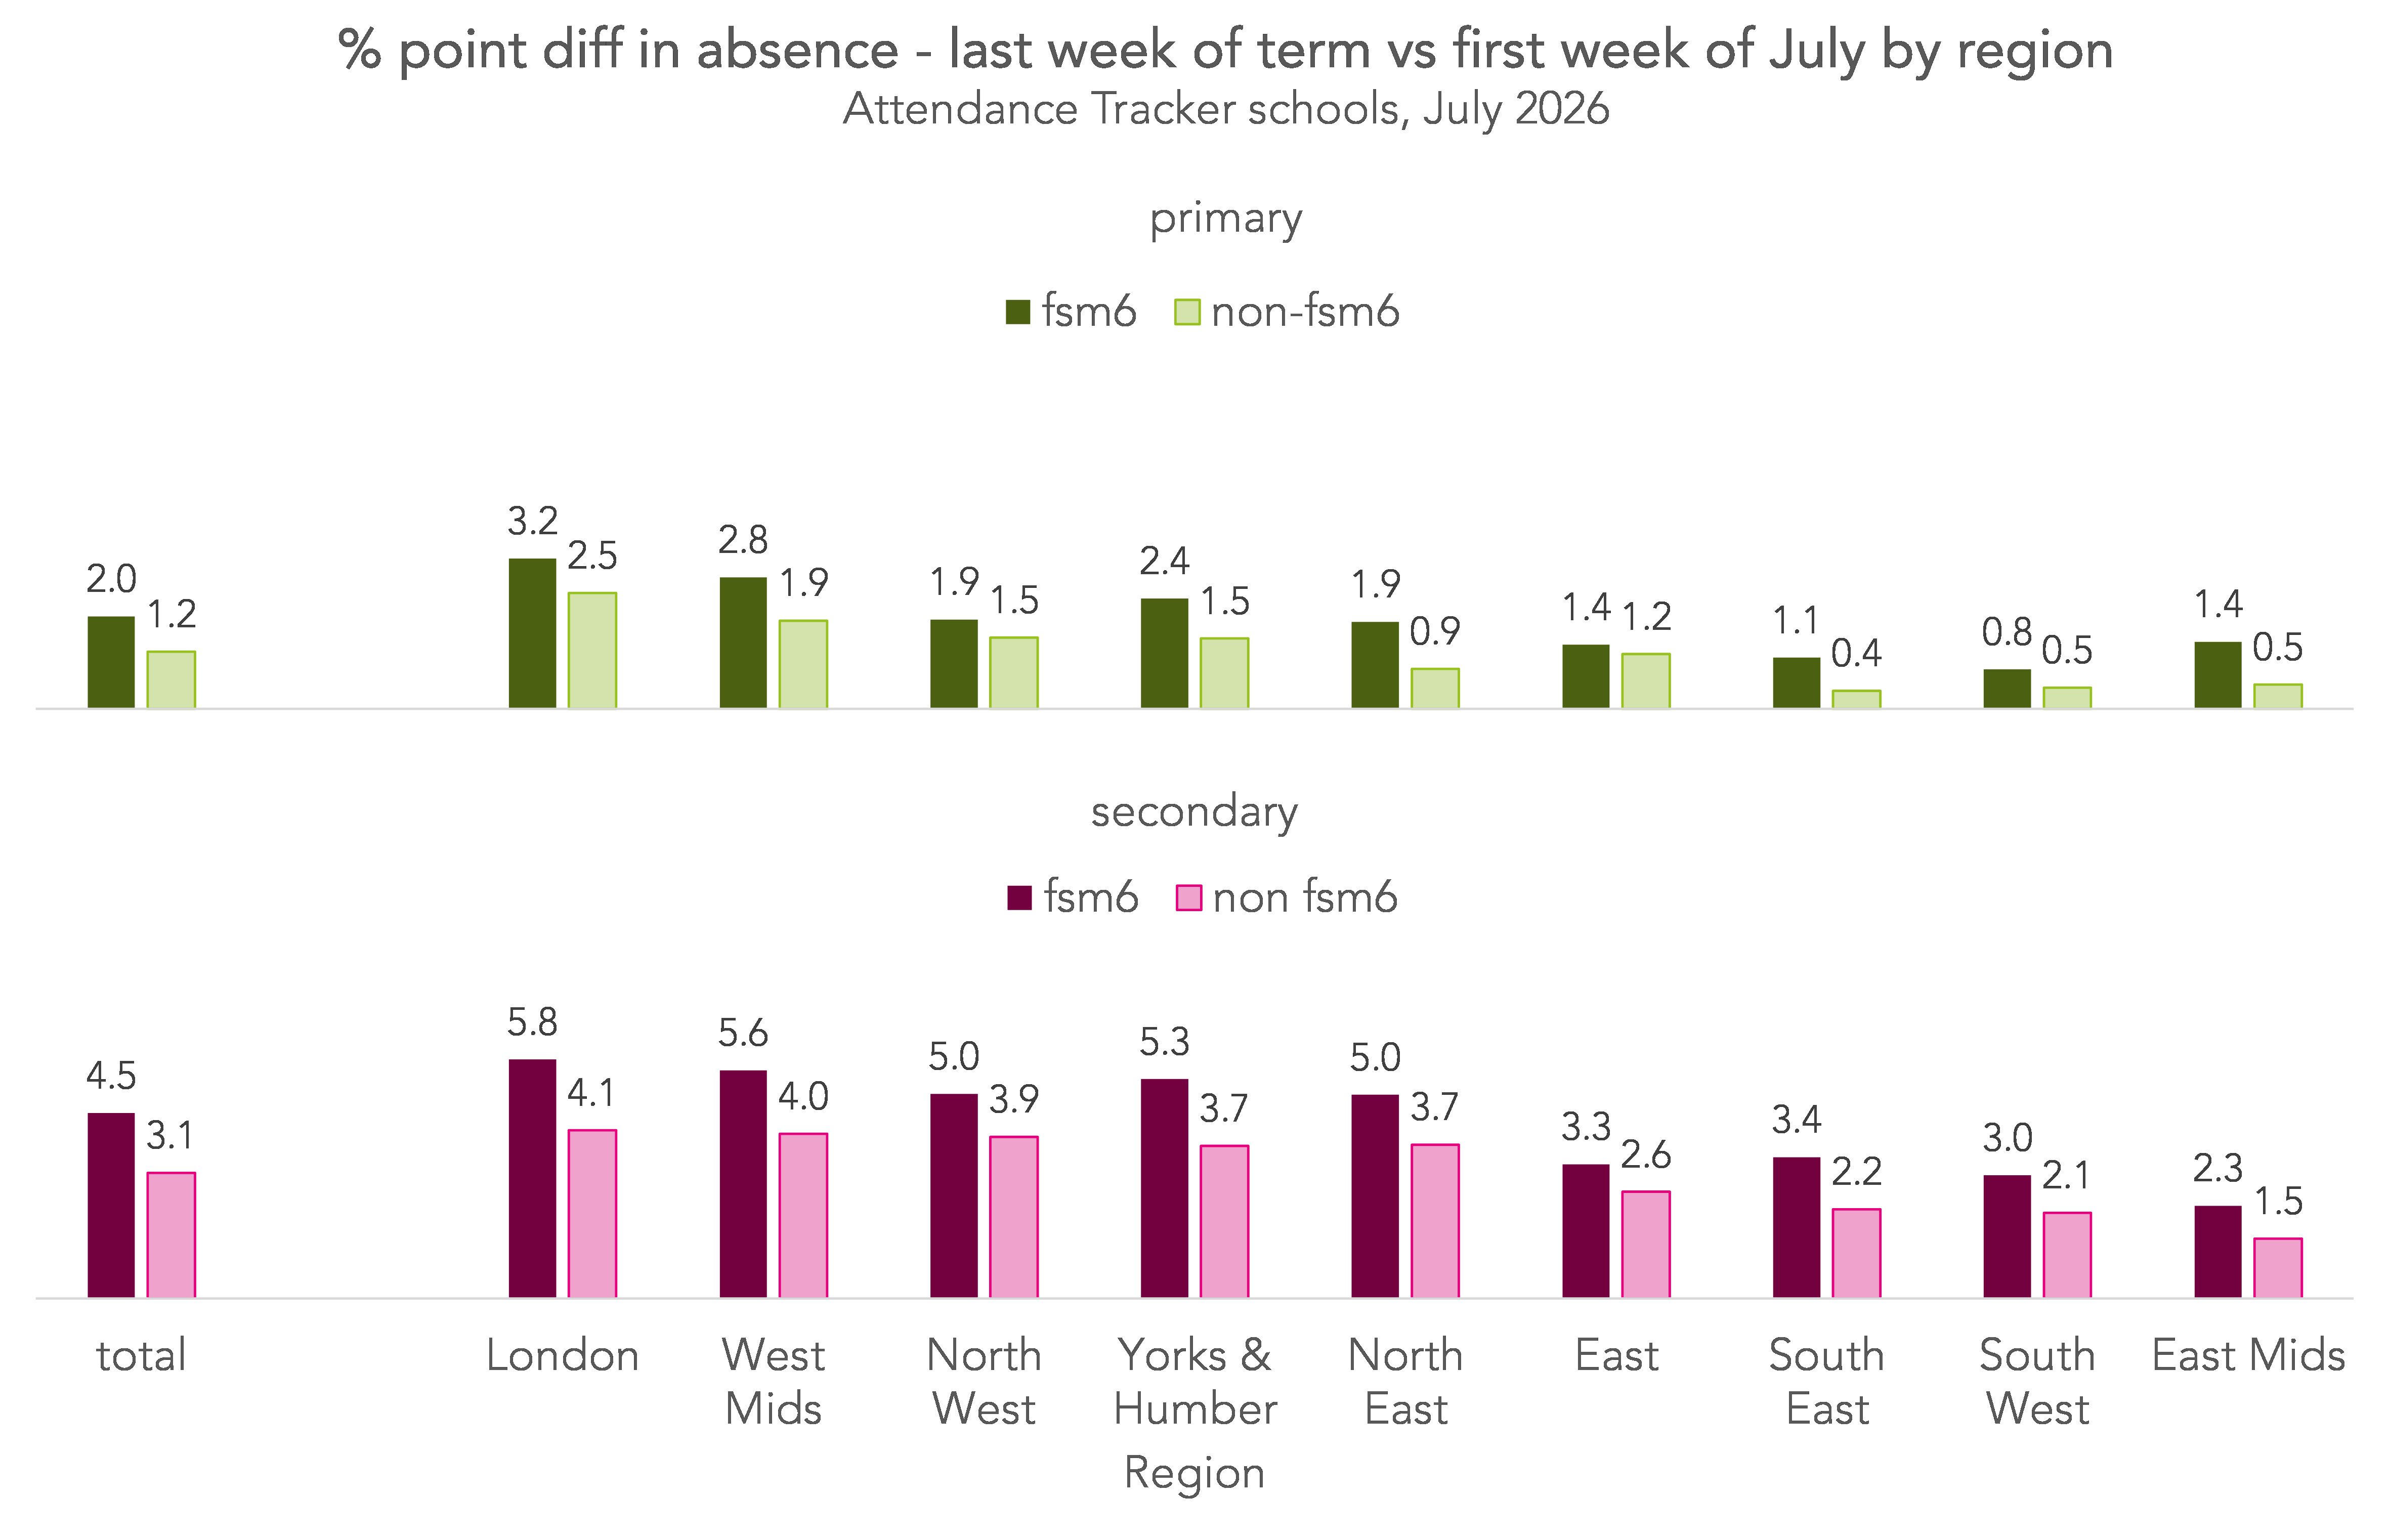
Disadvantaged pupils tended to see higher rates of additional absence than other pupils, and this picture is mirrored across regions. The difference by disadvantage was bigger at secondary than primary.
Absence and persistent absence – this year vs last year
Let’s turn now to absence and persistent absence across the whole academic year.
Below we plot the percentage of sessions missed due to absence by reason, this year, last year, and pre-pandemic.
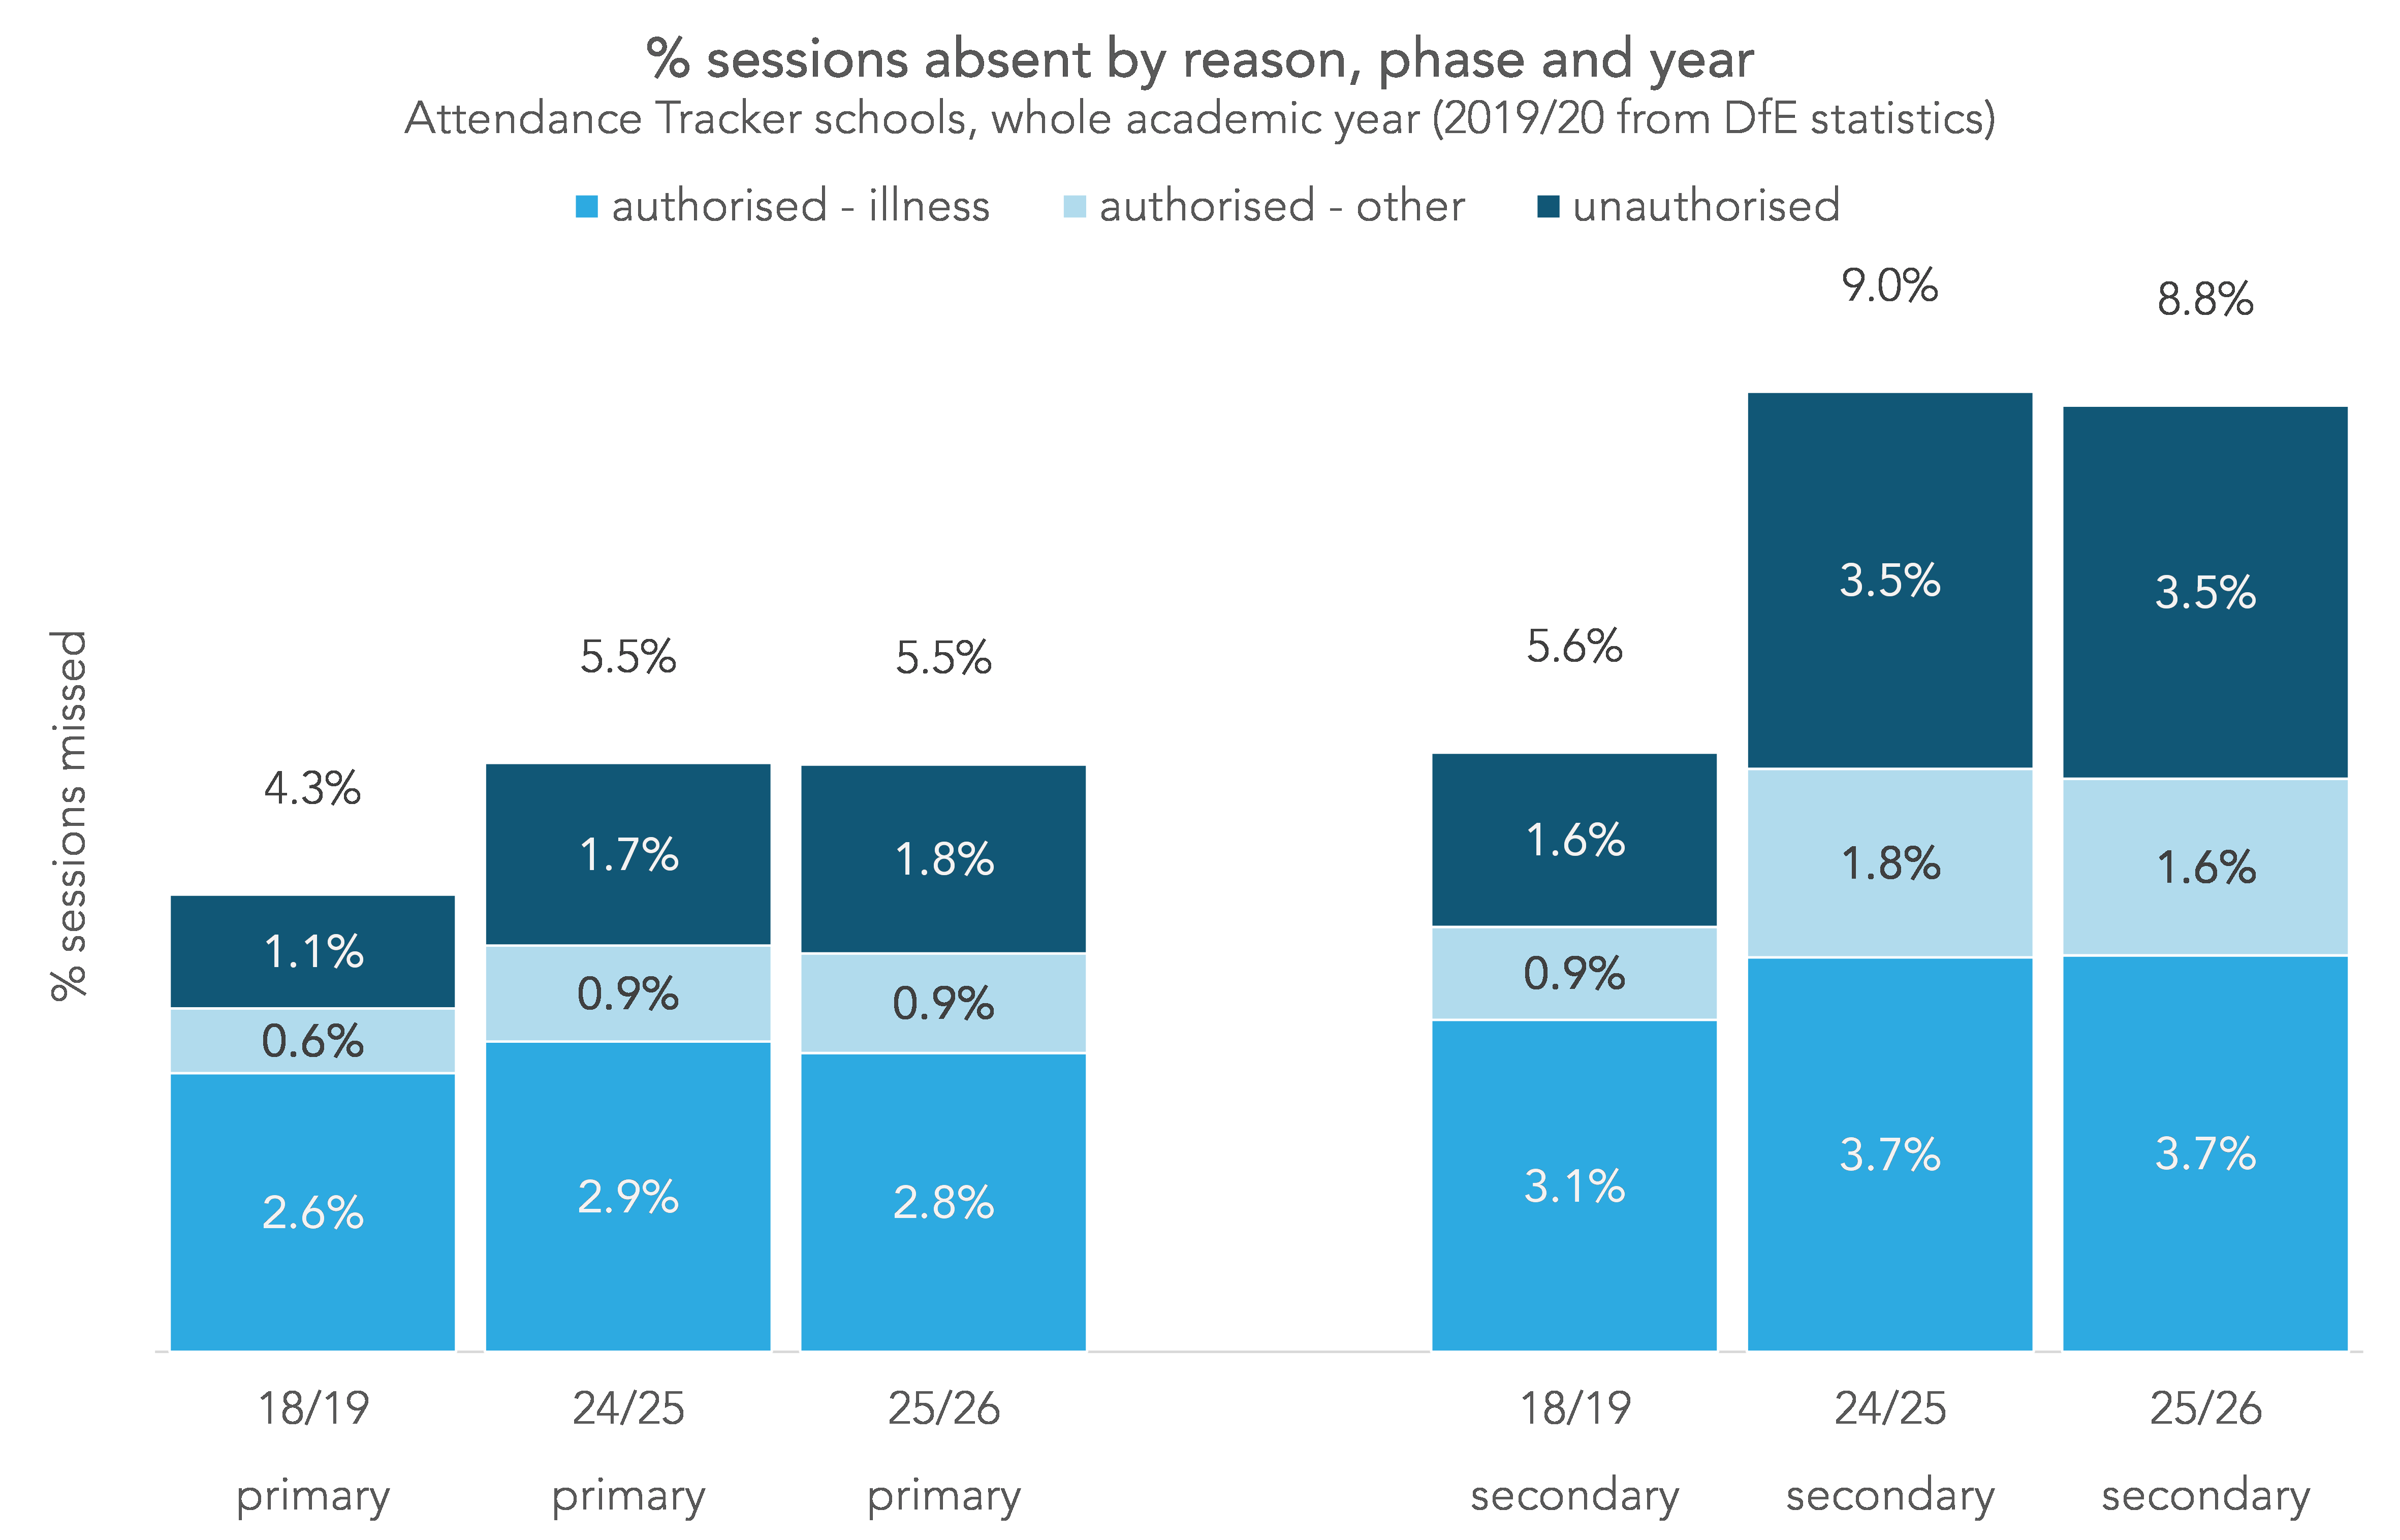
It appears that absence overall has remained broadly the same as last year, perhaps ever so slightly lower at secondary. If this is borne out when official DfE statistics are released next Spring, it will be the first post-pandemic year with no meaningful reduction in absence. Unauthorised absence at secondary in particular remains stubbornly high.
We finish with persistent absence. Below we plot the percentage of pupils persistently absent, having missed at least 10% of sessions, by region, comparing this year with last year.
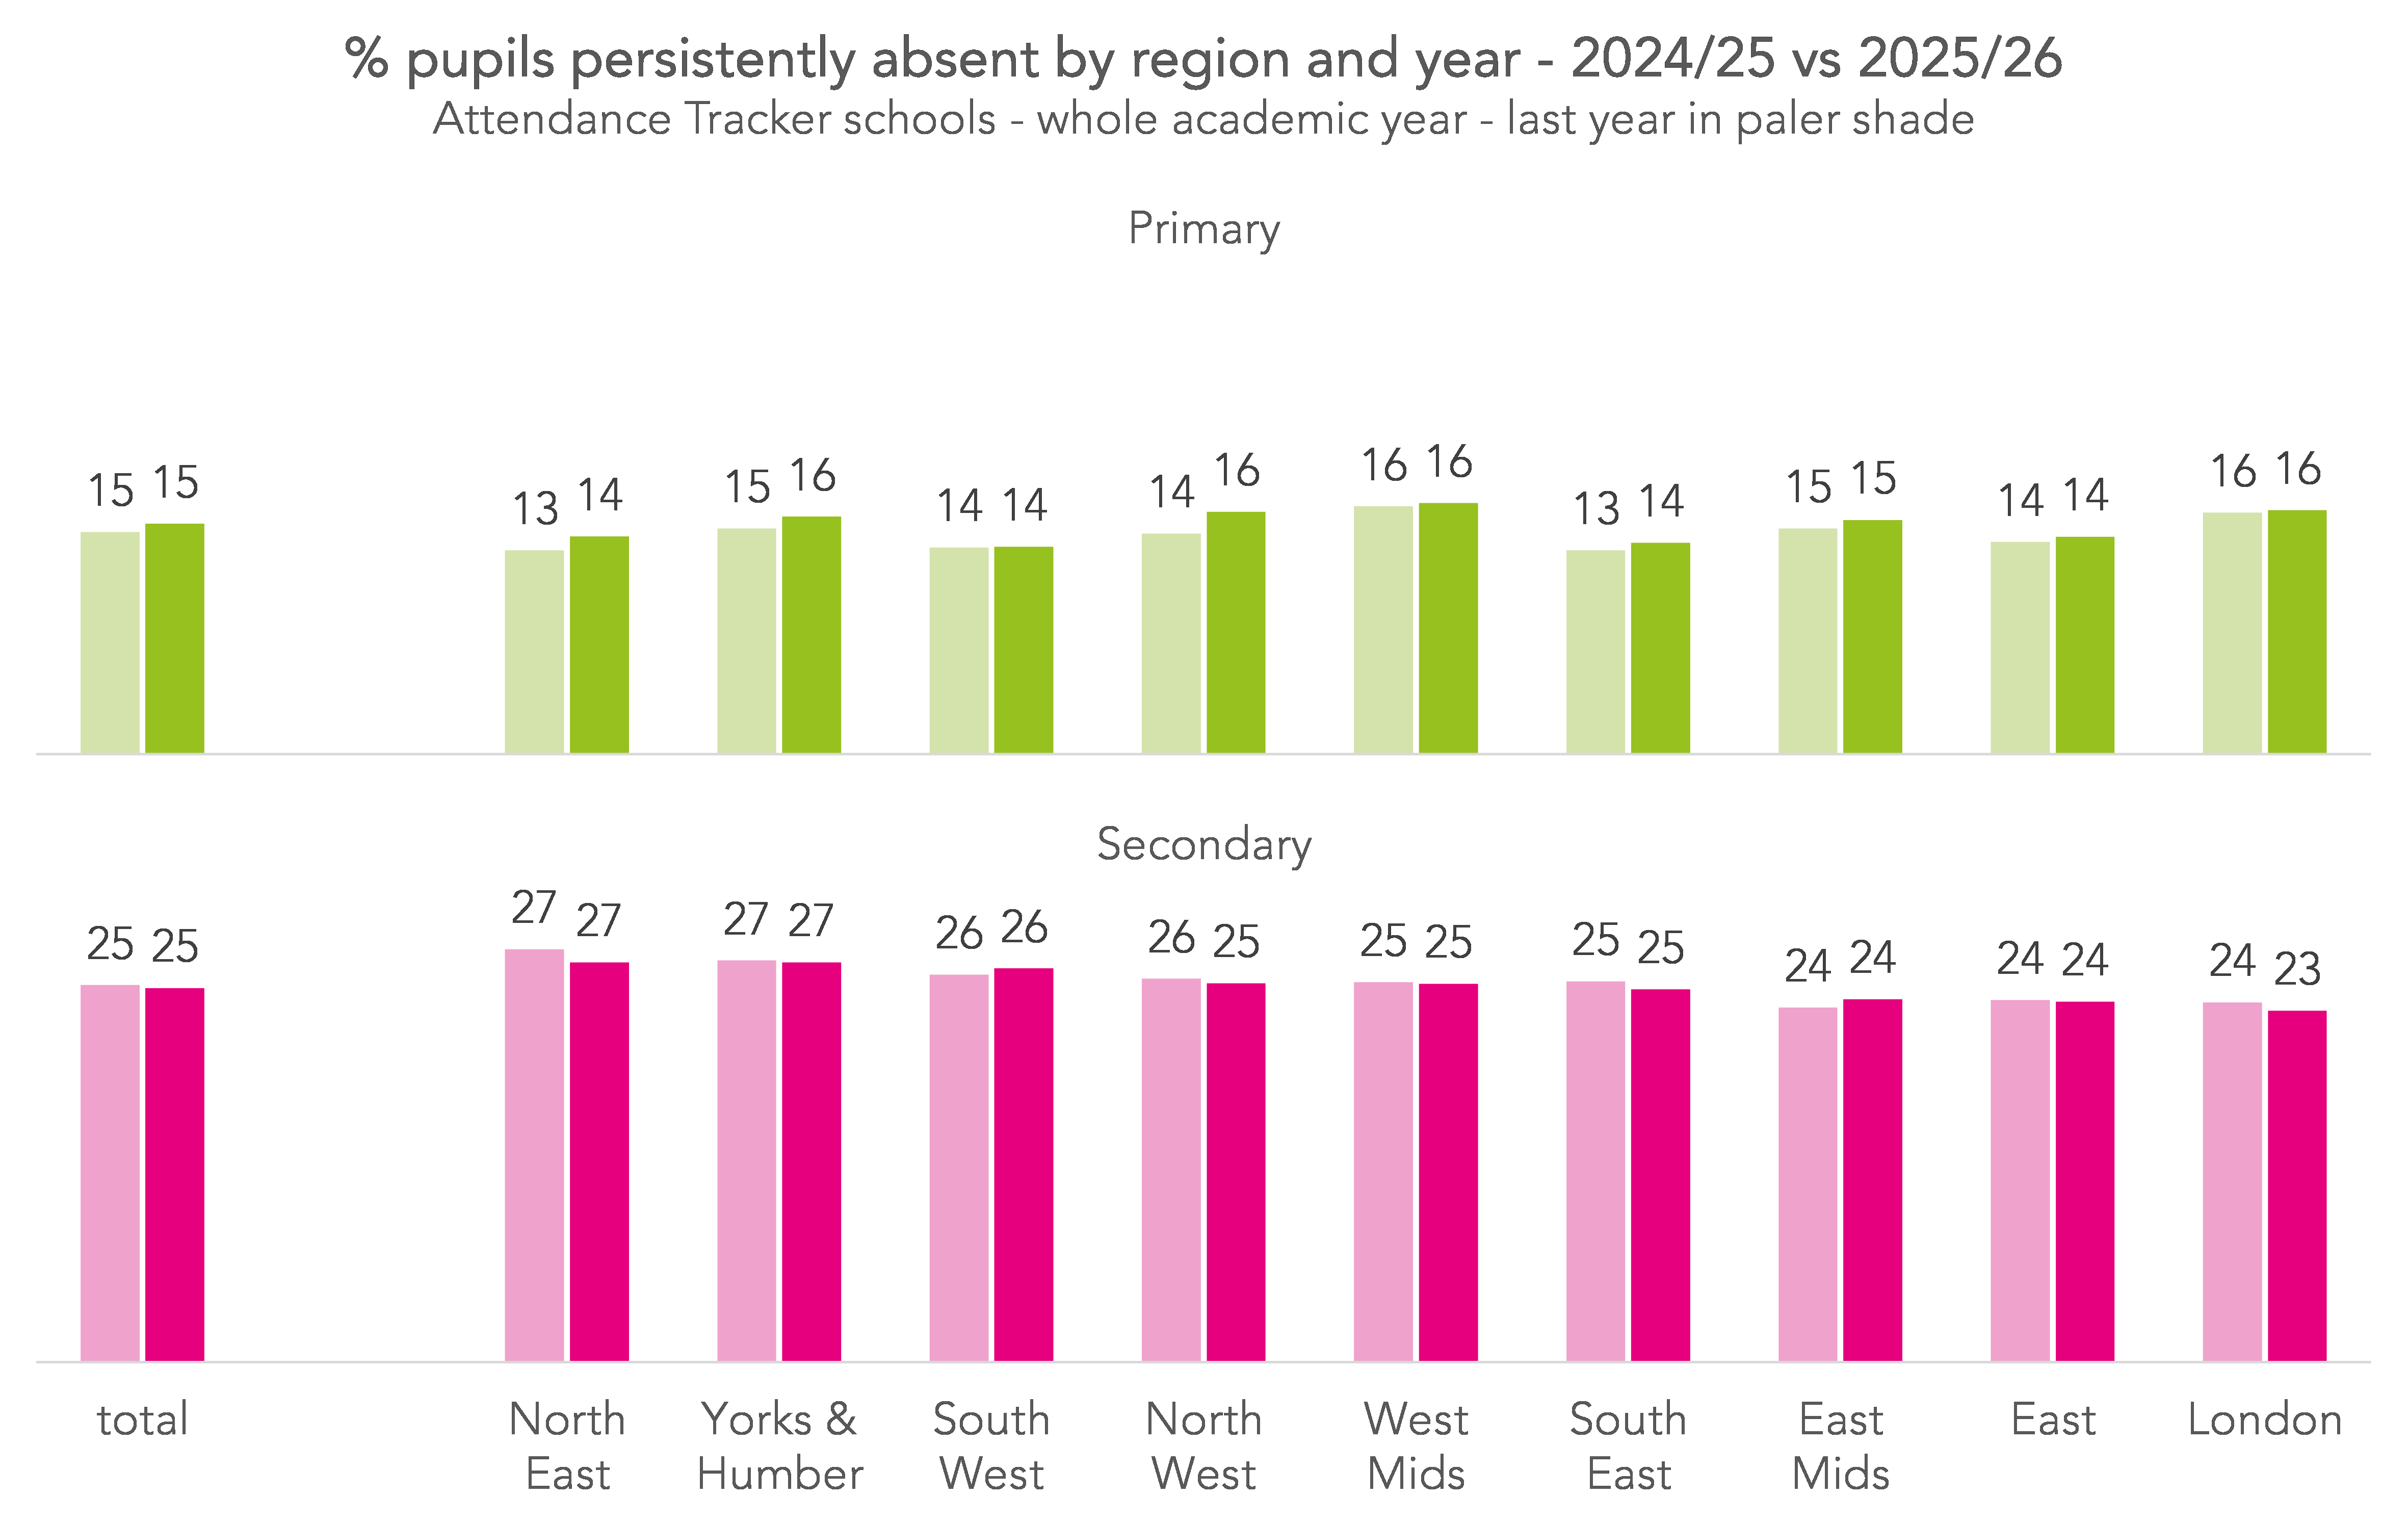
Again, it appears that little has changed since last year, either overall or regionally. Rates of persistent absence at primary only vary by around 2%pts by region – from 14% to 16%. At secondary, the range is slightly bigger, 4%pts – from 23% in London to 27% in the North East. For context, in 2018/19, persistent absence at primary was around 8%, and at secondary, 14%.
Summing up
Overall, then, it appears that for this first time since the pandemic, there may not have been a year-on-year improvement in absence. The big spike associated with the June heatwave won’t have helped, but the rest of the year also saw little improvement.
Additional absence at the end of term, while higher than many would like, can also be ruled out as the cause, being broadly in line with last year.
How much this stalled progress will shape the new education secretary’s plans for the year ahead remains to be seen.
Want to stay up-to-date with the latest research from FFT Education Datalab? Sign up to Datalab’s mailing list to get notifications about new blogposts, or to receive the team’s half-termly newsletter.
[1] This is because a session recorded as a school closure is not considered a “possible session”, a session which a pupil would be expected to attend. Sessions recorded as such are therefore excluded completely from the calculation of absence / attendance rates. These codes are also used for things like staggered starts and INSET days.
[2] We treat the week ending 17th July as the last week of term, even though some schools only finished the following week. We do this because the number of such schools is small (80-85% fewer possible sessions in w/e 24th than w/e 17th) and so the pupil population for w/e 24th July would be much smaller than for the preceding weeks.
[3] In our Attendance Tracker East Midlands schools, there were roughly 25% fewer possible sessions for the last week of term compared with the first week of July, equivalent to one in four schools having already broken up.
[4] A binary variable indicating whether a pupil has been eligible for free school meals at any time in the past six years.
Leave A Comment