This week marks the start of “back to school” season. Inspired by a piece of work released by the Children’s Commissioner for England last year, we thought it would be a good opportunity to look at attendance patterns at the start of last academic year, and the impact these had on attendance across the rest of the year.
As always, the data we’ll use is from our 10,000 Attendance Tracker schools.
The first week of school
Before we begin, we first need to establish when “the first week of school” actually was. To do this we look at the marks schools entered at the beginning of September. Specifically, we look for the first mark which indicates that a pupil was expected to attend.
In our sample of schools, around 15% expected at least some of their pupils to attend for the first time in the week ending 2nd September 2022. A further 82% expected them to attend for the first time in the week ending 9th September 2022.
It’s common for schools to operate some kind of phased return in September. For example, secondary schools may choose to open only to Year 7s for a day or two to allow them to acclimatise, before opening the school fully to all year groups. Some schools also have a staggered start for Reception pupils, in which they attend part-time at first.
To get around this, we’ll restrict our population to pupils who were expected to have attended the equivalent of at least three full days of school (six sessions) by the end of Friday 9th September. This covers around 98% of pupils in Years 1-7, around 90% of pupils in Years 8-11, and around 50% of pupils in Reception.
Absence in the first week
Let’s start by calculating the percentage of sessions missed due to absence[1] at the beginning of the academic year.
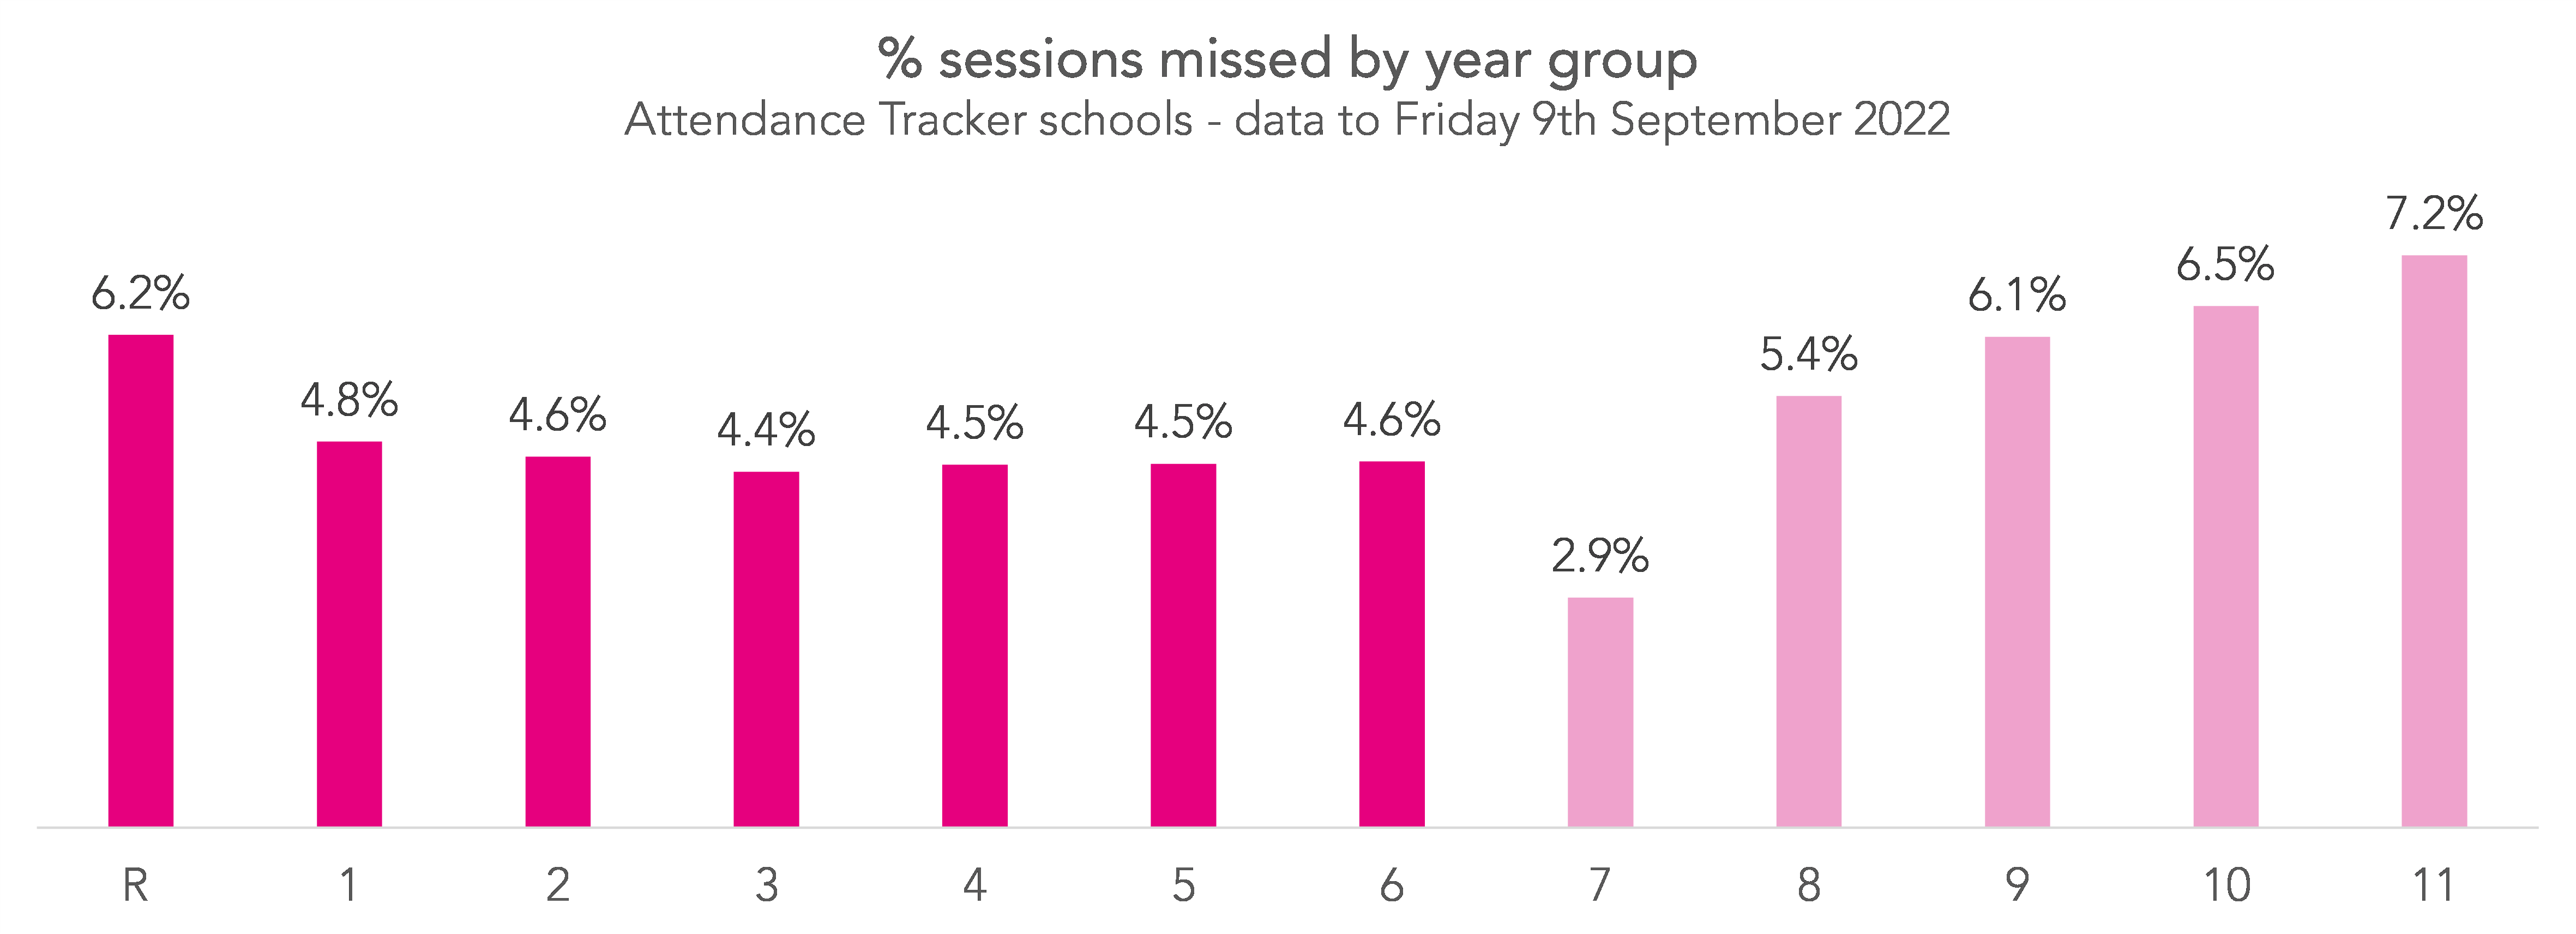
Pupils in Year 7 had the lowest rates of absence, missing an average of 2.9% of sessions, while pupils in Year 11 had the highest, missing an average of 7.2% of sessions. Primary pupils in all year groups missed similar amounts of school – between 4.4% and 4.8% of sessions – apart from those in Reception, who missed 6.2%.
Now let’s look at the proportion of pupils in each year group who missed any school at the beginning of the year, missed at least two days (four sessions), and missed every day.
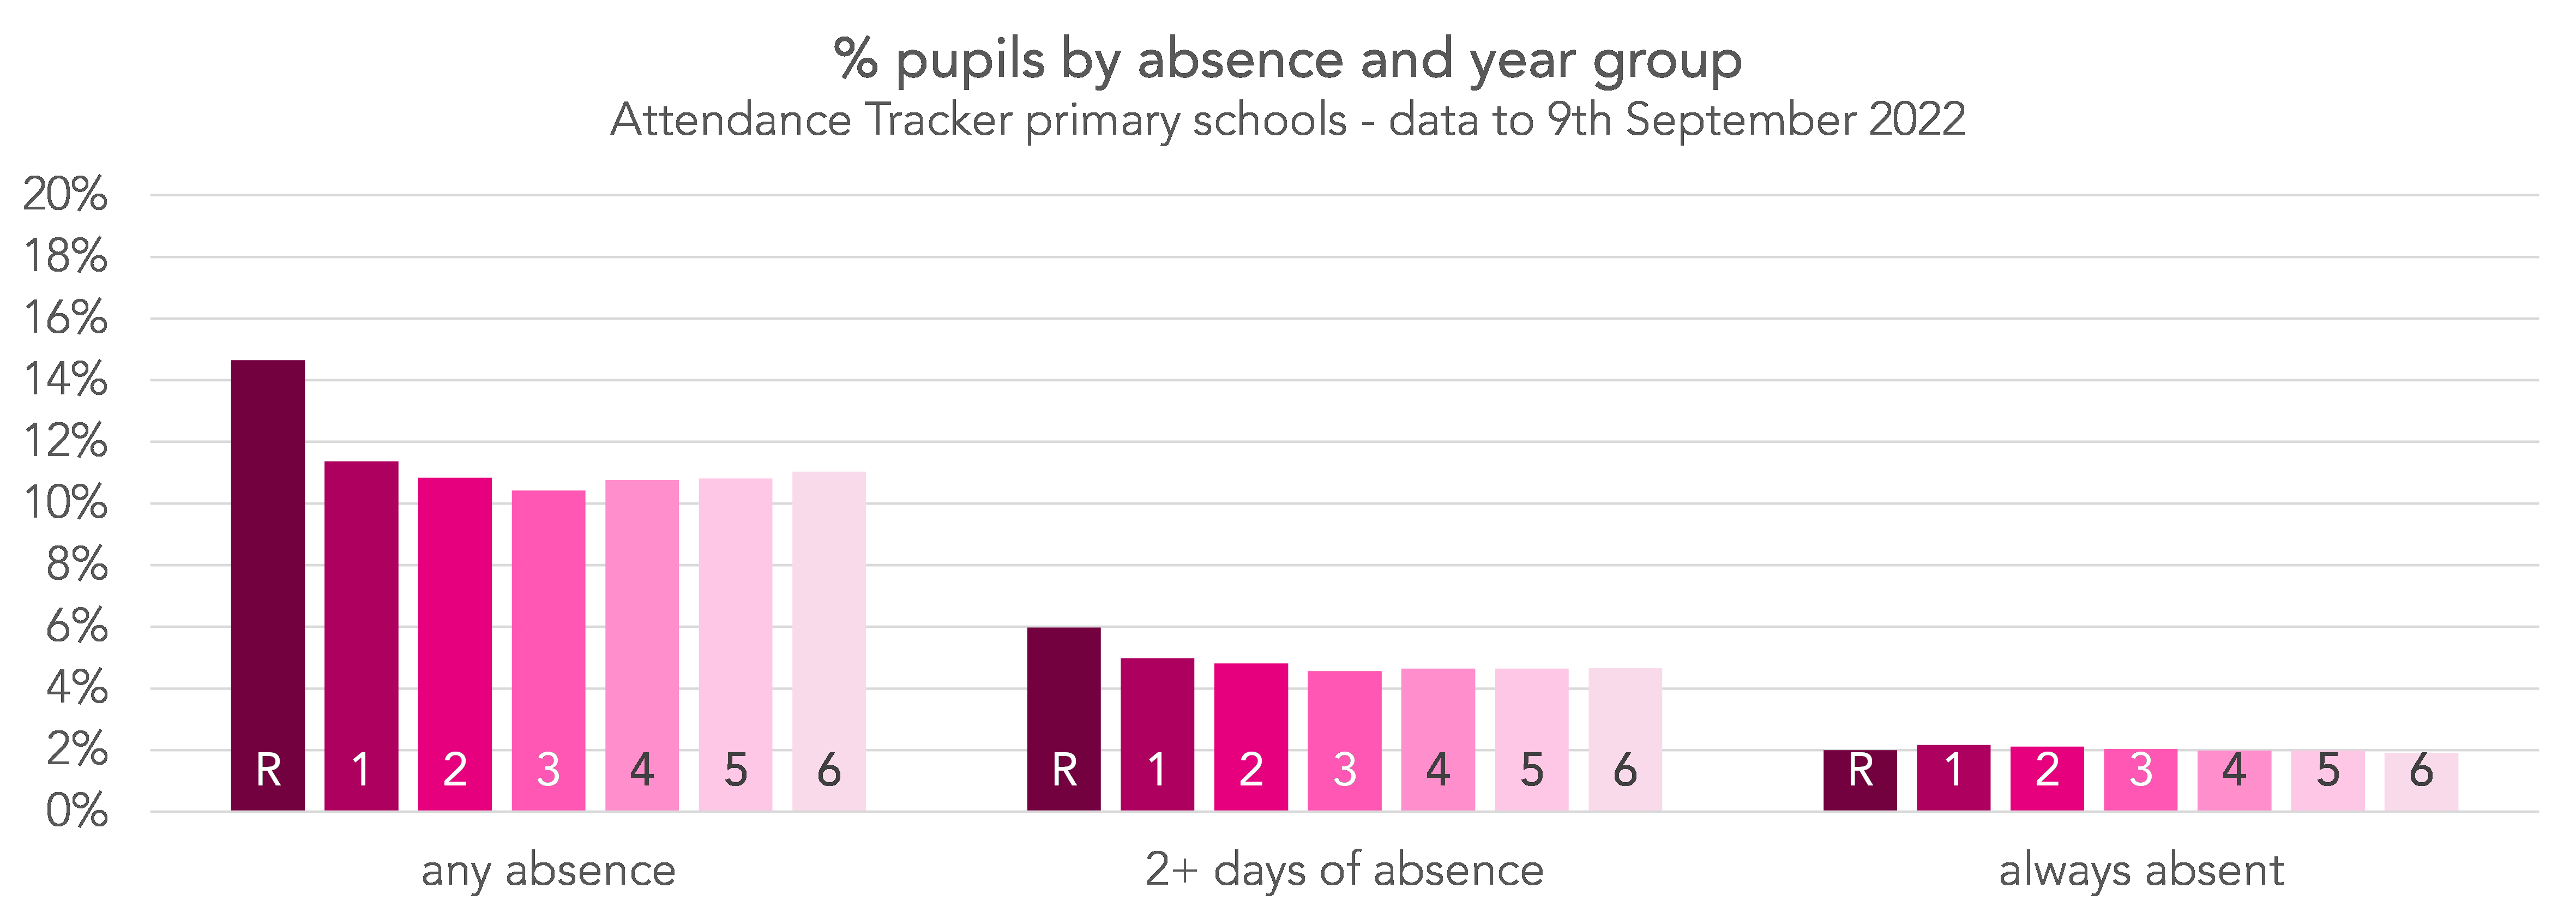
At primary, around 15% of Reception pupils and around 11% of Year 1-6 pupils missed at least one session. Despite Reception pupils missing more school overall at the start of the year, there was no difference in the percentage of pupils who missed all sessions – around 2% of all primary year groups.
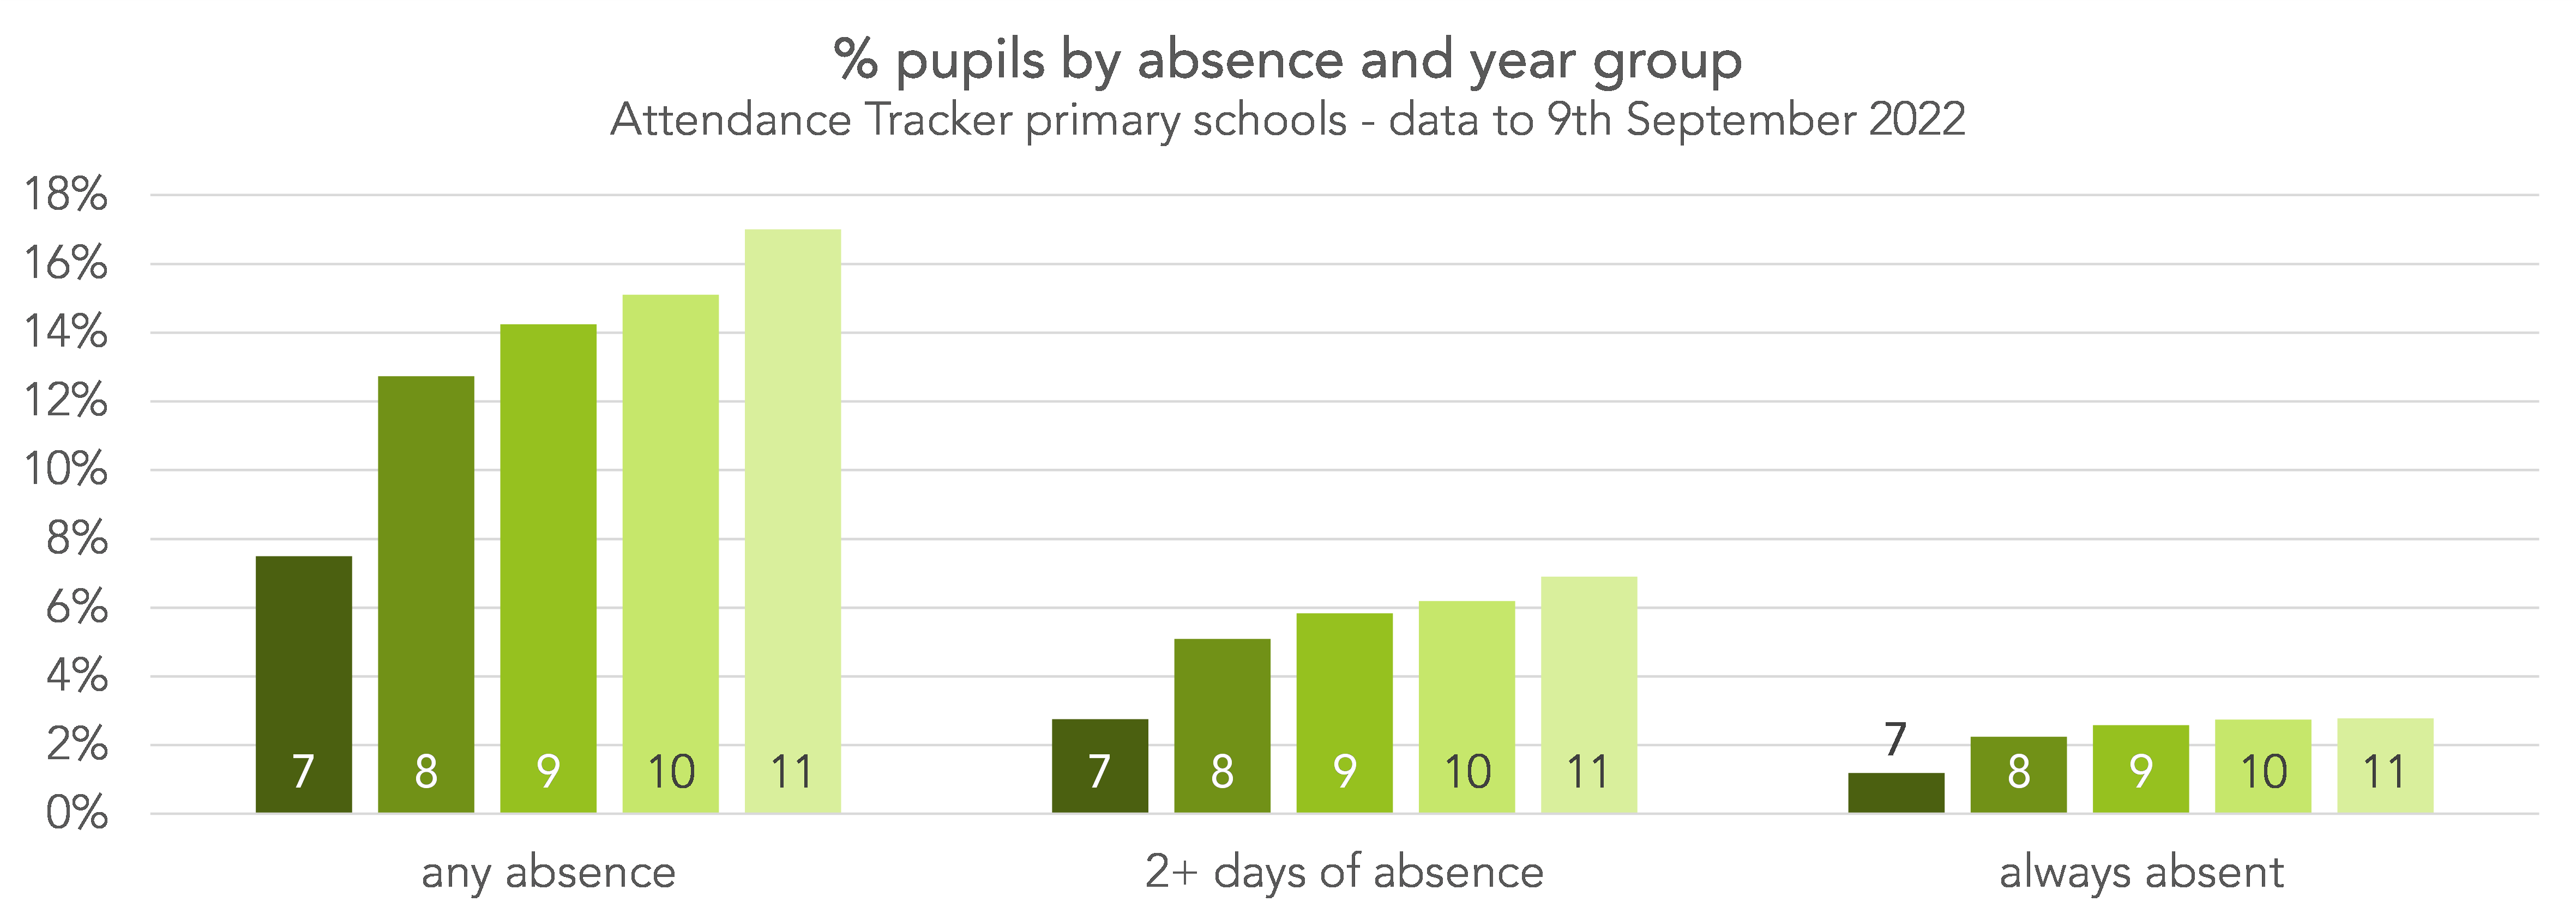
At secondary, around 7.5% of Year 7 pupils missed at least one session, compared with 13% of Year 8, 14% of Year 9, 15% of Year 10, and 17% of Year 11 pupils. Year 7 were also around half as likely as other secondary year groups to have missed all sessions at the start of the year – 1.2% of Year 7 pupils vs around 2.5% of others.
Before moving on, we note that around 3% of pupils absent in the first week of term did not attend at all during September and appear to have left their school during that time. This would seem to suggest that their departure was not expected by their school.
Reasons for absence
Now we’ll look at the reasons recorded for absence in the first week of the school year compared with the whole year. In this chart I’ve grouped Years 1-6 and Years 7-11 as there’s little variation in reasons for absence between these year groups.
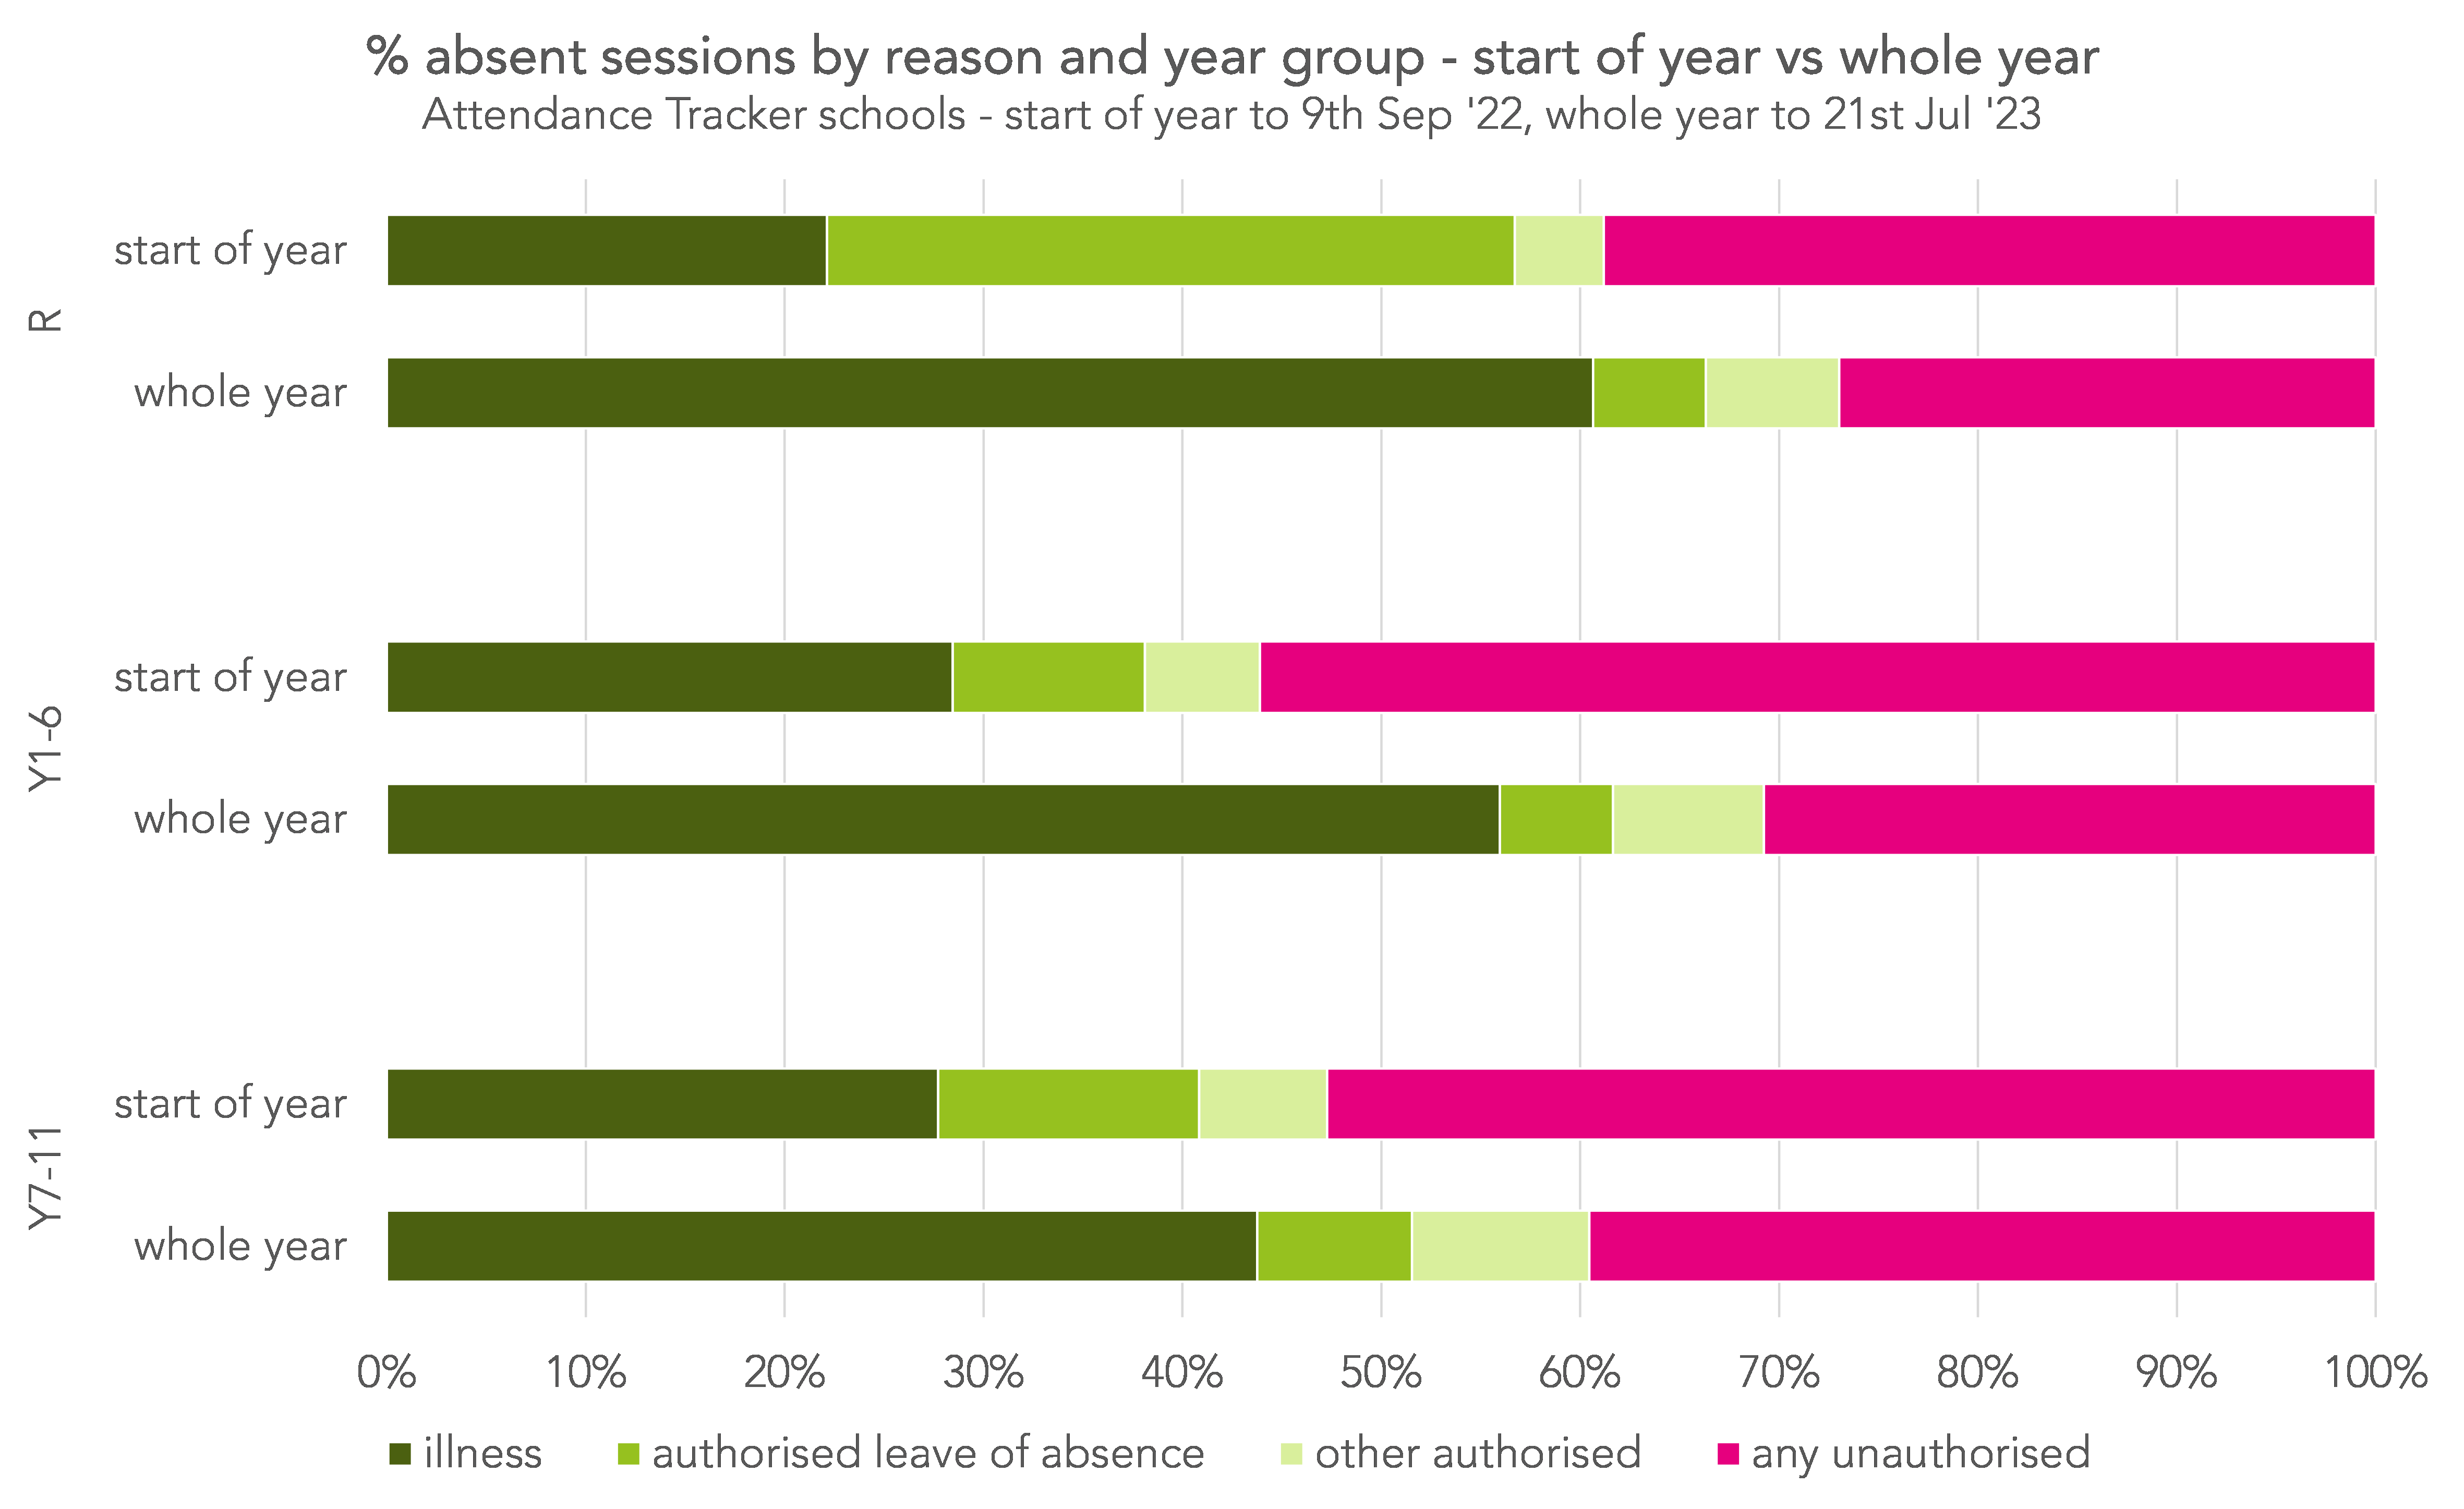
Across all year groups, there was more unauthorised absence recorded at the start of the year than the rest of the year, with the biggest difference for pupils in Years 1-6 (around 56% of sessions missed were due to unauthorised absence at the beginning of the year compared with 31% across the year as a whole).
There was less absence recorded due to illness, and slightly more due to “authorised leaves of absence”. Pupils in Reception had much more absence of this type than those in other year groups at the start of the year – around 36% for Reception pupils compared with 10% for Year 1-6 and 13% for Year 7-11.
The proportion of week one absentees who went on to be persistently absent
Let’s look now at absence across the rest of the year. In this section we’ll limit our dataset to pupils who were on-roll for at least ten weeks[2].
Below, we plot the proportion of pupils with any absence at the start of the year who went on to be persistently absent. We compare these figures with pupils who had no absence at the start of the year.
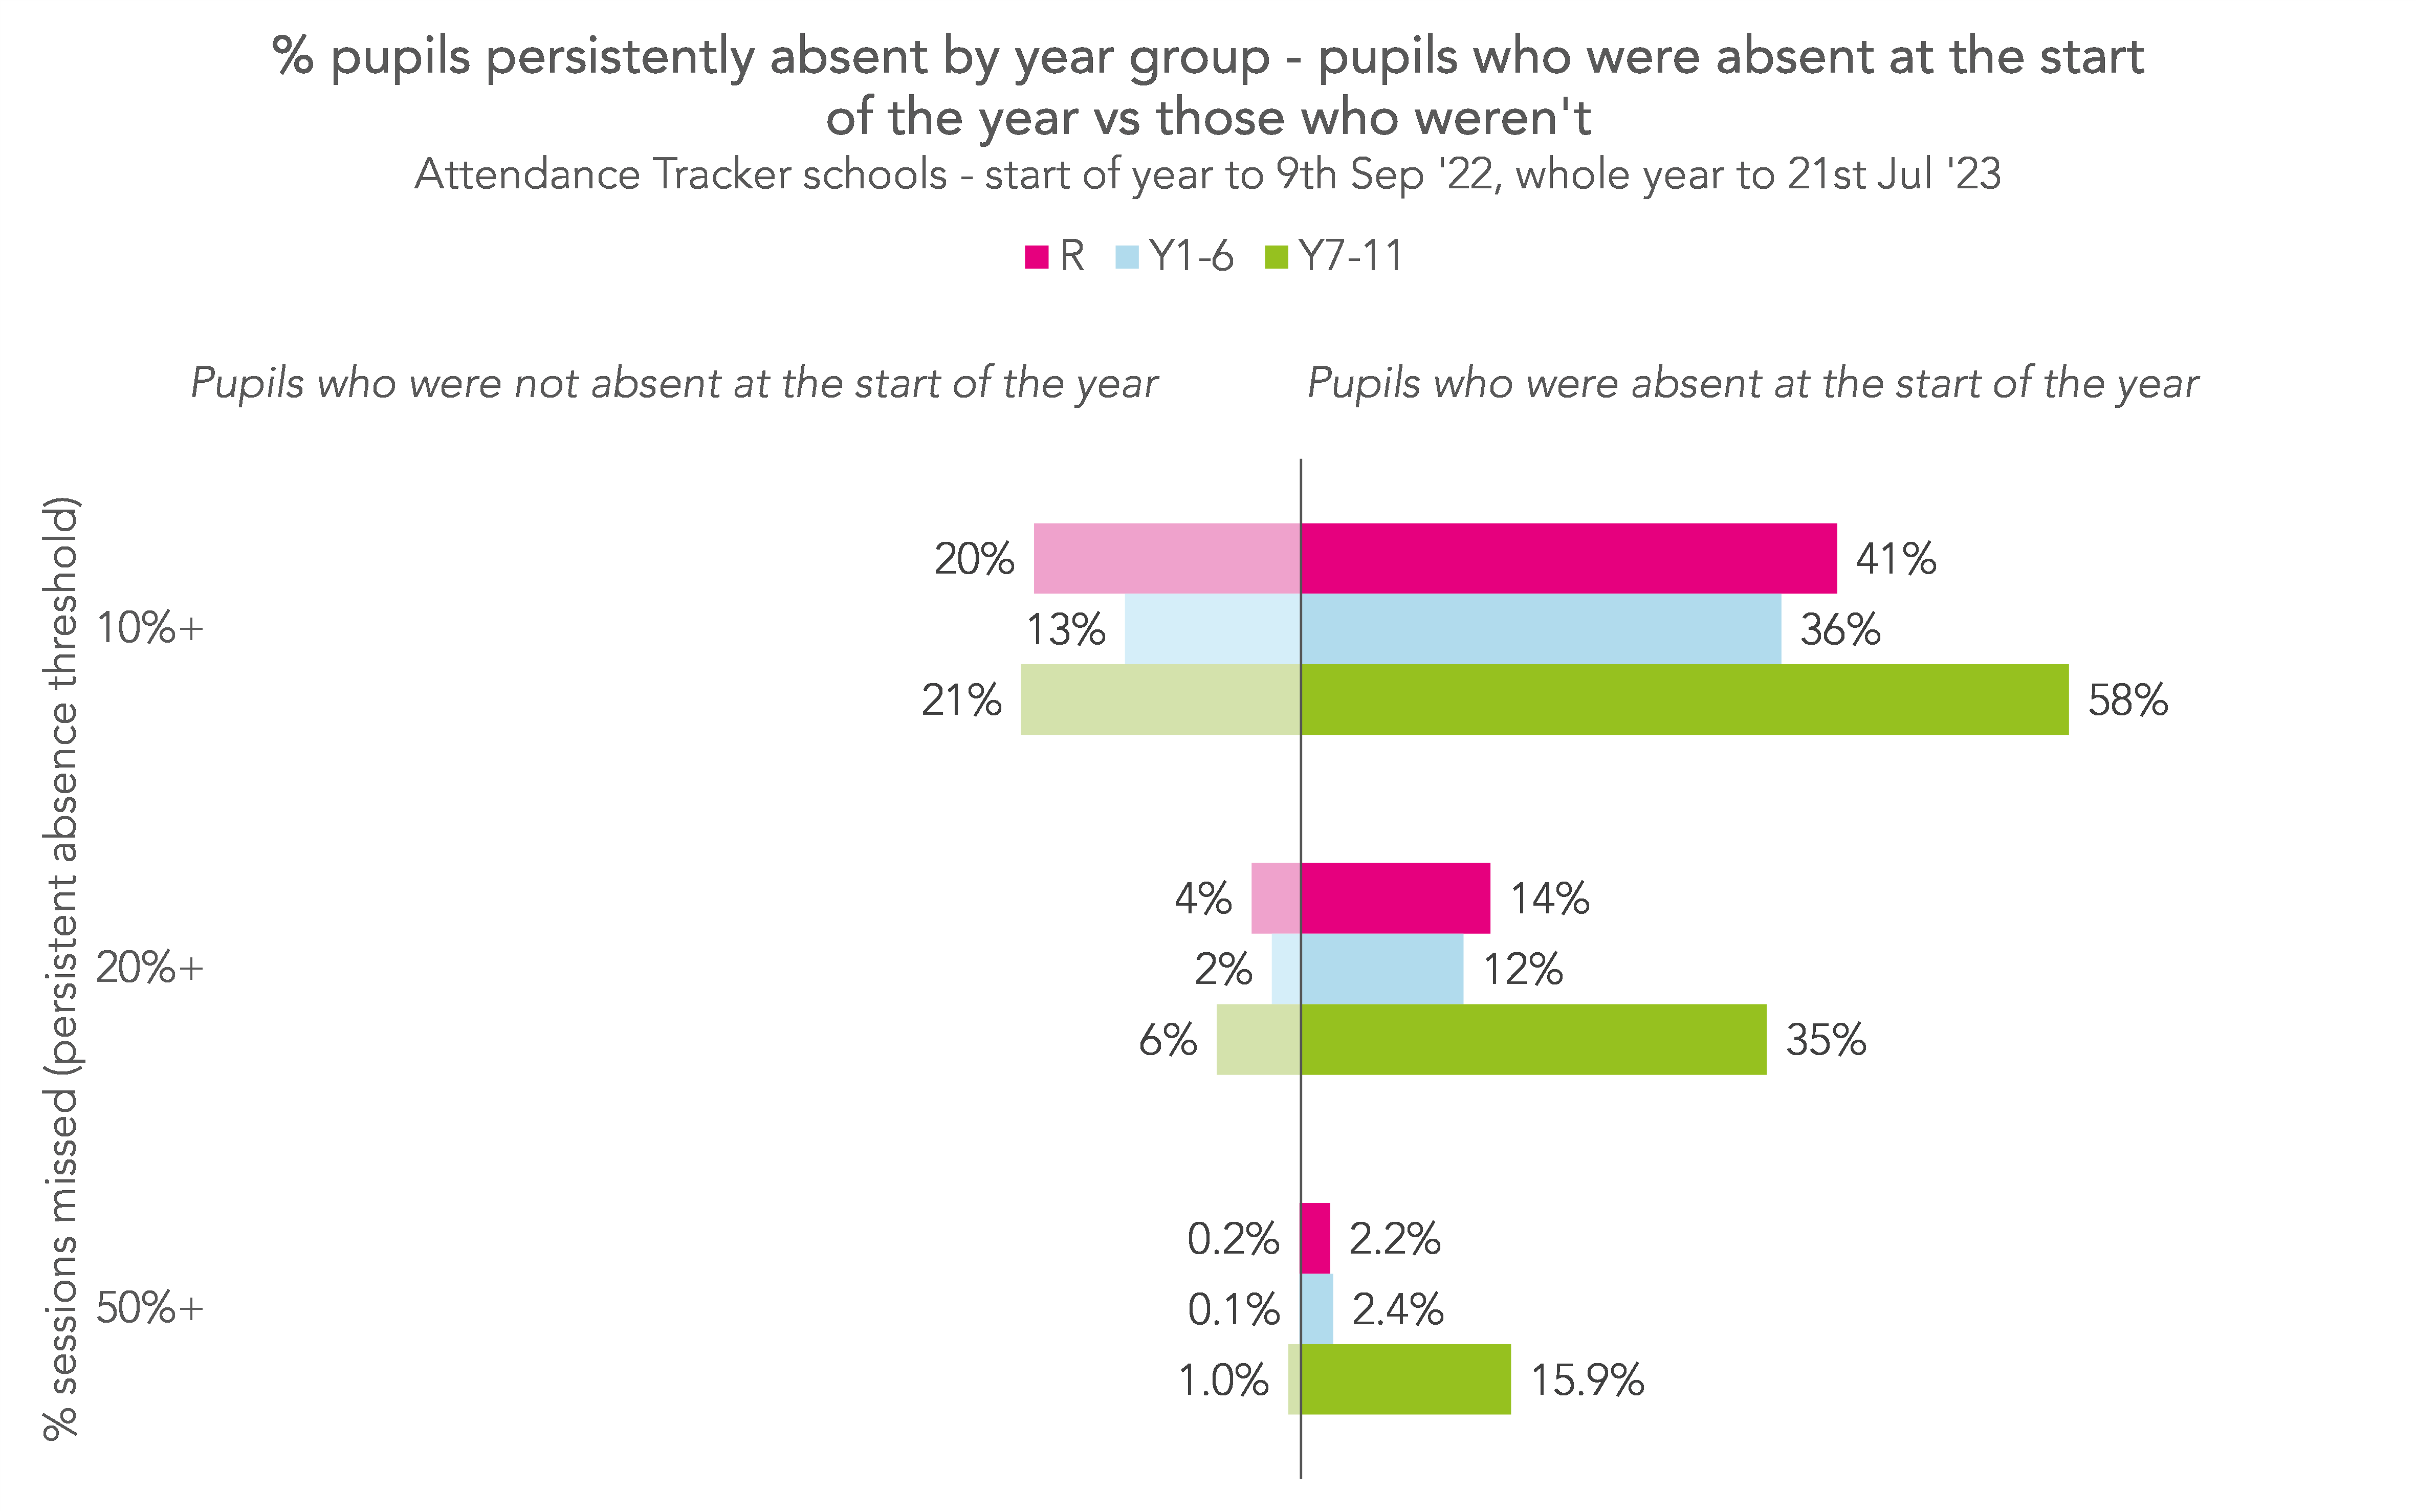
Overall, around 36% of Year 1-6 and 58% of Year 7-11 pupils who missed school at the start of the year went on to miss at least 10% of sessions across the whole academic year. This was true for 13% of Year 1-6 and 21% of Year 7-11 pupils who were ever-present at the start of the year. So pupils who missed school at the start of the year were 2.7 times more likely to be persistently absent than those who didn’t.
The relationship is slightly weaker for pupils in Reception: those who missed school at the start of the year were around twice as likely to be persistently absent than those who didn’t (41% vs 20%).
Looking at the higher persistent absence thresholds – at least 20% and 50% of sessions missed – the relationship is stronger. Pupils in Years 1-11 were between five and six times more likely to miss at least 20% of sessions if they were absent at the start of the year than if they weren’t, and 16-17 times more likely to miss at least 50% of sessions (though absolute numbers of pupils in this last group are small, particularly at primary).
The proportion of persistent absentees who were absent in week one
We can also reverse this question. Rather than asking what proportion of pupils who missed school at the beginning of the year went on to be persistently absent, we can ask what proportion of pupils who were persistently absent missed school at the beginning of the year.
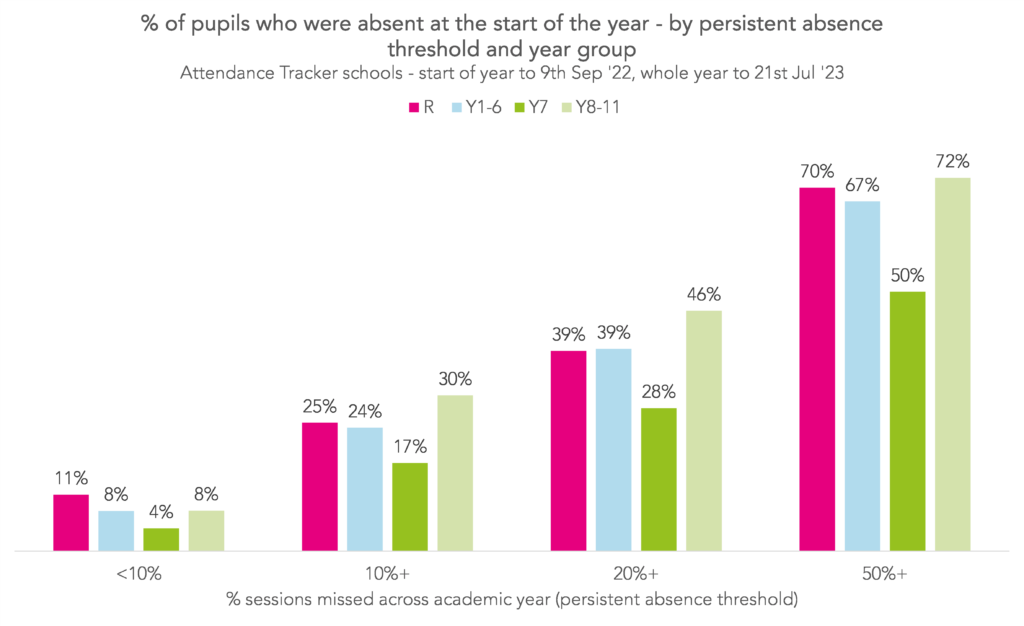
Overall, persistent absentees were much more likely than others to have missed school at the start of the year. In Years 1-11, those who missed at least 10% of sessions were between three and four times more likely to have missed school at the start of the year than those who missed less than 10% of sessions, those who missed at least 20% of sessions were between five and six times more likely, and those who missed at least 50% of sessions were between eight and eleven times more likely.
What next?
Pupils who missed school at the beginning of last academic year were more likely to be persistently absent than those who didn’t.
The tempting explanation is that missing school in the first week gets pupils off on the wrong foot, leading to problems later in the year (indeed, this was the conclusion of the Children’s Commissioner’s report).
But an alternative explanation is that pupils who miss school in the first week tend to have underlying circumstances which make them more likely to be persistently absent (and, probably, to have been persistently absent in the past).
Fortunately, both explanations lead to the same conclusion: keeping a close eye on pupils who are absent at the start of this year would be beneficial.
- We only include sessions whose “statistical meaning” is “absent”. This includes things like illness, medical appointments, and unauthorised absences, but excludes things like full or partial school closures, and pupils who are on-roll but due to start later in the term. See guidance (pdf).
- Actually those who had at least 100 “possible sessions” – AM/PM registration sessions where the pupil was expected to attend. We do this so that when we calculate the percentage of pupils who missed school at the start of the year and went on to be persistently absent, our figures aren’t distorted by pupils who were only on-roll for a couple of weeks at the very beginning of term.
Want to stay up-to-date with the latest research from FFT Education Datalab? Sign up to Datalab’s mailing list to get notifications about new blogposts, or to receive the team’s half-termly newsletter.


Really impressive contribution to an evidence based understanding. Often the underlying reasons for absence will be enduring reasons, so early identification and intervention are crucial.
There’s a correlation in Australia between the av. number of ice creams eaten per day and the av. number of shark attacks per day.
That doesn’t mean eating ice creams causes shark attacks. Correlation is not causation.
There’s very little reason to believe keeping everyone in school in week one will solve attendence for the rest of the year.
Hi James. Yes, but we don’t make any such claim. There is a “correlation is not causation” point to be made about all of this (and also the government’s announcement yesterday) which is that those with underlying problems are more likely to be absent in the first week of term but we make this point ourselves in the conclusion.