Results for A-Levels, T-Levels and other Level 3 qualifications are out today.
And, as always, we’ve analysed the national figures published by the Joint Council for Qualifications and Ofqual to bring you a round-up of everything you need to know.
Grades in England remain similar to last year, but slightly above pre-pandemic levels
For the last few years, the big headlines about A-Level results have been focused on grading. But this year, for the first time since 2020, there haven’t been any dramatic changes to the way that A-Levels have been graded.
Pre-pandemic, grades tended to be consistent across years. But in 2020 and 2021, following the cancellation of public exams, grades rose sharply. In 2021, 44.3% of GCSEs were graded A or above, compared to 25.2% in 2019.
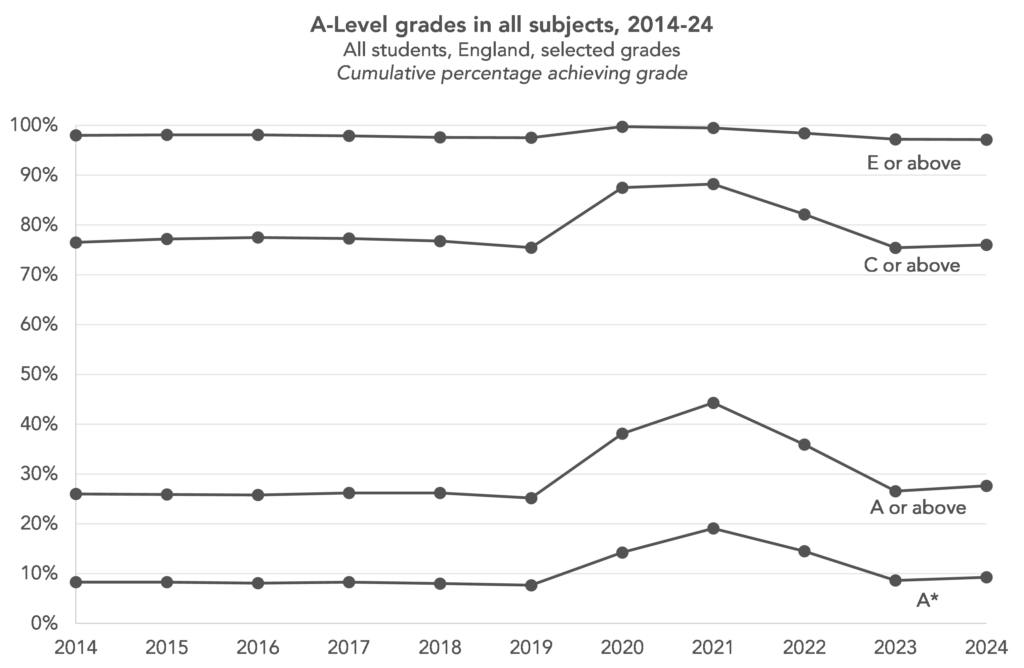
In 2022, grades were set to a mid-point between 2021 and 2019, to avoid a sharp fall. And last year, they returned to close to 2019 levels. In theory, awarding bodies were able to award higher grades this year if they believed a higher quality of work had been produced by this year’s candidates[1]. This may well have happened a bit as results are slightly up this year. Last year, 26.5% of entries received a grade A* or A, compared to 27.6% this year, an increase of 1.1 percentage points. And in 2019, 25.2% received an A* or A, so this increase this year compared to pre-pandemic is 2.5 percentage points.
We should also note that, while last year's grades in England were back to pre-pandemic levels, that wasn't the case in Wales and Northern Ireland. As A-levels in Northern Ireland and Wales are not regulated by Ofqual, we wouldn't necessarily expect their approach to getting back to pre-pandemic grades to be the same as England's, so this was not entirely unexpected. There are also some differences in how A-Levels are structed in Wales and Northern Ireland: AS-levels remain a constituent part of A-levels in Northern Ireland and Wales too, so last year's results contained results from exams taken the previous year, when grades were generally higher.
All that noted, this year grades in Wales and Northern Ireland have returned to levels very similar to pre-pandemic. Which means that there has been quite a sharp fall in grades compared to last year.
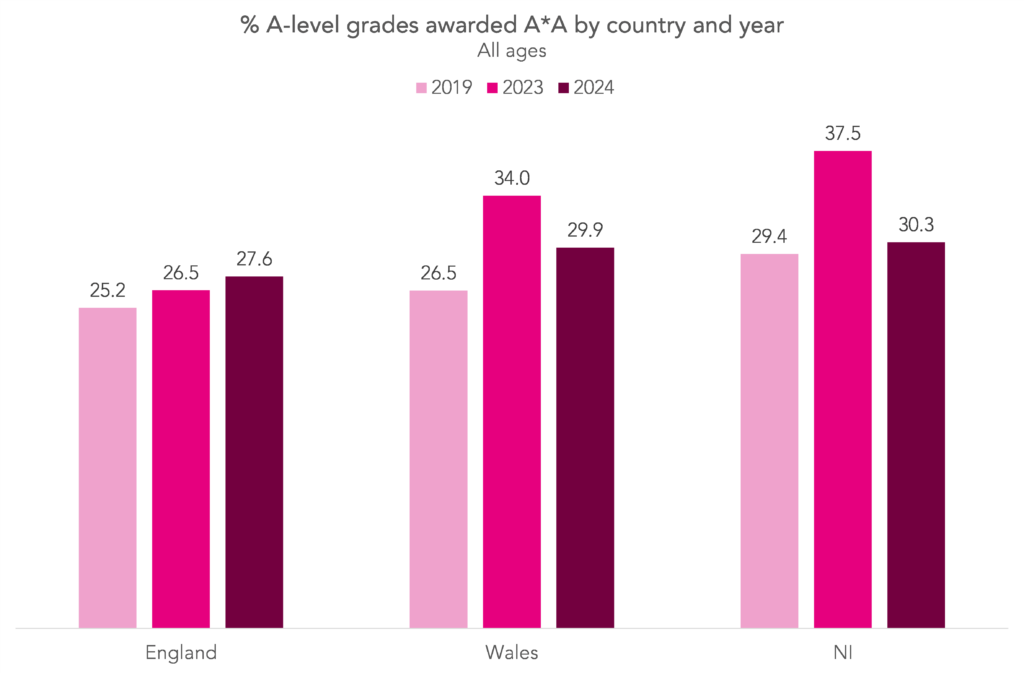
In Wales, the proportion of entries grade a or above has fallen from 34.0% to 29.9%, and in Northern Ireland the proportion has fallen from 37.5% to 30.3%.
But subject differences in grading remain
As we’ve seen, England completed its return journey to 2019 grading standards last year. While grades are similar overall, that doesn’t necessarily mean they’ve been consistent at the subject level. Grades might have increased in a subject if this year’s entrants had a higher level of prior (GCSE) attainment relative to other subjects.
With that in mind, it is unsurprising that there was little difference in A*-A grades awarded compared to 2023 in each subject, with a few exceptions.
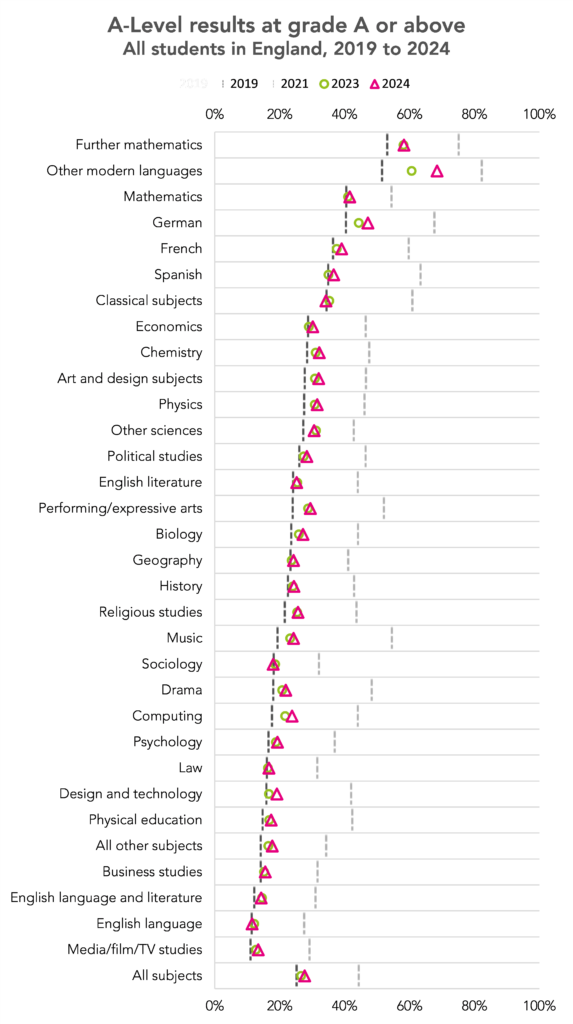
Leaving the “other modern languages”, a portmanteau category for languages other than French, German and Spanish, to one side, there was an increase of at least 2 percentage points in A*-A grades awarded in computer science, design and technology and German.
Compared to 2019, the percentage of pupils achieving A*-A was at least 5 percentage points higher in computer science, further maths, German, performing/ expressive arts and “other modern languages”.
A*-A grades were lower compared to 2019 in just two subjects, sociology and classical subjects[2].
The chart below allows you to select an A-Level subject and see the grade distribution in 2019, 2021 and 2024.
Putting increases in entries in context
In our preview post, we highlighted some subjects which looked like they would have big changes in entries from last year. We thought we’d see increases in maths, further maths, computing and physics, and decreases in drama, geography and sociology. And indeed, we have.
But what do these one year changes look like in context? Below, we compare the actual number of entries over the past six years with a hypothetical number, which is based on the trend in entries for all subjects since 2019.
First, the subjects with the biggest falls since last year:
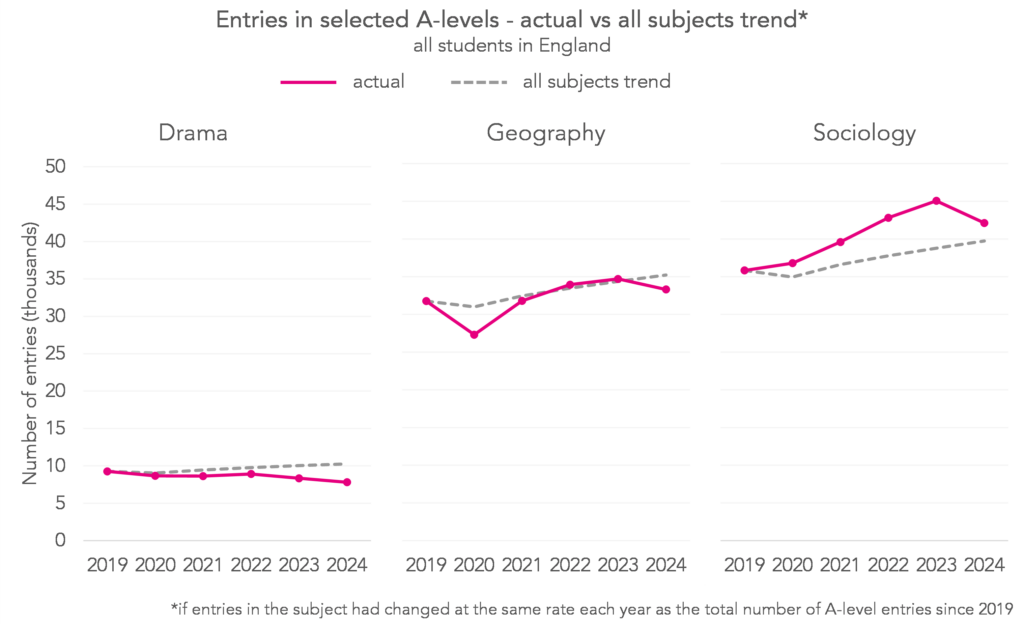
Entries in drama have been trending down steadily since 2019, with an acceleration in 2023 and 2024. For geography and (particularly) sociology, this year’s drop bucks a trend of increasing entries over the past few years. But geography has had a drop in entries before, back in 2020, and recovered; the same could happen again. And the drop in sociology this year may just turn out to be another blip.
And the subjects with the biggest increases:
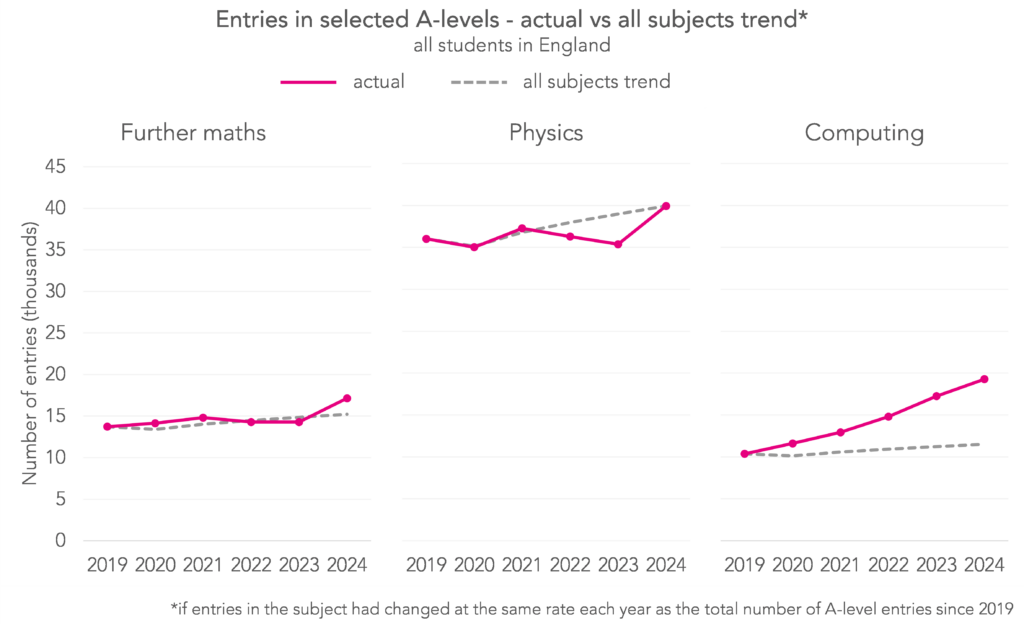
Computer science entries have been trending up steadily since 2019. The increase in physics entries reverses the trend in falling entries since 2021.
There were huge gender differences in T-Level subject choice, and retention rates still don't look good
Results for students completing T-levels have also been published today. These are still relatively new vocational qualifications with occupational specialisms. 16 have now been rolled out, with plans for 24 in total[3].
7,380 results were issued to students today, slightly less than were given results in A-level Spanish.
But although 16 occupational areas were available, some dominate more than others, particularly for female students.
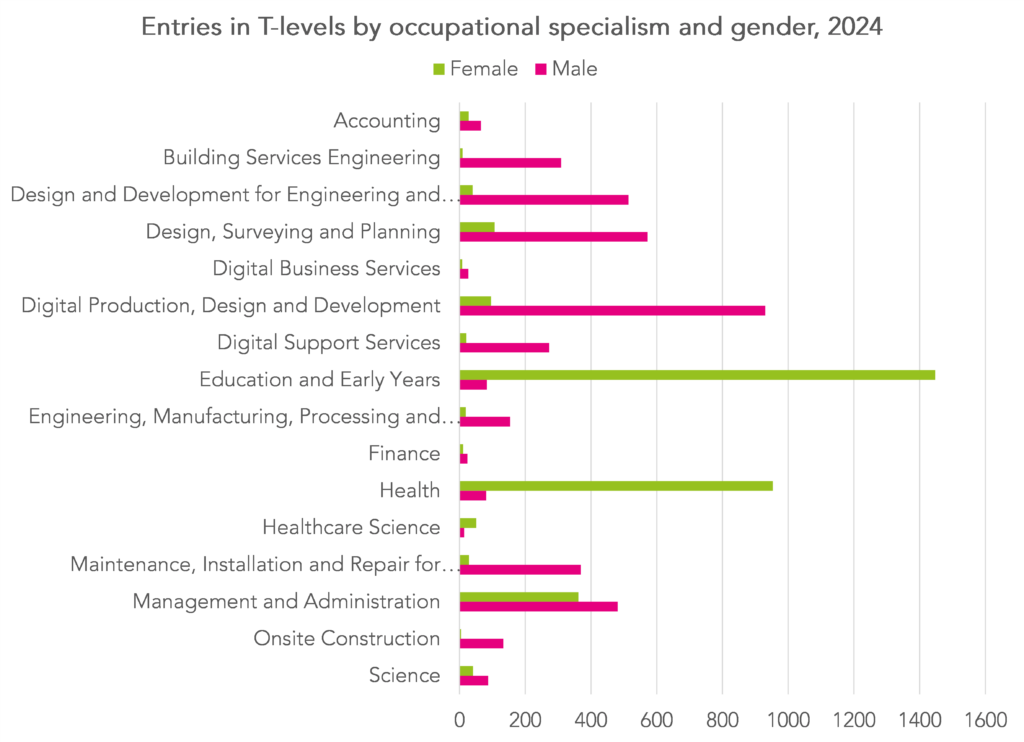
Almost 75% of entries in T-levels by female students were in education and early years and health.
There was more of a spread of entries across the specialisms among male students.
The Department for Education publishes a “retained and assessed” measure, broadly speaking the proportion of students who start a course who go on to complete it.
Today’s statistical release shows that 29% of T-levels started were not completed. For comparison, DfE also provides the same measure for students who completed “large” (i.e. equivalent to 3 A-levels) vocational and technical qualifications. Although data for the 2023/24 has not yet been published, among the previous cohort completion stood at 25%. For students taking 3 A-levels, the equivalent figure was 12%. However, bear in mind that we’re not necessarily comparing like with like (A-Level entrants tend to have higher GCSE attainment, for example).
Other VTQs remain popular among Level 3 students
As T-levels bed-in, other vocational and technical qualifications (VTQ) remain available. These cover a wide range of qualifications in a wide range of subjects but are usually classified as applied general qualifications (of which BTEC is the most widely known) and technical certificates.
39,000 results were awarded a qualification with a Distinction/ Merit/ Pass grading structure equivalent to 3 A-levels (such as the BTEC extended diploma). Another 20,000 results were awarded in qualifications with the same grading structure but equivalent to 2 A-levels (such as the BTEC diploma). Both these figures are around 5% down on last year. Note that some double counting of students is possible among those numbers although it is likely to be small.
In principle, according to UCAS at least, a distinction is equivalent to grade A at A-level although we had some thoughts about that a few years ago.
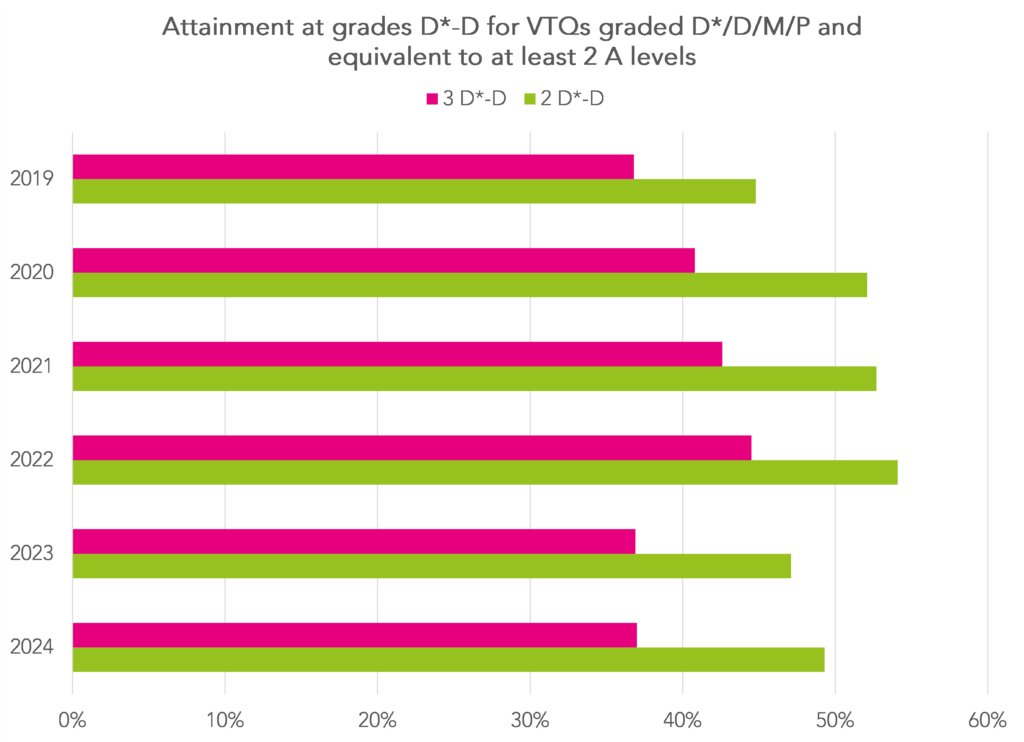
Compared to 2019, the percentage of students achieving a qualification equivalent to DDD or higher is largely the same. However, the percentage achieving DD or higher is slightly higher (49% compared to 45%).
Entries to A-Level STEM subjects by gender
One thing that caught our eye this morning was the increase in maths entries since last year from male students.
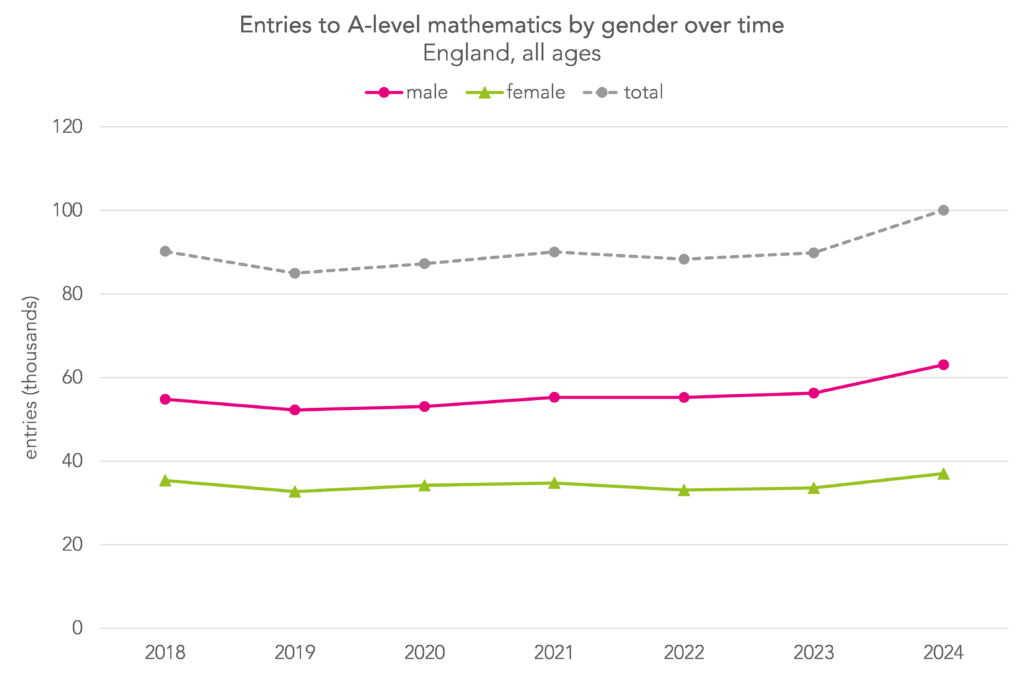
Did this drive the overall increase in entries to maths? And what about other STEM subjects with big increases in entries? The answer to the first question is yes and no. Entries in maths increased by around 10k – around 7k for male students and 3k for female. So, in absolute terms, more of the overall increase is down to an increase in entries from male students. But the proportional change was roughly the same for both genders – an increase of around 12% for male students and around 10% for female. So, the greater contribution from male students to the overall increase in entries is largely explained by the maths cohort tending to contain a greater proportion of male than female students.
What about other STEM subjects?
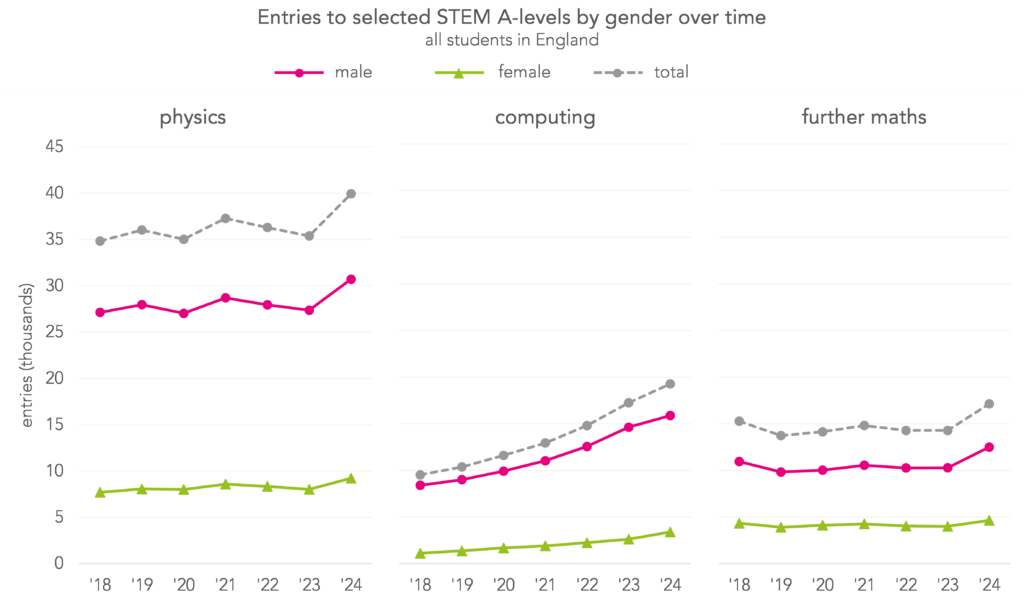
Well, in all three subjects, more of the increase in entries is due to increases in entries among male students.
But in physics, as in maths, the proportional change was roughly the same for both genders (up 12% for male students, up 15% for female). In further maths, it was slightly higher for male students (up 22%) than female (up 16%). But in computer science, the proportional increase was much higher for female students (up 29%) than male (up 9%).
Not much change in the gender gap at A-Level
The gender gap at A-Level doesn’t tend to be quite as clear cut as it is in earlier years. Male students tend to be more likely to achieve A* grades, but female students tend to get higher grades on average.
During the pandemic, the gender gap in grading at both Key Stage 4 and Key Stage 5 grew. And at A-Level, the typical gap at A* level reversed: during this period, female students were more likely to achieve a top grade than male students.
The gender gap returned to roughly pre-pandemic levels last year, and remains similar this year.
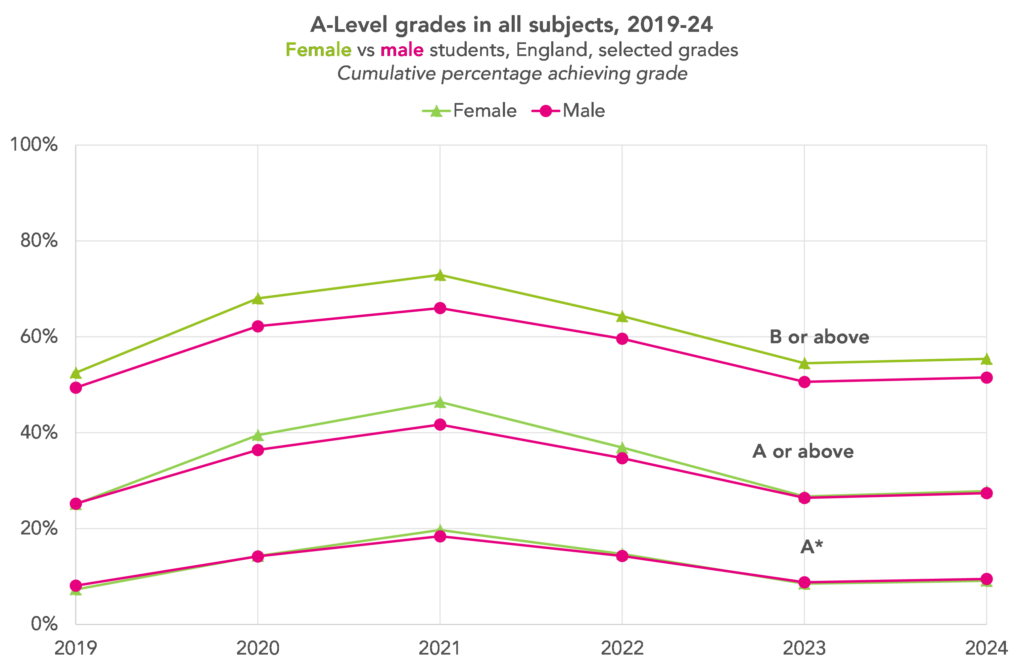
The gap in top grades widened very slightly: last year, 8.8% of entries from male students and 8.5% of entries from female students achieved an A*, a gap of 0.3 percentage points. This year, 9.5% of entries from male students and 9.1% of entries from female students achieved an A*, a gap of 0.4 percentage points.
We will be keeping our eyes peeled for the gender gap in GCSE results next week: reports do suggest that we could see a relative fall in girls’ attainment.
Regional gaps remain, but may not tell the whole story
Regional gaps in grading have been around for a long time, and they’re not going anywhere this year.
The chart below shows the proportion of students achieving a grade A or above this year, in 2019, the last year before the pandemic, and in 2021, when grading was at its highest.
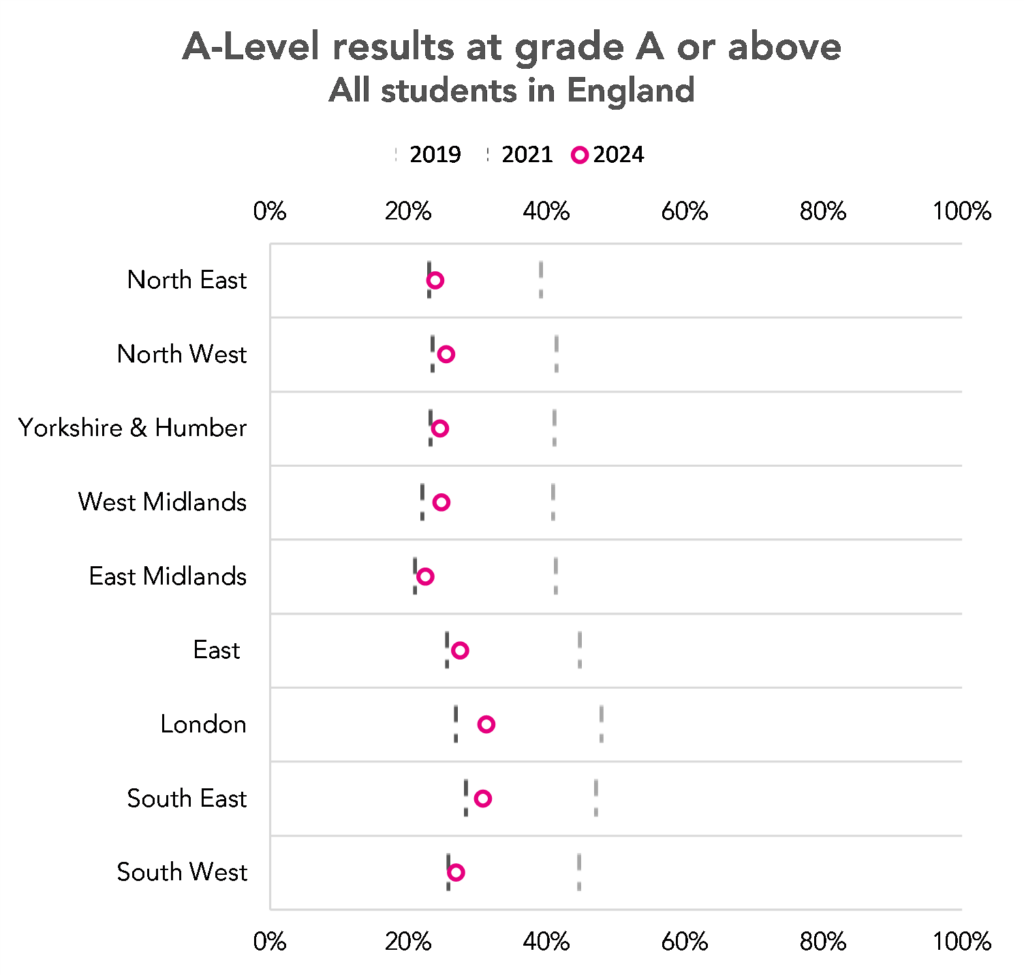
The proportion is consistently highest in London and the South East. In both areas, close to a third of entries received top grades, compared to 22.5% in the East Midlands.
And in both these regions, particularly London, grades are currently higher than pre-pandemic, while in most of the country they have returned to 2019 levels.
But, while these differences should not be ignored, we would sound a note of caution. Differences between regions can mask even more significant differences within regions. Too much focus on region may be a distraction from where the real focus should be: on supporting low attaining students, wherever they are.
Students in independent schools are still more likely to achieve top grades
Ofqual publishes data on attainment by centre type at a national level.
Across all subjects and all centre types, the proportion of A-levels awarded grades A*-A in 2024 was largely the same as in 2019. Results were slightly lower among students at FE colleges and slightly higher among those in independent schools.
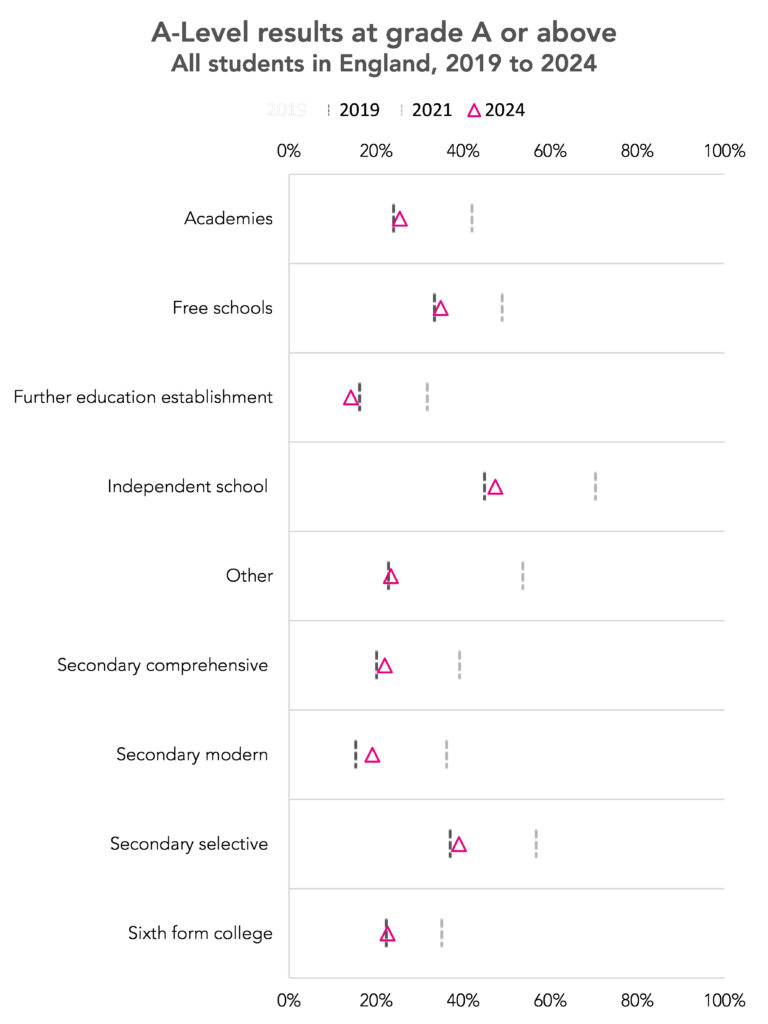
Although Ofqual appear to have updated their 2019 figures to take account of centres’ most recent self-declared types, they have not provided recalculated 2021 figures. We have used those from a previous release with the caveat that the figures may be different if the current type was used.
Bear in mind that the centre types are self-declared by centres. The categories used by Ofqual aren’t in themselves mutually exclusive (a secondary comprehensive can be an academy, for example). Every year we recommend they switch to a more appropriate set using data from Get Information About Schools. Consequently, it’s probably not worth reading too much into this breakdown at this stage.
One last thing...
Before we sign off, just one final point. Although it's exciting (especially for data bods like ourselves) to look at each year's results the day they come out, it takes a bit of time to process the data and work out what it means for the population as a whole. The stats that really matter tend to be found in DfE's more detailed publication on Level 2 and 3 attainment by age 19, which are due to be published in April. And these don't usually get anything like the same attention as those that come out on results day.
[1]: This is why A-levels and GCSEs can’t be said to be “norm-referenced”. The approach taken could generally be characterized as a weak form of criterion referencing
[2]: Actually, another portmanteau category for a number of individual subjects
[3]: Accounting, Design and Development for Engineering and Manufacturing, Engineering, Manufacturing, Processing and Control, Finance, Maintenance, Installation and Repair for Engineering and Manufacturing, and Management and Administration were awarded for the first time this year.
Want to stay up-to-date with the latest research from FFT Education Datalab? Sign up to Datalab’s mailing list to get notifications about new blogposts, or to receive the team’s half-termly newsletter.


Have you seen the grade boundaries for science! And E in 2023 was 44 this year it’s 67 how is that not drastically different!
In subjects like art the grade boundaries may have remained the same but the moderators have obviously had an agenda and marked students down at the top end!
Disgusted after 40 years of teaching to see so many students upset across different subjects and with clearing now having 30,000 spaces they have been told to reapply for their course through clearing
Time to quit I think
Hi Bonnie. I’m not sure which specification you’re referring to but the argument the Awarding Body would no doubt make is that 44 marks in 2023 was an equivalent standard to 67 marks in 2024. Whether this really is the case is a fair question to ask. On top of that, there is variability in grading between examiners, and this affects some subjects more than other (https://assets.publishing.service.gov.uk/government/uploads/system/uploads/attachment_data/file/759207/Marking_consistency_metrics_-_an_update_-_FINAL64492.pdf)