Just as we were finishing up for the summer, the Secretary of State for Education announced in a speech that the Department for Education (DfE) would be providing schools with analysis of the proportion of children reaching a good level of development (GLD) at the end of the Early Years Foundation Stage (EYFS) compared to similar schools[1].
This follows the use of similar schools in recent attendance reports.
We, of course, are big fans of similar schools and produce a Schools Like Yours tool where you (rather than DfE) can decide what similar means.
In this article we think about what “similar” means when it comes to GLD.
Sign up to our newsletter
If you enjoy our content, why not sign up now to get notified when we publish a new post, or to receive our half termly newsletter?
Data
We use EYFS GLD data from the National Pupil Database (NPD) from 2022 to 2024.
We link this to a small set of data on pupil backgrounds from School Census. This includes:
- month of birth
- gender
- first language (English/ other)
- ethnicity
- eligibility for free school meals[2]
- IDACI score of home postcode
The importance of context
In the chart below, we show the proportion of children in 2024 who reached a good level of development broken down by various characteristics.
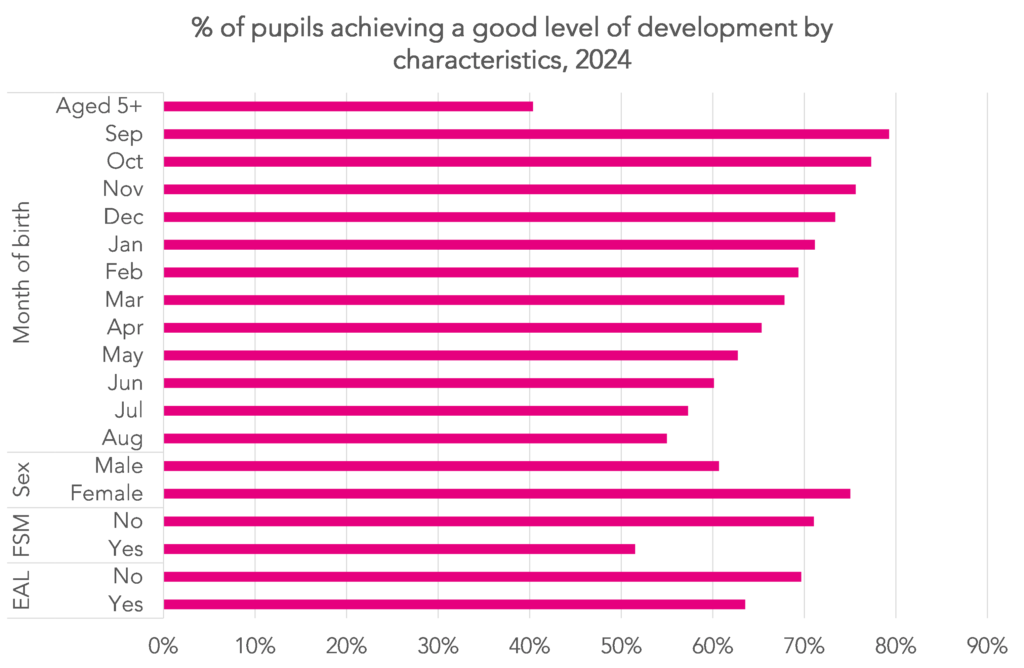
The results are fairly well known. There are large gaps in attainment between those born in August (55%) and those born in September (79%) and between those eligible for free school meals (52%) and those not (71%).
We can expand this further by looking at free school meals and month of birth together.
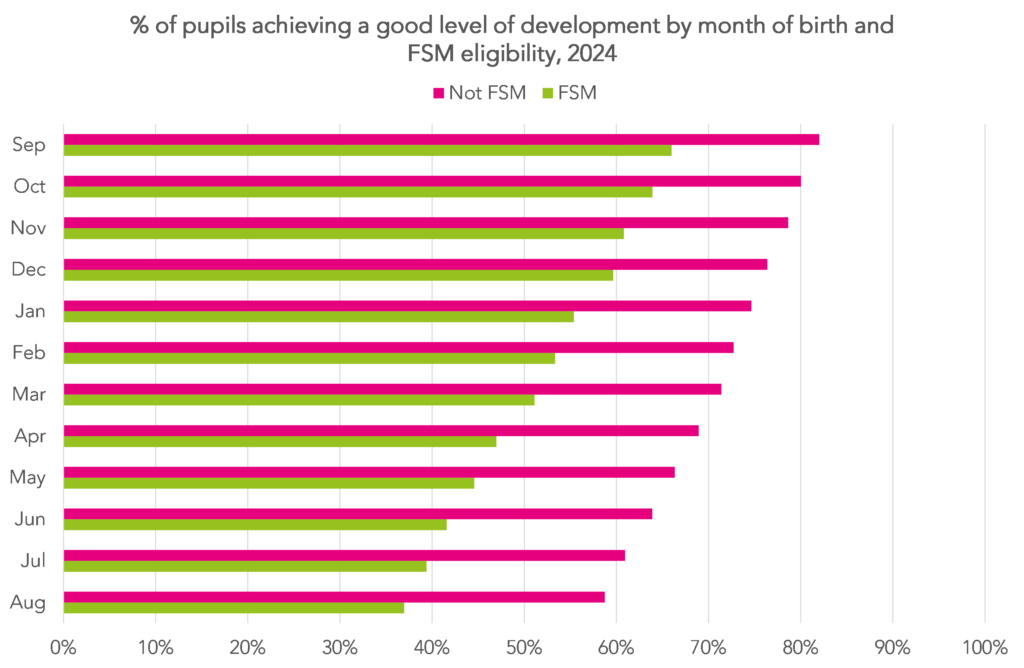
Whereas 37% of FSM pupils born in August achieved GLD, 82% of non-FSM pupils born in September did so.
And we can go further, this time splitting by gender.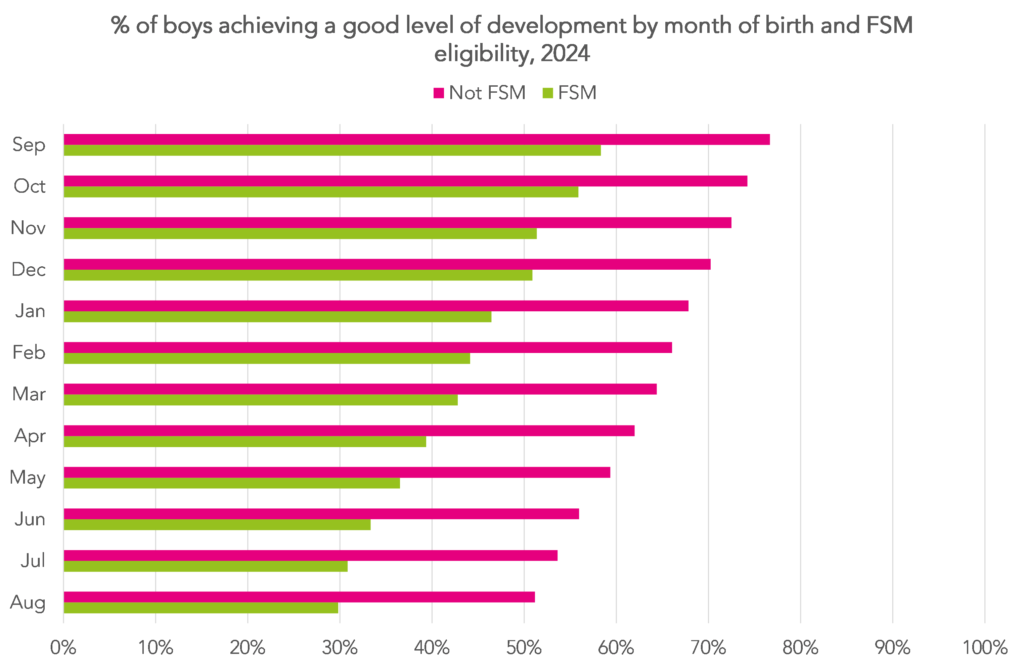
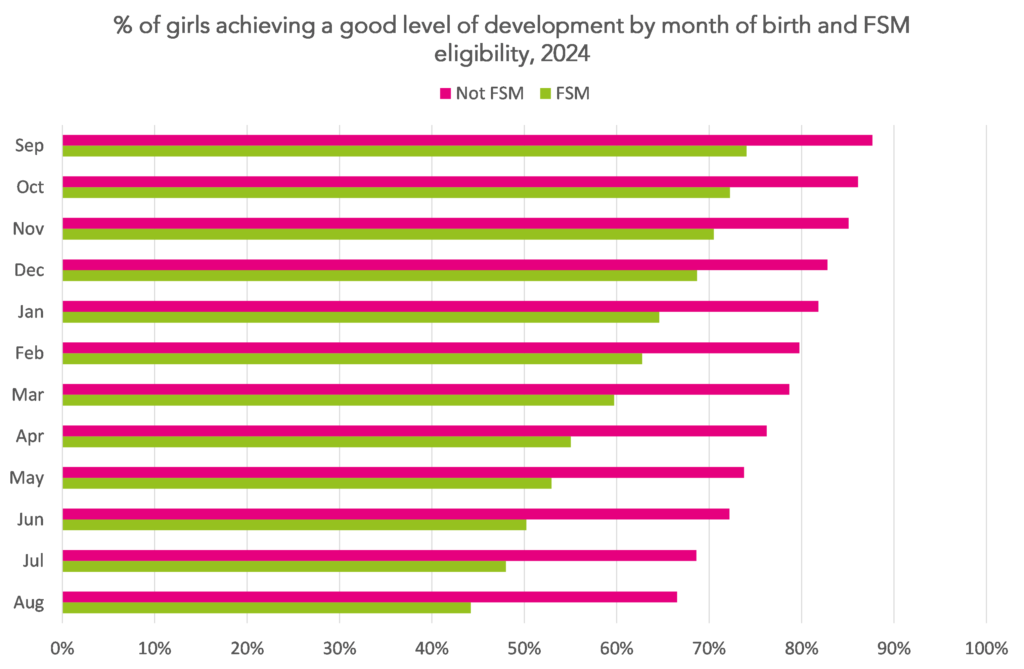
30% of boys eligible for FSM born in August achieved GLD compared to 88% of non-FSM girls born in September. Almost three times as many.
A simple way of taking context into account is to calculate the probability of a pupil achieving GLD given their characteristics. We could even use the values from the previous two charts to do this.
In practice, we do something slightly more complicated and add additional factors (IDACI, ethnicity, first language) and define the probabilities using regression.
For each school each year we calculate:
- The actual percentage of pupils who achieved the GLD
- The average probability of pupils achieving GLD
- The difference between the two
This is conceptually similar to contextual value added but without any measure of prior attainment. Although DfE could add reception baseline scores if they were minded to do so.
We call the average probability of pupils achieving GLD an “expected” score although this has more of a statistical than real world meaning.
But we could use these expected scores for each school to create sets of similar schools.
Let’s say a school’s expected GLD rate was 75%. In effect this is what the national average would look like if the national population of pupils had the same characteristics as the pupils at the school.
The school’s actual GLD rate could be compared with the 20 (or however many) schools with the most similar expected GLD rates (i.e. around 75%).
Summing up
Comparing a school’s performance to similar schools is a way of implicitly recognizing the effects of context without “reinforcing the soft bigotry of low expectations” for some groups, a criticism levelled at explicit methods such as contextual value added.
It takes account of the fact that schools that serve disadvantaged communities will tend to achieve lower results.
At EYFS it is critical that any analysis that government provides to schools takes account of the age of pupils in each cohort. Over 40% of primary schools had fewer than 30 pupils in Reception in 2024. This means that results can be variable from one year to the next, particularly if the age profile of the intake changes from predominantly Autumn born to Summer born (or vice versa).
- It is unclear whether private and voluntary settings will be included
- There will be some under-recording of this due to universal infant free school meals
Want to stay up-to-date with the latest research from FFT Education Datalab? Sign up to Datalab’s mailing list to get notifications about new blogposts, or to receive the team’s half-termly newsletter.


Please can the first line on the graph be explained to me? It seems to state only 40% of children aged 5+ achieved GLD, but this is incorrect. I think I must be reading it wrong somehow! Thank you
Hi Amy. No, sounds like you’re reading it correctly. That’s a group of pupils with a high prevalence of SEN.