The start of this term has seen a renewed push from the Government on reducing pupil absence. The education secretary was in the news stressing the importance of good attendance at the start of the year (though we think it’s not any more important than good attendance at any other time), schools were given attendance data for prospective pupils before they joined for the first time, and this week the DfE announced the introduction of minimum attendance targets for schools.
Now, with half a term of data under our belts, let’s see whether there are any early signs of improvement.
Data
As usual, we’ll be using attendance marks from around 10,000 schools subscribed to FFT Attendance Tracker, looking at the period up to and including Friday 24th October. We’ll also calculate some headline figures for last academic year, again using data from our Attendance Tracker schools, and compare with previous years using DfE official statistics.
The 2024/25 academic year
The last time we wrote an absence update, covering Autumn and Spring terms last year, we saw a small reduction in absence and persistent absence compared with the previous year. Now, let’s complete the picture by including Summer term. Below, we plot the percentage of sessions missed due to absence, and the percentage of pupils persistently and severely absent (missing 10% and 50% of sessions, respectively).
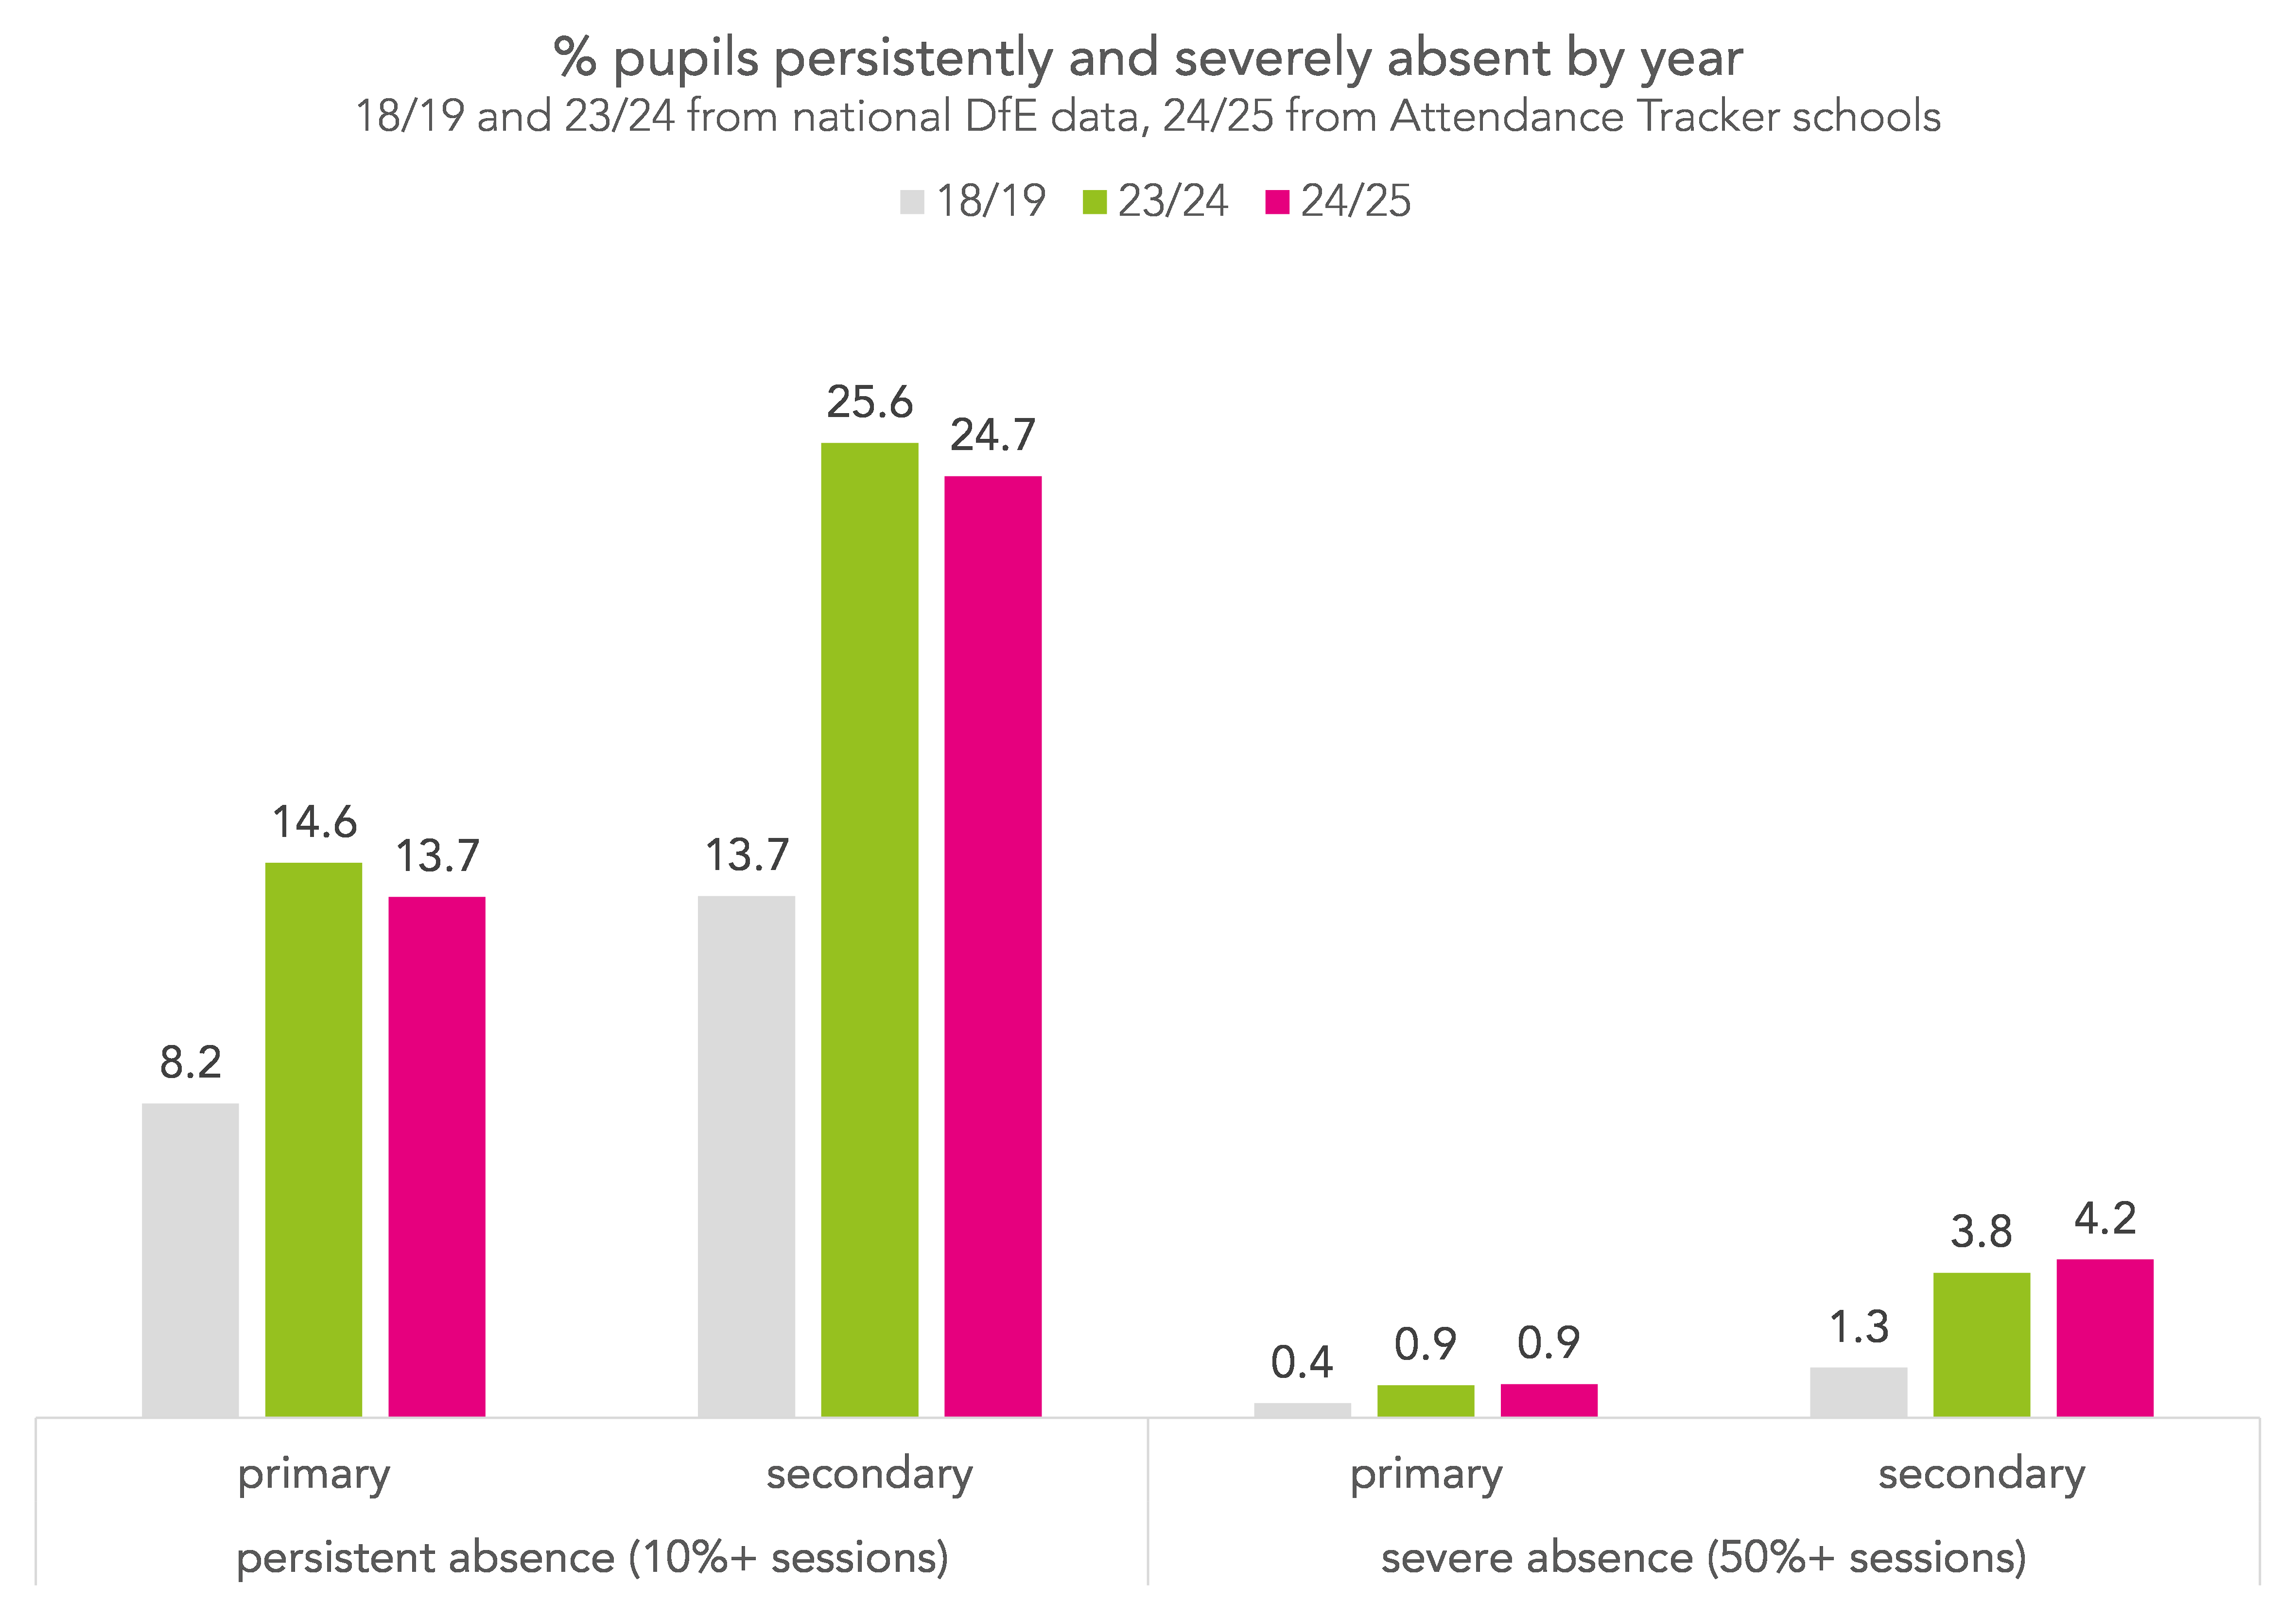
At both primary and secondary, the picture remains the same as in Autumn and Spring – a small improvement in both the percentage of sessions missed and the percentage of pupils persistently absent, but both rates remain above pre-pandemic levels, particularly at secondary. Rates of severe absence have increased at secondary, and remained static at primary (though we wrote last month that the absolute percentages of pupils severely absent may be overstated).
We provide the same information by year group, below.
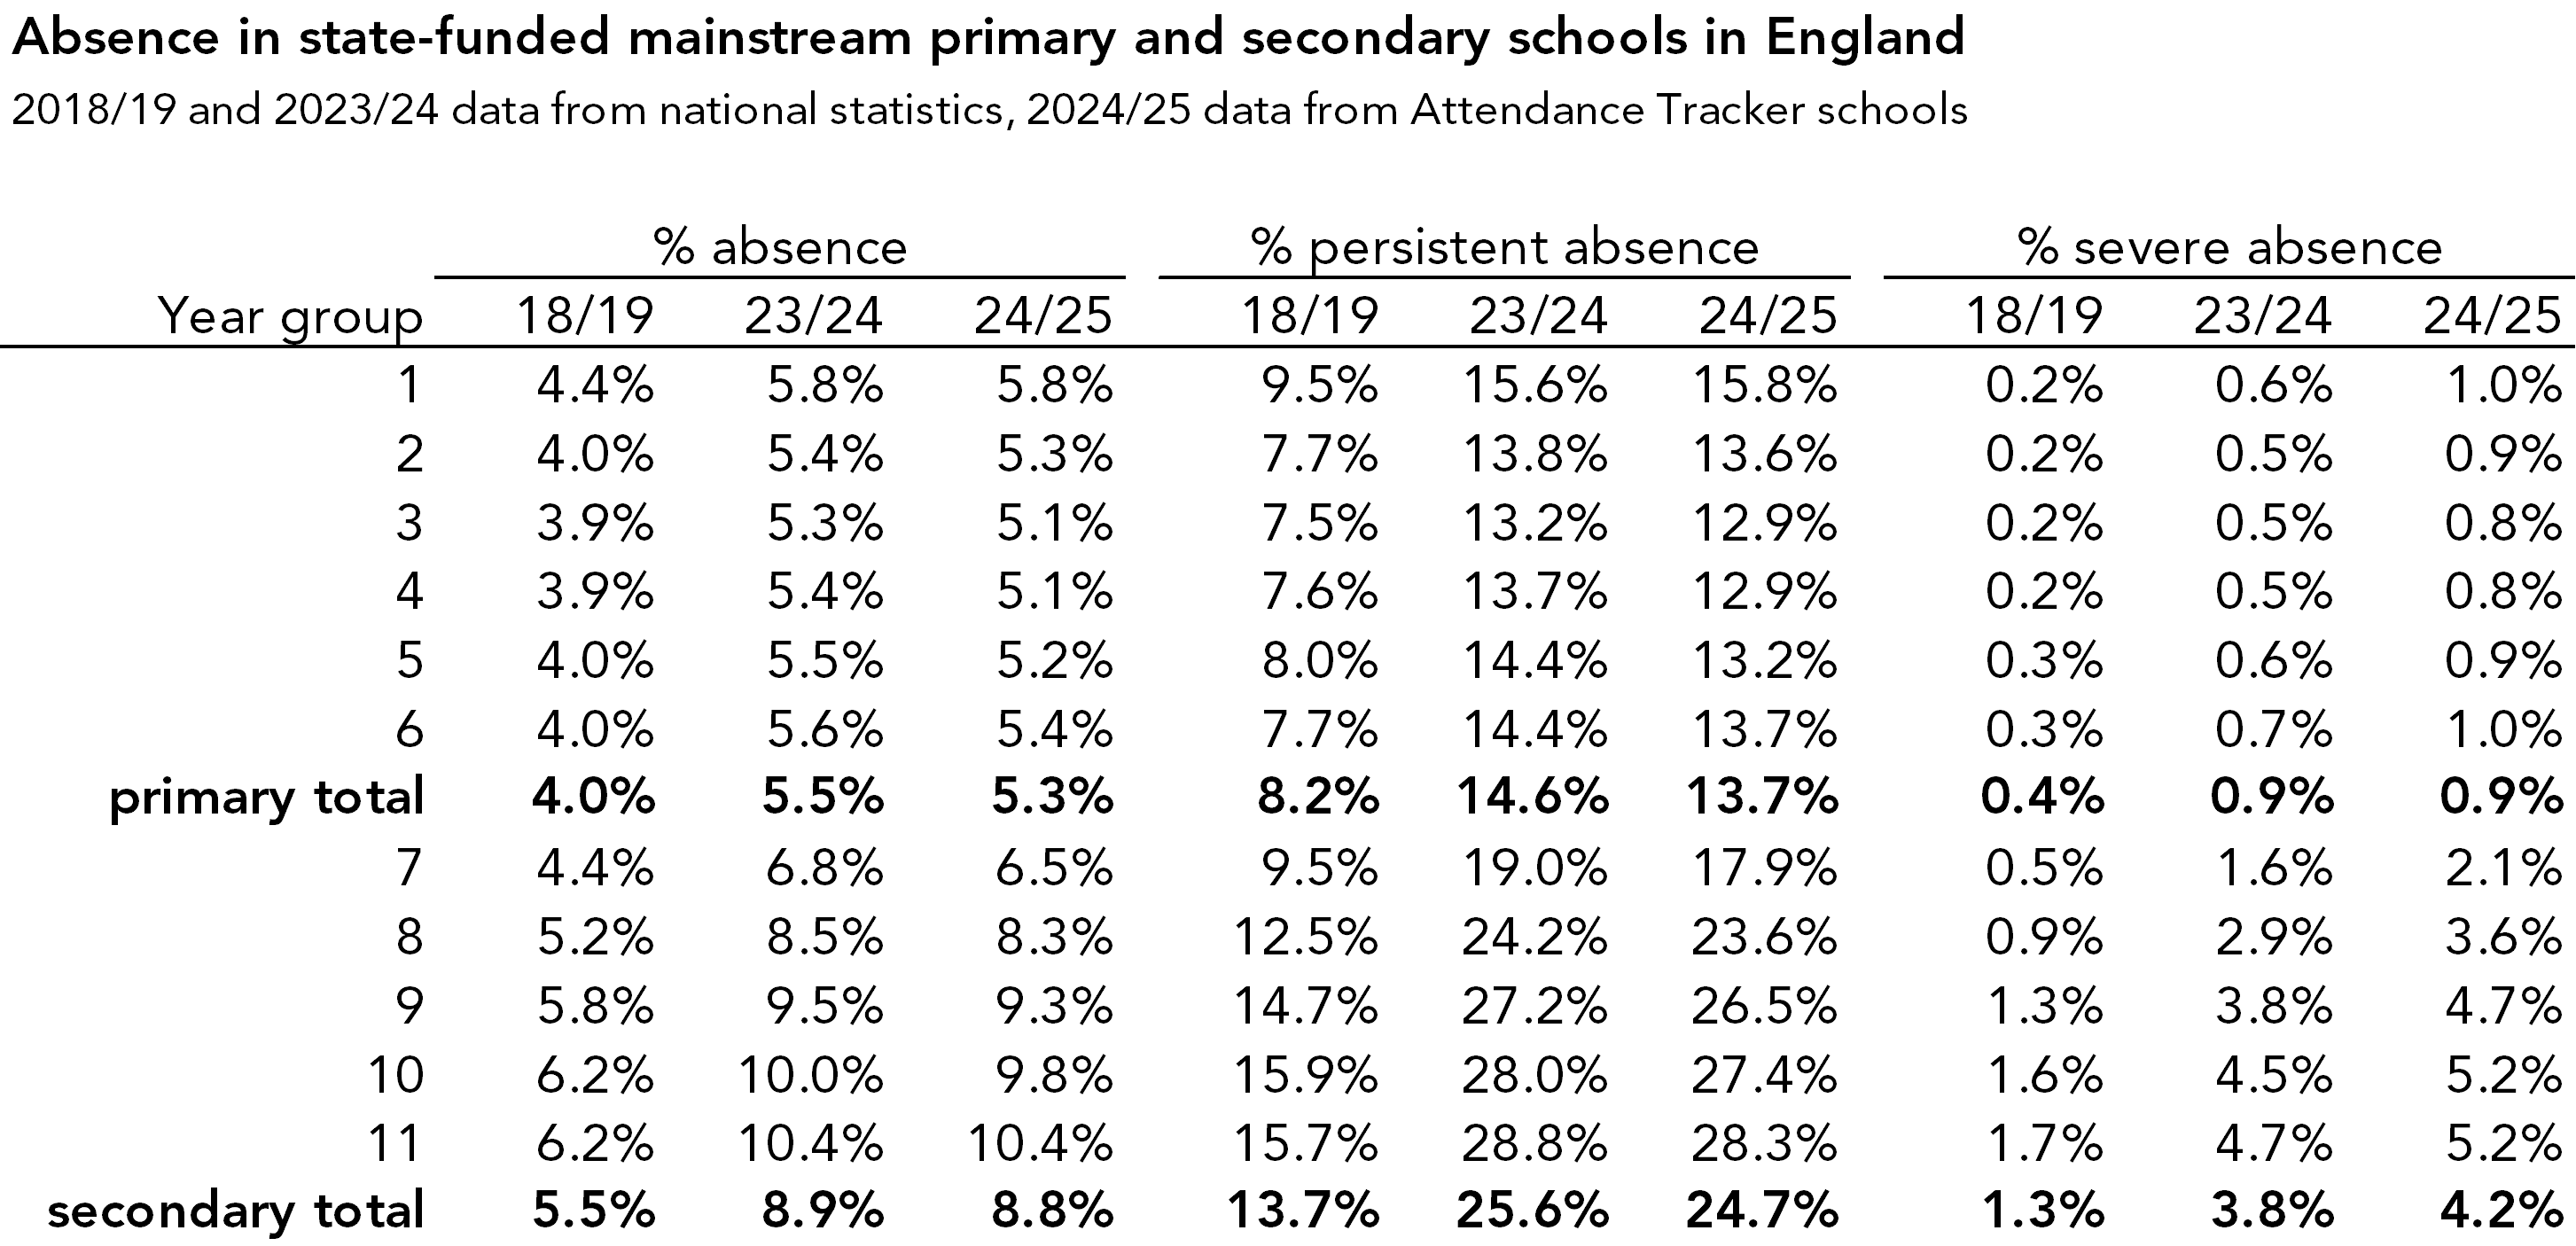
Improvements in absence and persistent absence in all year groups are small (aside from Year 1, where we think rates may have nudged up). At primary, improvements are slightly bigger among older pupils than younger, while at secondary, the reverse is true. For severe absence, increases appear to be larger among younger pupils than older at both primary and secondary, though as with all figures involving small changes in small numbers, we’d caution against over-interpreting these patterns.
Weekly absence so far this year
Moving on to this year. Below we plot the percentage of sessions missed by pupils each week, and compare with the same week last year.
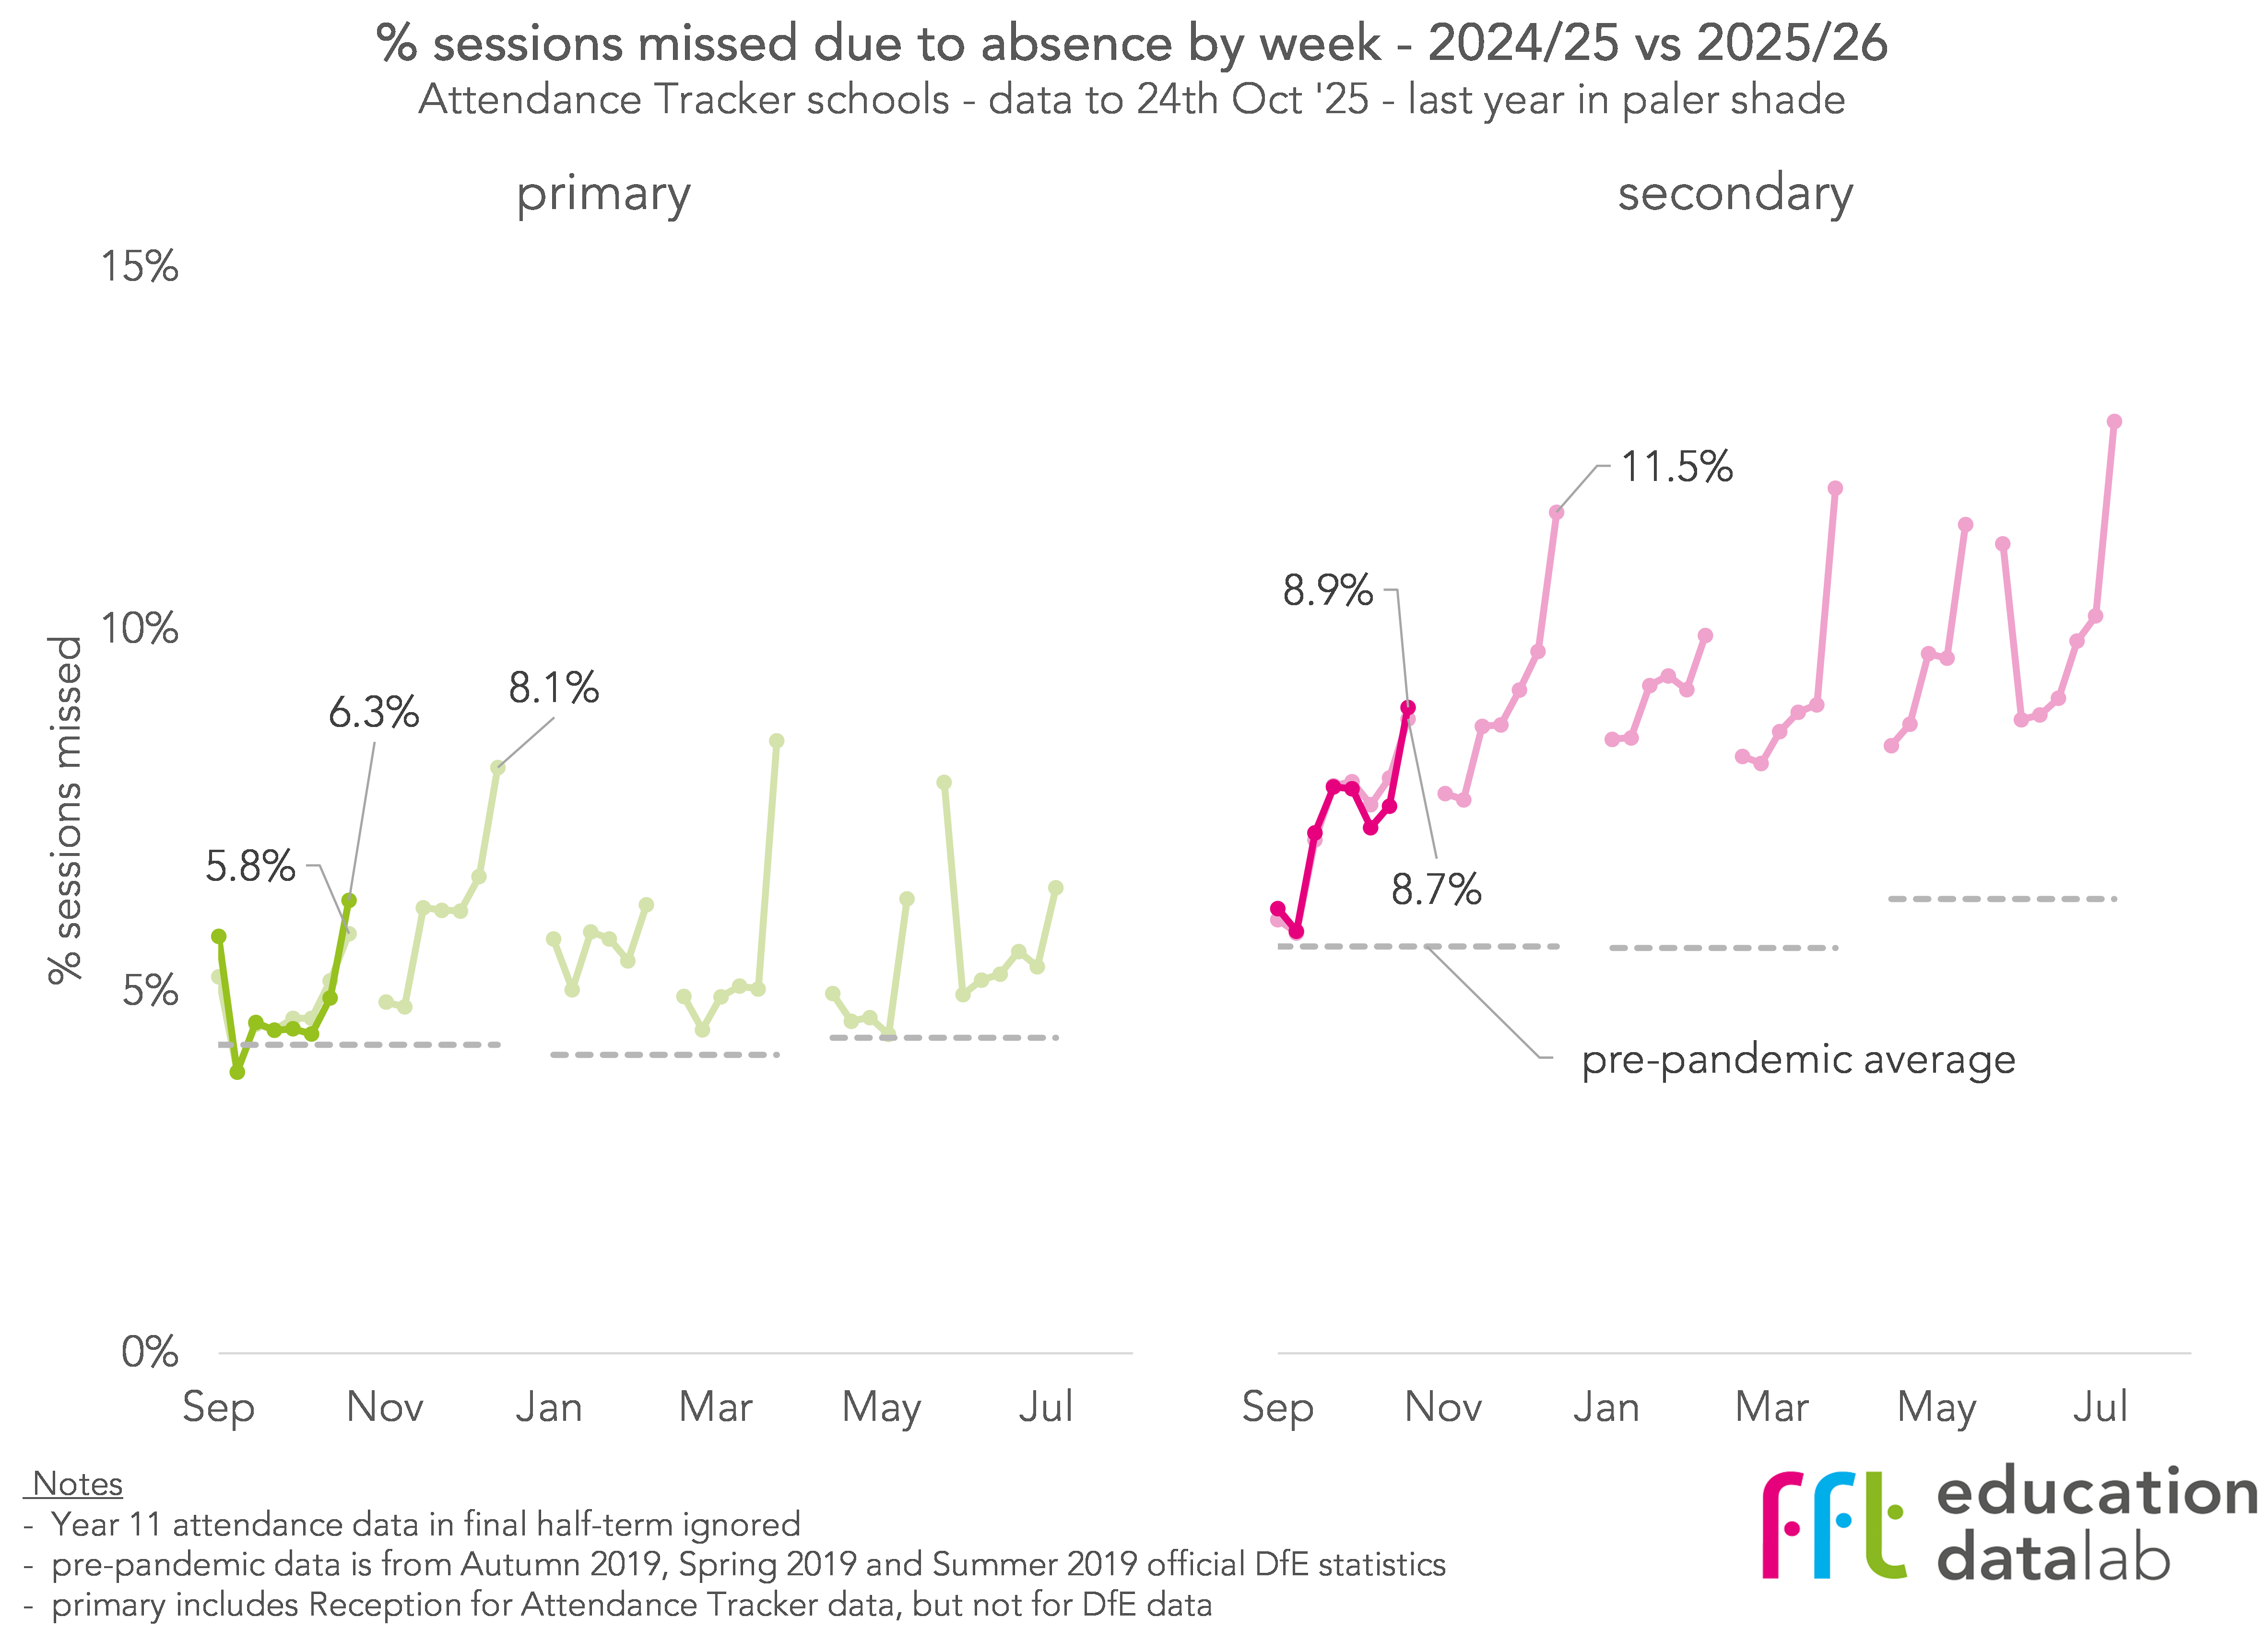
We see an almost identical pattern to last year at both primary and secondary. Absence at primary was high in the first week of term, before falling and levelling off, then increasing again in the lead-up to the half-term break. At secondary, absence increased rapidly across September, before falling slightly, followed by a big increase in the week before the break.
If you’re curious about the big peaks just before Easter and after May half-term last year, these are driven by both Eid al-Fitr and Eid al-Adha falling in term-time, and enhanced by the usual uptick in illness and unauthorised absence we tend to see in the weeks immediately before and after school holidays.
The overall percentage of sessions missed at both primary and secondary is the same so far this year as the same period last year: 4.7% at primary and 7.3% at secondary.
Absence by type
Although the overall percentage of sessions missed has remained the same, perhaps there have been changes in the types of absence recorded. Below, we plot the percentage of sessions missed in the first half-term of this year and last, broken down by the reason recorded in schools’ registers. We use three categories: unauthorised, authorised for illness-related reasons, and other authorised absences.
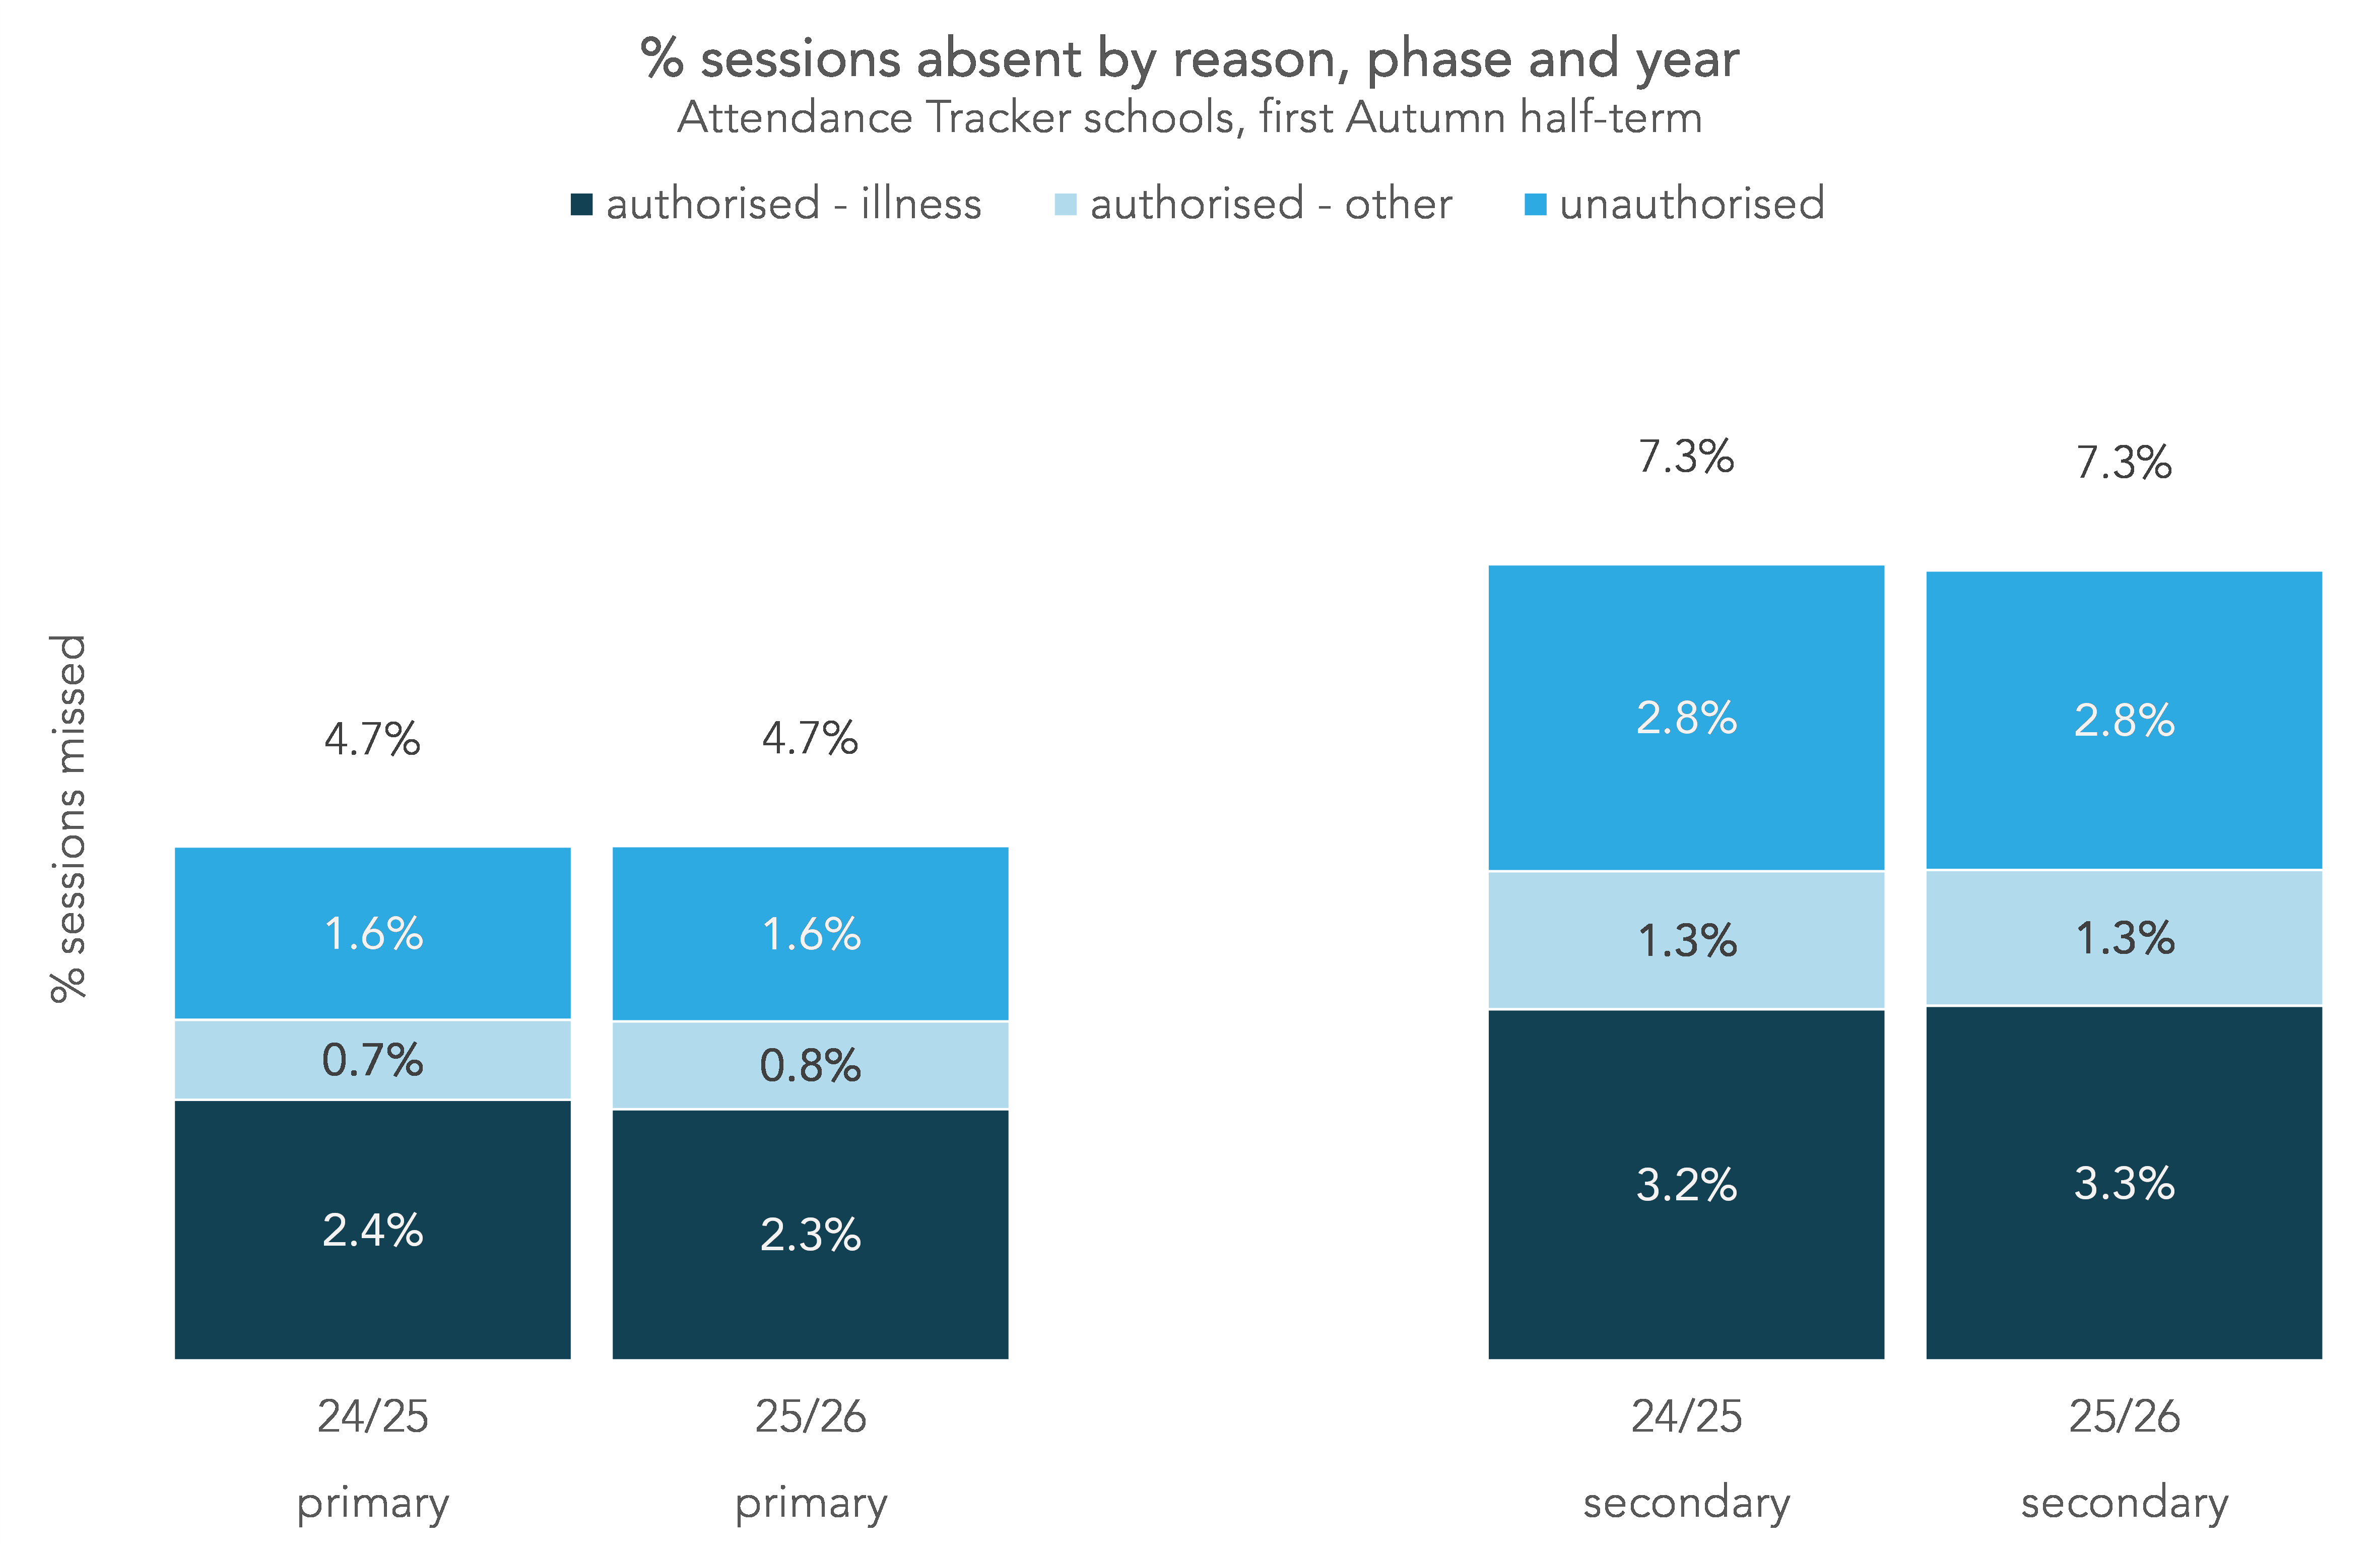
Again, the picture is one of similarity. There’s been a very small reduction in illness-related absence at primary, which has been cancelled out by a small increase in non-illness-related authorised absence, but in both cases the size of the change is less than 0.1 percentage points. There’s also been a similarly sized reduction in unauthorised absence at secondary, though this is lost in the chart to rounding.
With much of the DfE’s focus on attendance being on the transition between primary and secondary, particularly for disadvantaged pupils, we create a second version of this chart for Year 7 pupils only, broken down by “FSM6” status (indicating whether a pupil has been eligible for free school meals at any point in the last six(ish) years).
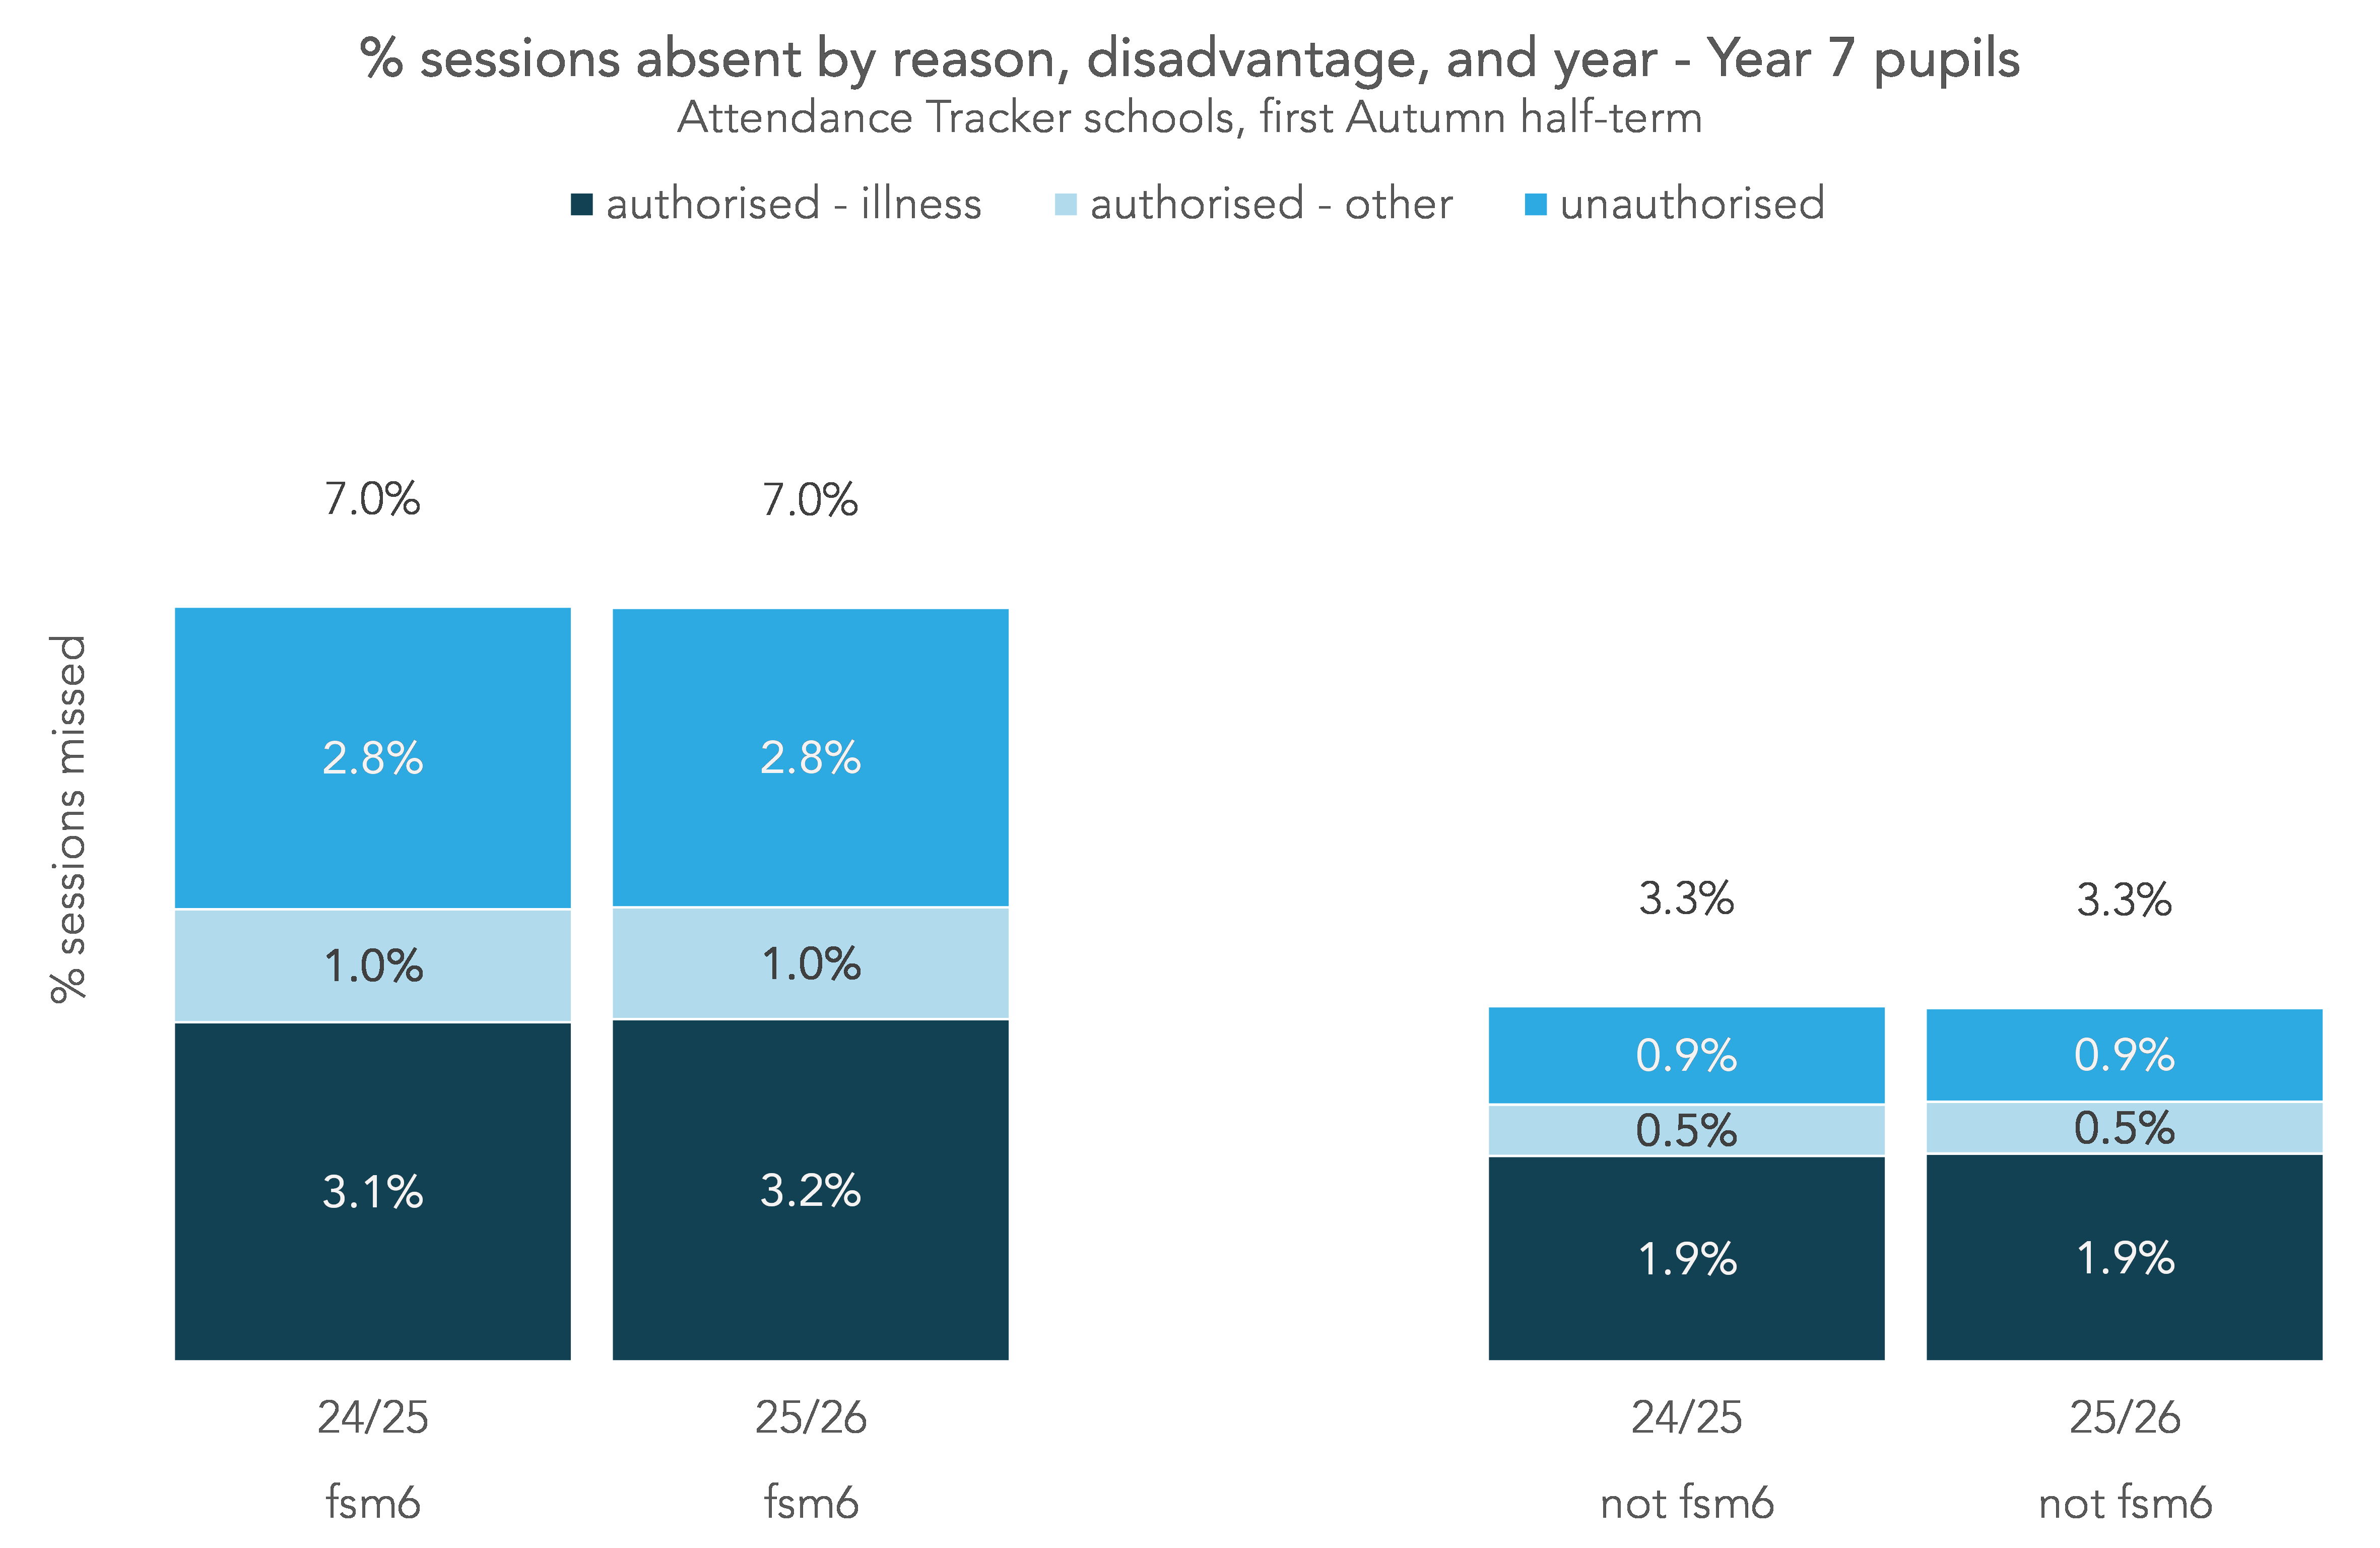
There doesn’t appear to have been any change in absence overall, or by type. Disadvantaged Year 7 pupils remain around twice as likely to miss school for any reason as non-disadvantaged Year 7 pupils, and around three times as likely to miss school for unauthorised reasons.
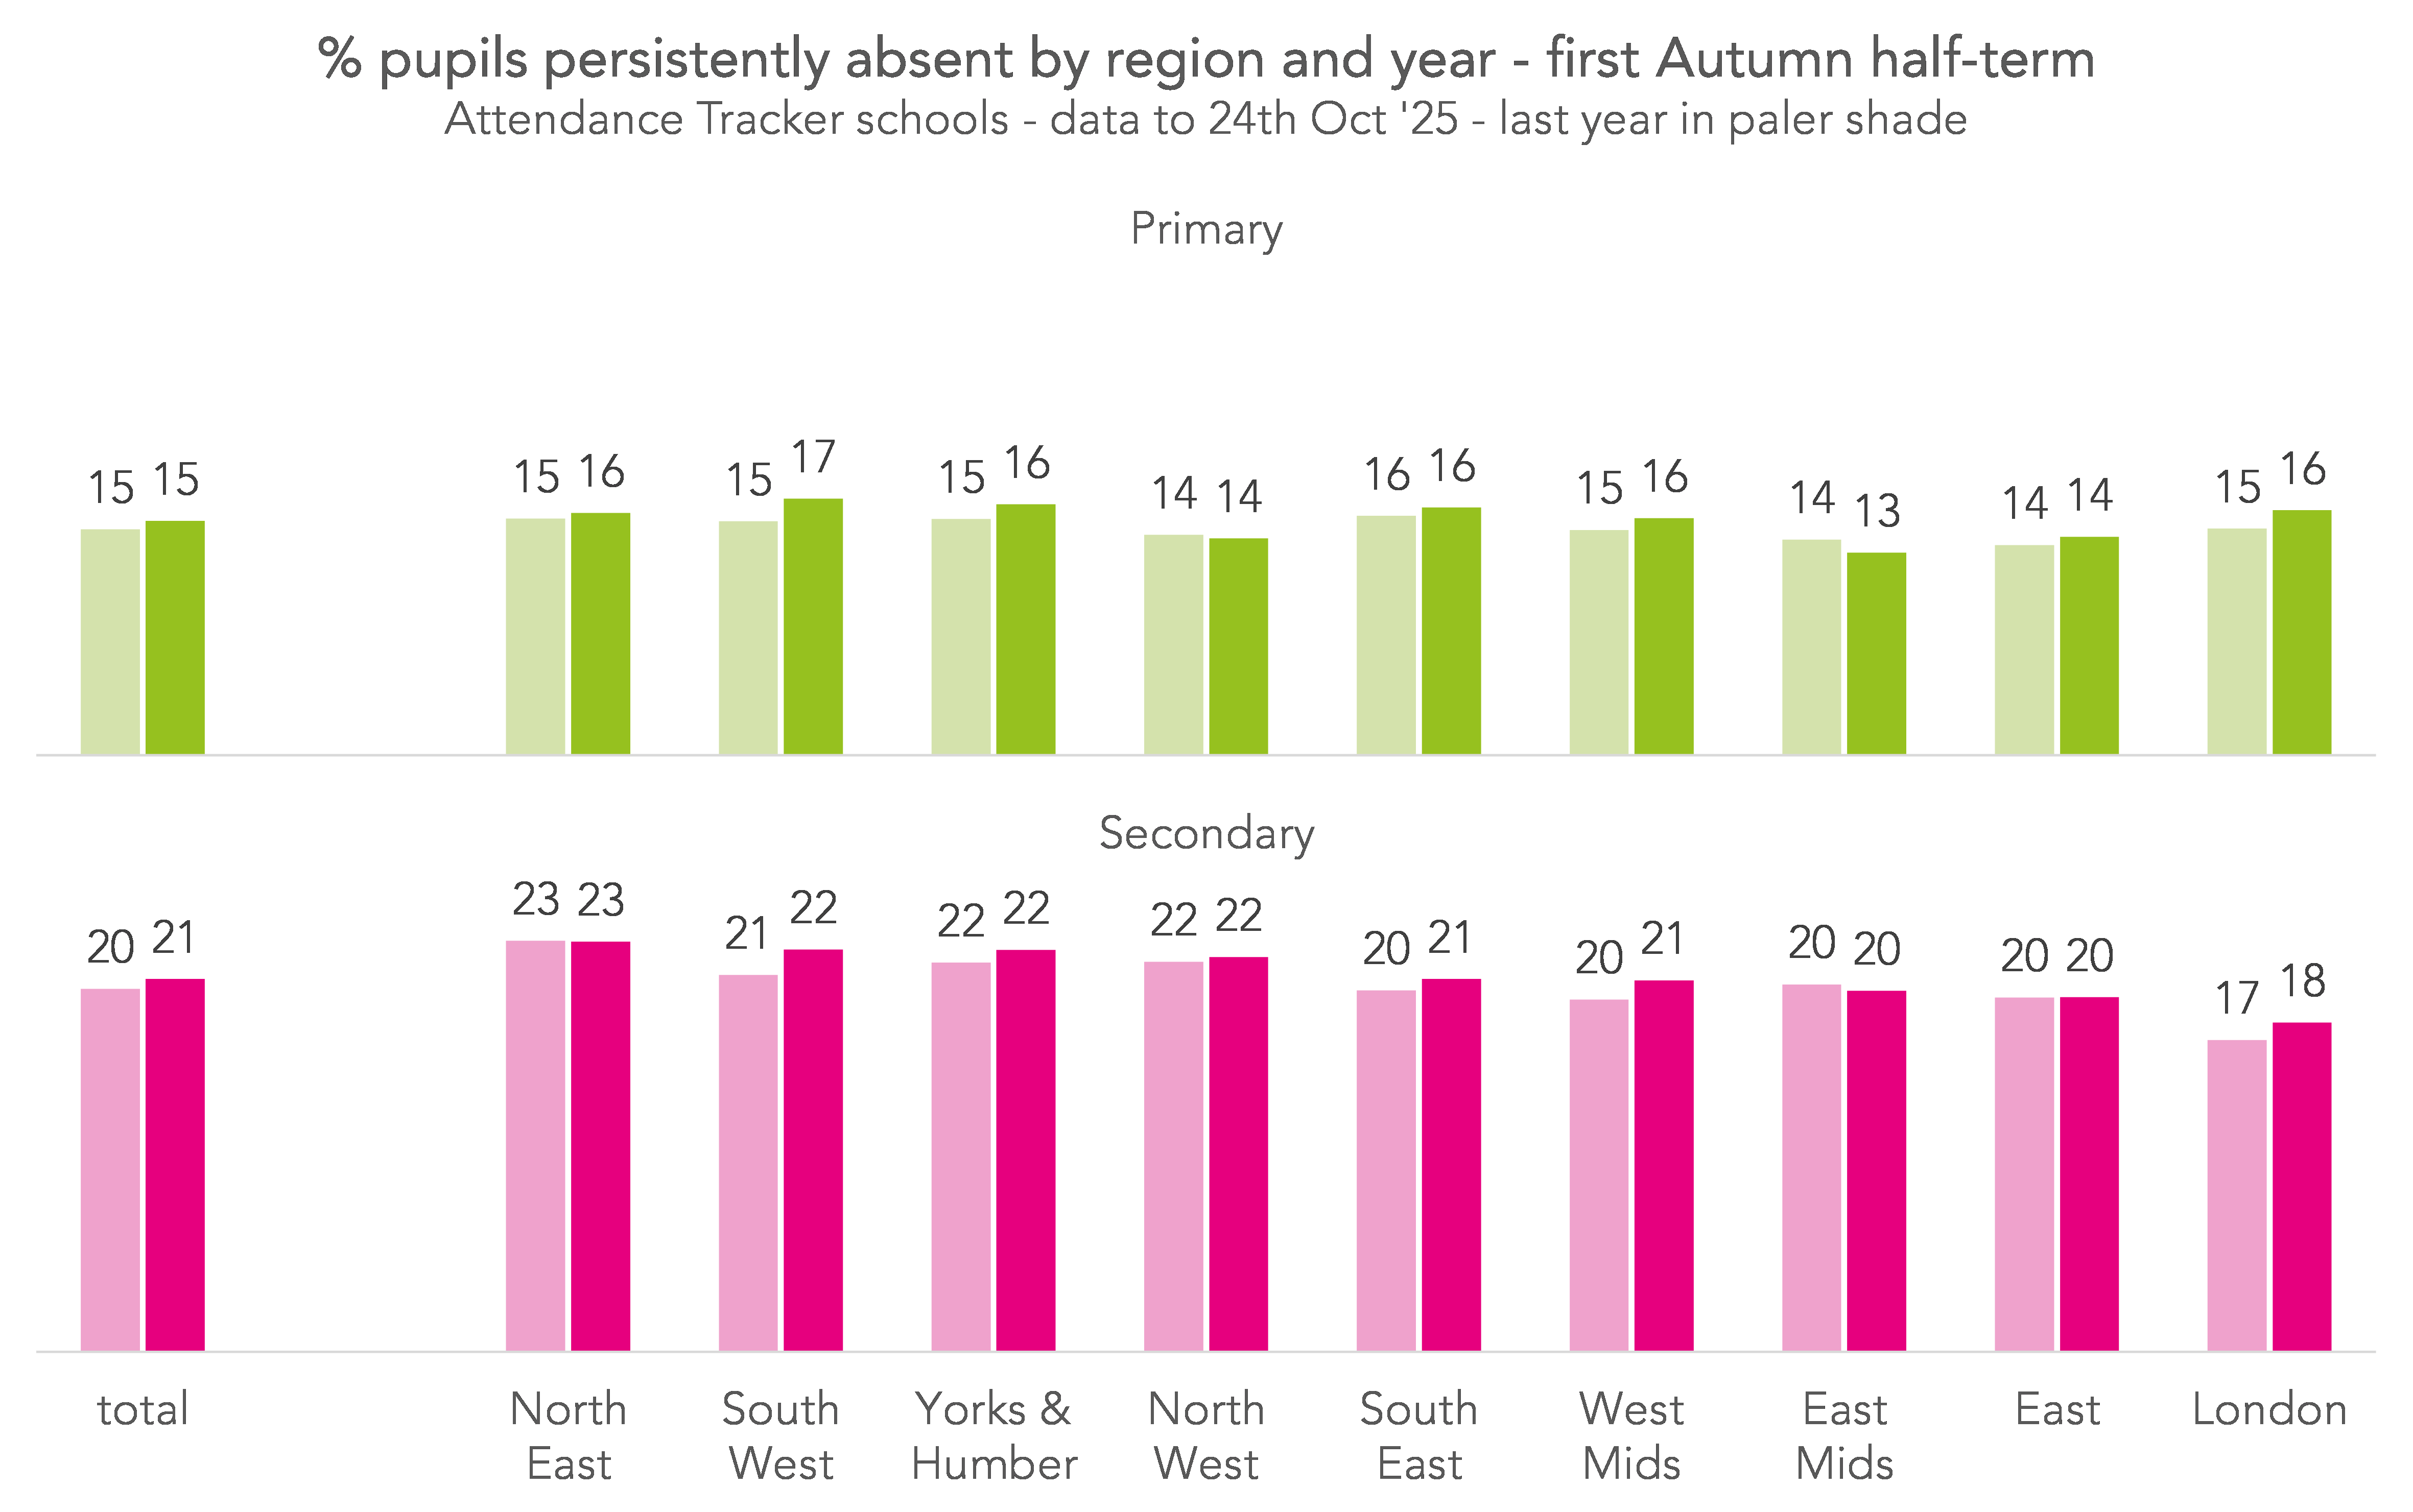
Persistent absence
It’s too early to draw any conclusions about persistent absence, with four days of absence across the term enough to put pupils in this category. We therefore calculate the figures for completeness only. We’ll have a better idea of what’s actually happening at the end of the term, when we’ve got more data.
Summing up
Overall then there’s been no change in absence levels so far this year compared with last. All types of absence remain stubbornly high above pre-pandemic levels, particularly unauthorised absence at secondary.
Perhaps somewhat concerningly, given the DfE’s focus on narrowing the disadvantage gap at the transition between Year 6 and 7, there doesn’t seem to have been any improvement here either.
That’s not to say that the various initiatives to tackle absence haven’t worked. It’s just that we can’t see any evidence of them having worked yet.


Leave A Comment