Last year we ran a research project with around 1,000 secondary schools where we provided them with comparisons of their Year 11 pupils’ predicted grades against those of pupils in other schools. In a report published last week, available in the special reports area of Aspire for participating schools, we also compared predicted grades with those actually achieved.
While this has provided useful insights for these schools, we thought the dataset might also be of interest more widely. Specifically, to explore how closely teachers’ predicted grades matched their pupils’ actual outcomes.
Data
In total, 740 of our participating schools submitted both predicted grades and results. We use the “final” predicted grades submitted to FFT for the research project during the May/June collection window (submitted as whole grades[1]). And the results submitted to the FFT Early Results service on or shortly after results day in August.
Overall, our dataset contains around 1 million predicted-actual grade pairs for 140 thousand pupils.
A few caveats
There are three big caveats to mention before we get to some findings. The first is that different schools will have arrived at their predictions in different ways. Each school will have its own assessment policy, containing, for example, the evidence requirements and moderation processes which should be used when making predictions. Some schools may choose to report predicted grades home, others may use them for internal purposes only. In some cases, these things may even differ between subjects within schools.
The second caveat is that, while all of these “final” predicted grades were collected by FFT at the same time, different schools will have collected them from teachers at different times. For some schools, these predicted grades may well have been the last ones made before exams, but others may have collected grades afterwards. Again, these things may differ between subjects in the same school.
And the third is about the concept of “accuracy”. We know that exam results are not a perfect measure of attainment (pdf), and that marking in some subjects is inherently more reliable[2] than others. It’s quite possible that a teacher correctly predicts that their pupil will produce exam scripts at a grade 4, but that the pupil instead receives a 3 or a 5. The prediction was accurate, yet the predicted and actual grades differ.
For these reasons, we don’t claim to be able to definitively answer a question like “how accurately can teachers predict attainment?” Instead, we’ll explore the more limited question “to what extent do the predicted grades made by teachers match their pupils’ results?”, keeping the above caveats in mind.
Differences by subject
Let’s start by looking at how average predicted and actual grades compare in each subject.
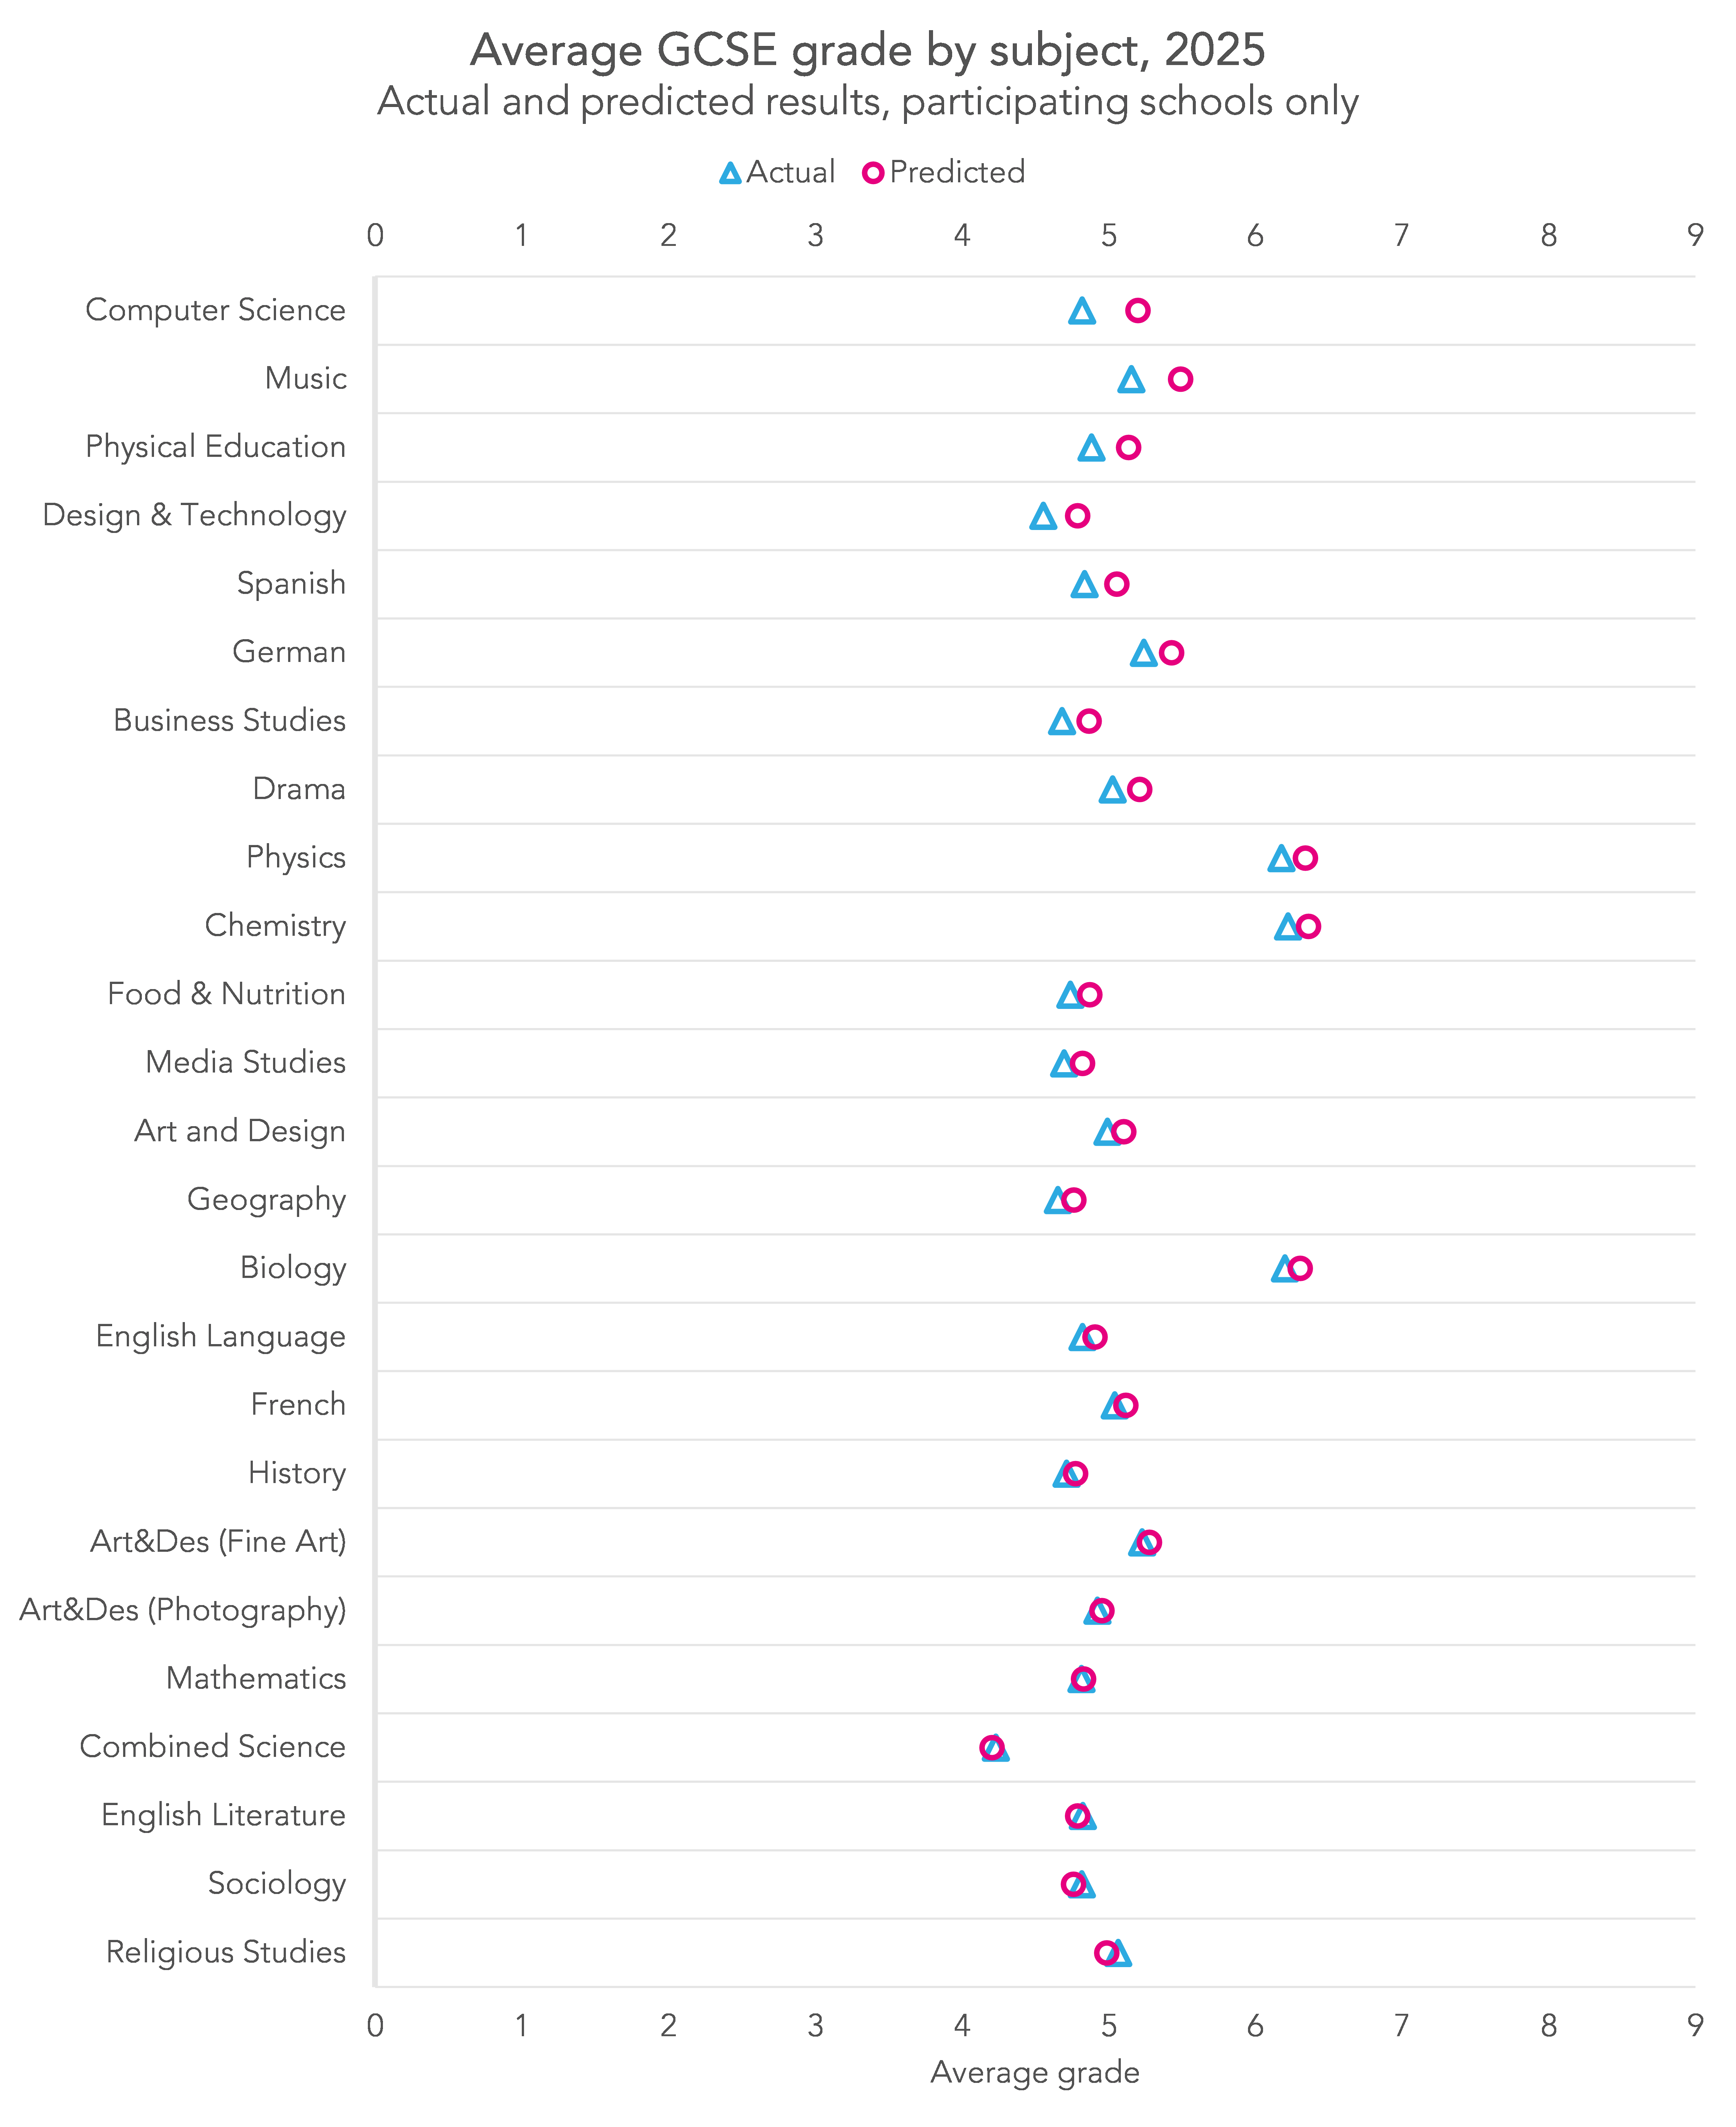
Overall, the two sets of grades were quite close in every subject. Where there were differences, it was almost always the case that predictions were slightly higher than results (religious studies, sociology, combined science, and English literature were the exceptions, with predictions slightly lower than results).
Computer science was the subject with the biggest difference in average grade, with predictions 0.4 grades higher than results, on average. There were four subjects where the difference in average grade between predictions and results rounds to zero (to 1d.p): maths, combined science, photography, and English literature.
In English language, the difference was 0.1 grades, with predictions slightly higher than results.
Below, we show the full grade distribution for each subject.
For most subjects, it is largely a picture of similarity rather than difference. Where there is difference, this mostly occurs around the 3/4 borderline: across all subjects, 78% of predicted grades were at grade 4 or above vs 74% of results. 25% of both predicted and actual grades were at grade 7 or above, for comparison.
Although, on average, predictions tended to be higher than results, there was one part of the grade distribution where this was not true: at grade 9. Overall, 4.3% of predicted grades were 9s, less than the 5.2% achieved.
Pupil-level
Comparing average grades only gets us so far. It’s possible (in principle) for the average difference between predicted grades and results to be zero, but for no pupils to have the same prediction and result (for example, half of pupils achieved a result one grade higher than their prediction, and the other half one grade lower).
So now let’s look at the data at pupil-level. We compare, for each pupil, and each subject, the grade they were predicted with the grade they achieved. Below, we plot the percentage of grades where predictions and results were the same by subject.
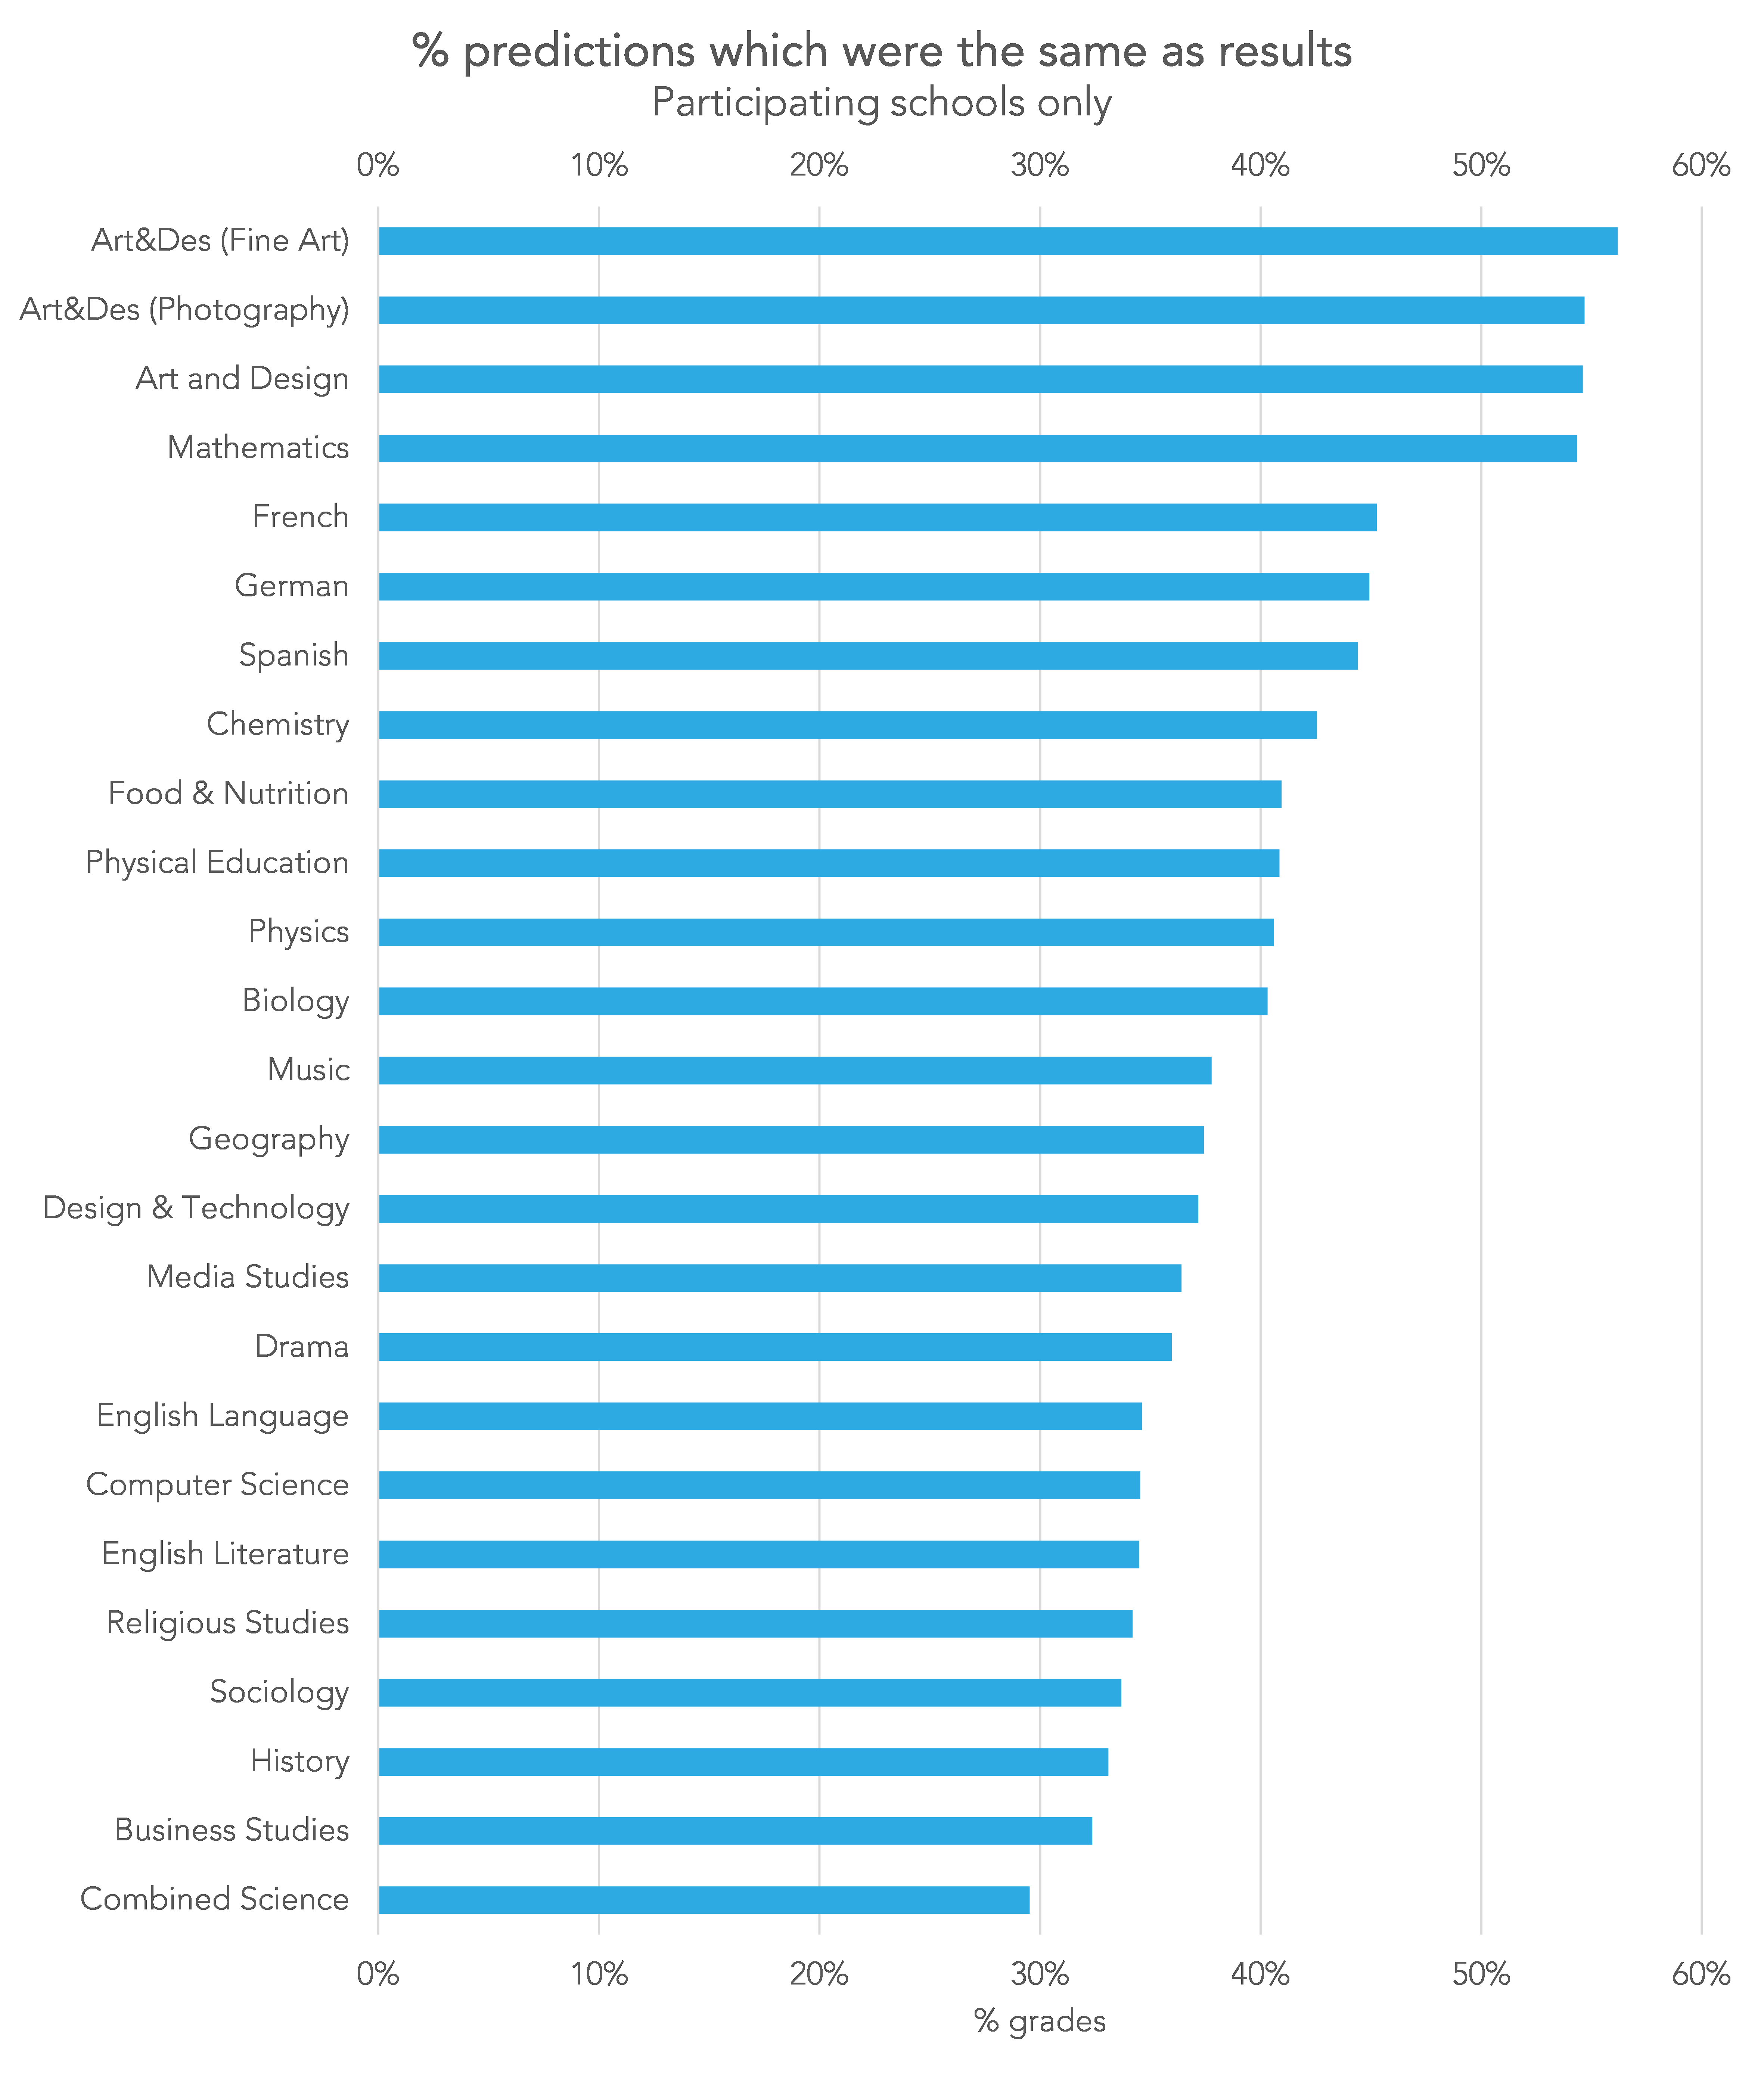
English literature, despite having almost no difference between average predicted grades and results has one of the lowest percentages of predictions matching results, 34%. In contrast, maths, which also had virtually no difference between average predicted grades and results, has one of the highest percentages, at %.
Maths and the three art and design subjects are the only ones where more than 50% of predictions matched results. There’s then a gap of around 10 percentage points to the languages, French, German and Spanish, which are the subjects with the next highest rates.
Combined science has the lowest percentage of predictions which matched results, around 30%, though it’s not really a fair comparison, as there are more possible grades in science.
To finish, we combine aggregate and pupil-level differences in the chart below. We plot the average difference between predicted and actual grades on the vertical axis, and the percentage of predictions which matched results on the horizontal axis.
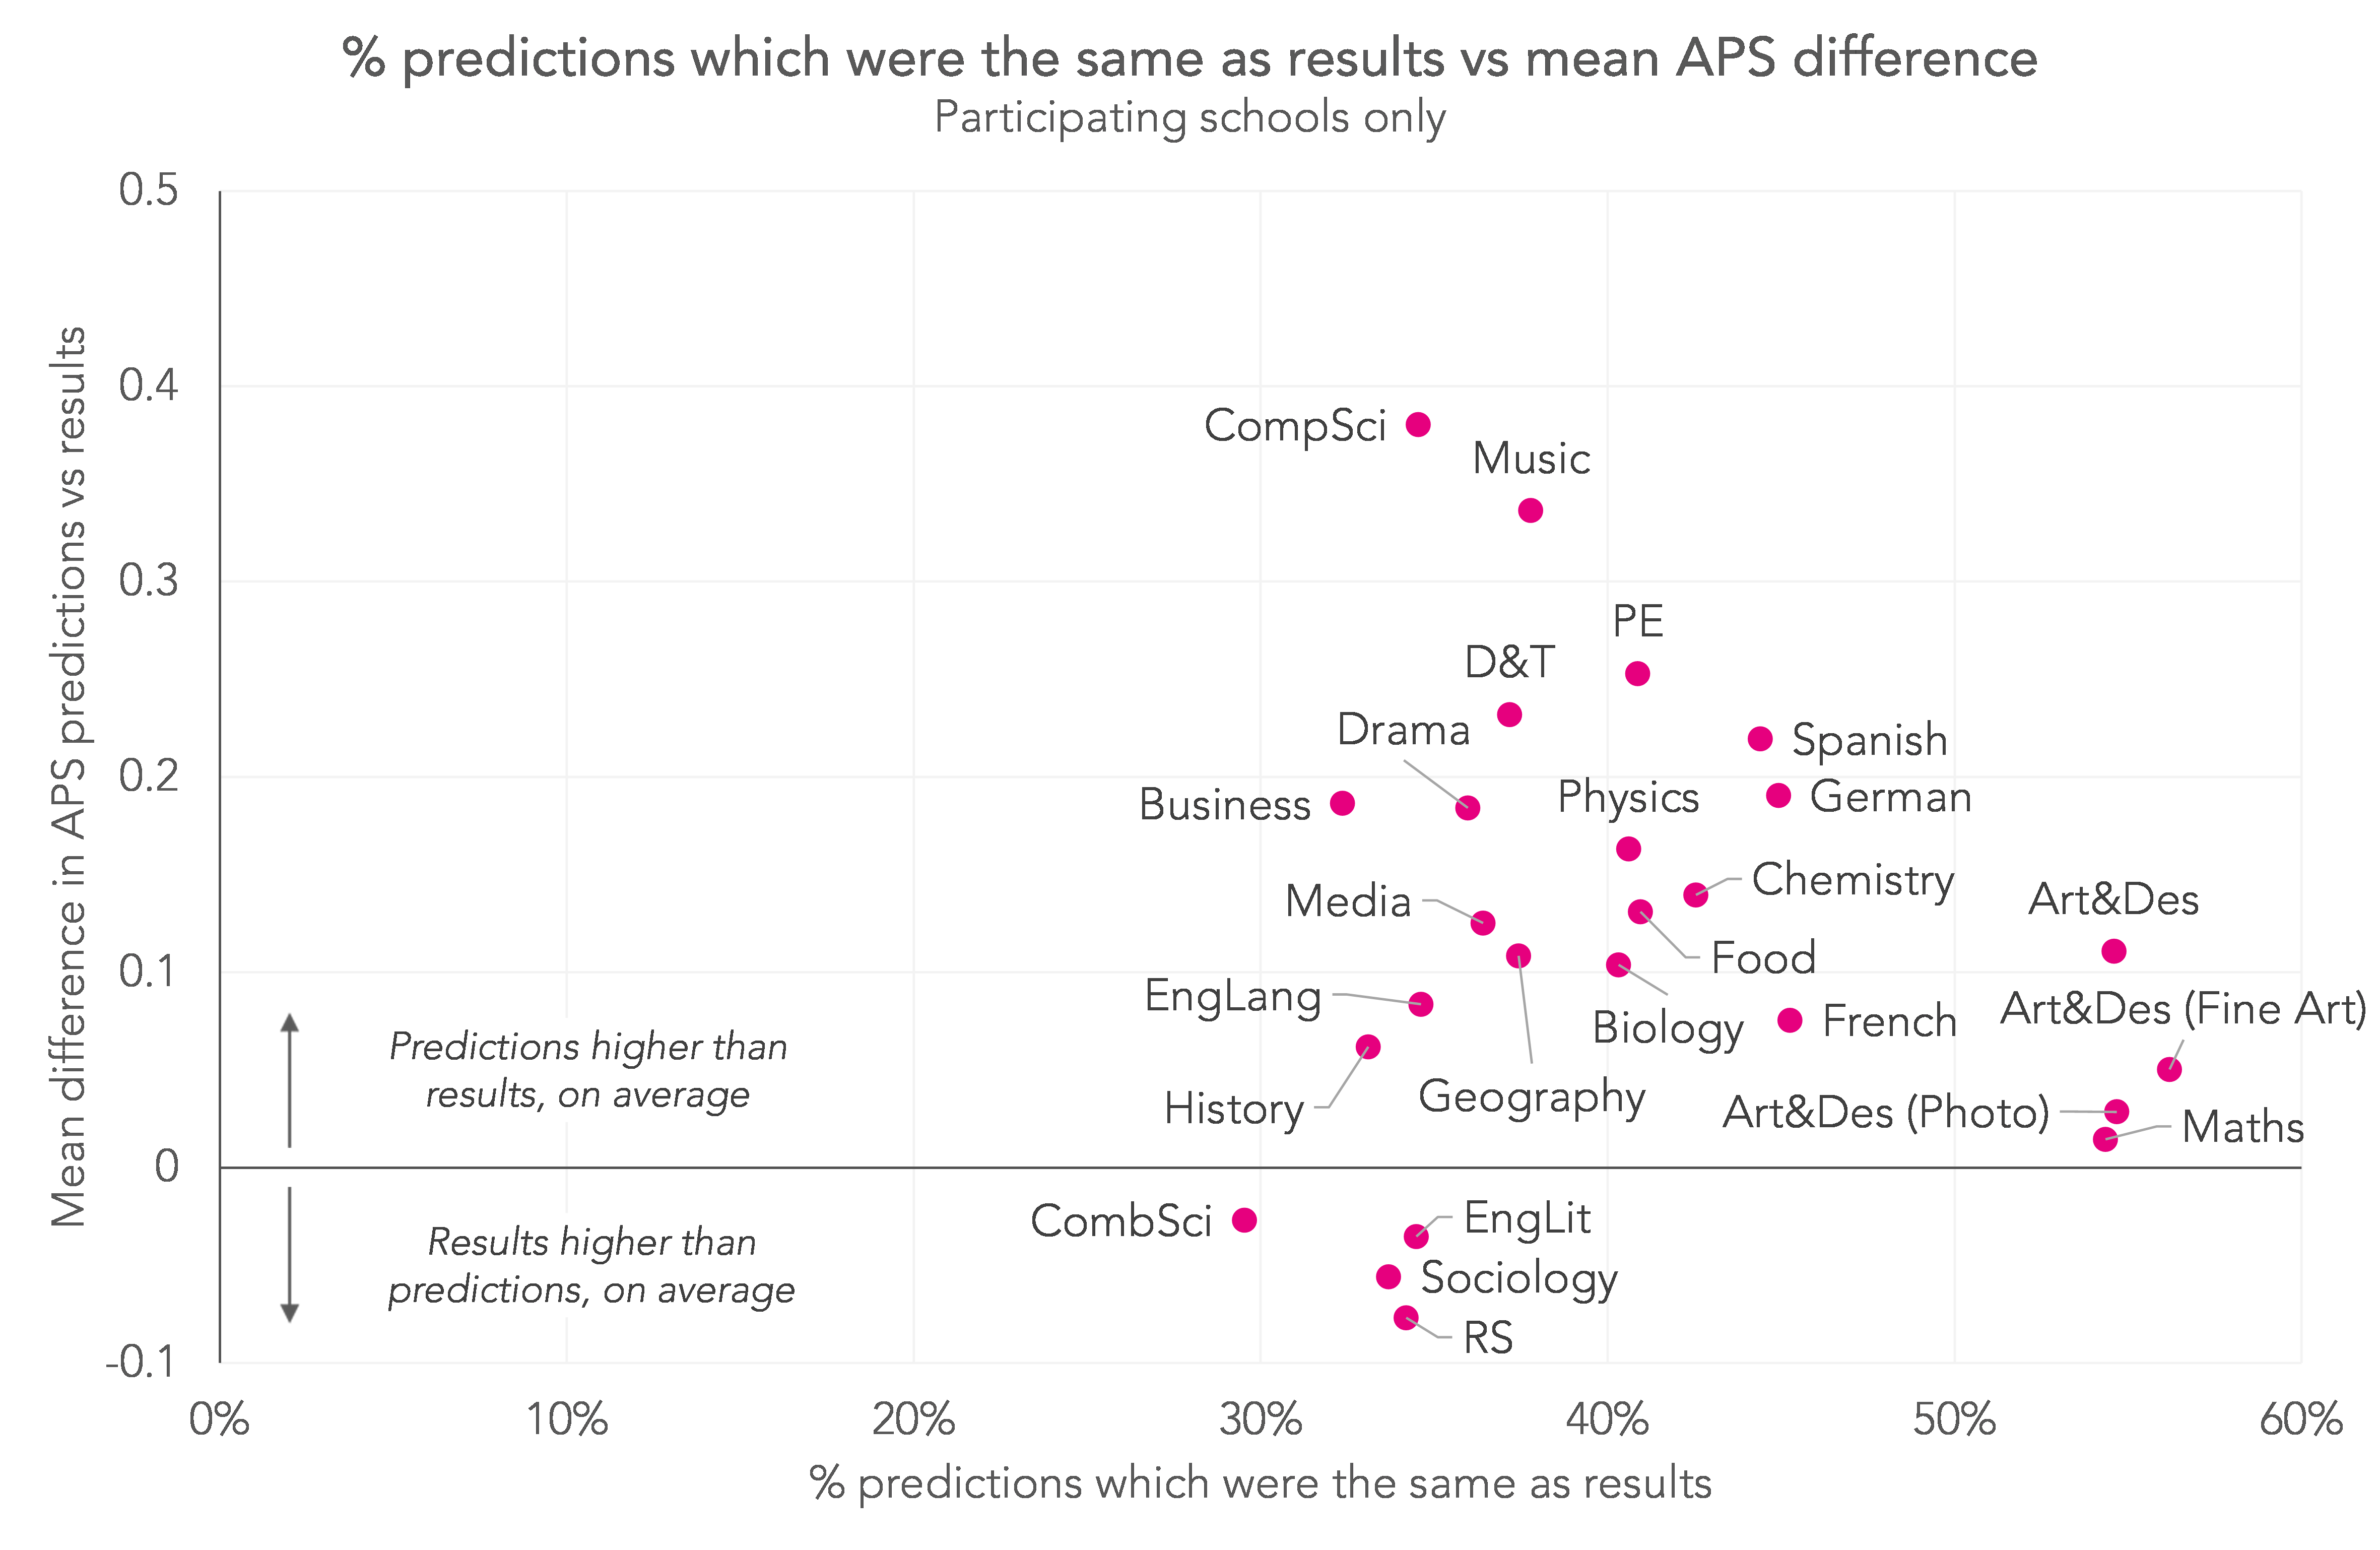
This highlights the difference between subjects that appear similar based on one measure but different on the other. For example, photography, maths, English literature and combined science all have an average grade difference very close to zero, but the percentage of predictions matching results is much higher in photography and maths than in combined science or English literature. Similarly, computer science and religious studies have similar proportions of predictions matching results, but not of differences in average grades.
Summing up
Overall, most subjects are quite similar to each other in terms of average predicted grades vs results, with almost all subjects seeing differences of a quarter of a grade or less.
There is more variation between subjects, however, when looking at the percentage of predictions which matched results. In all but four subjects, the majority of predictions were different from results, that is, predictions matched results for fewer than 50% of pupils.
Together, this implies that, nationally at least, predicted grades tend to match results quite closely at the cohort-level, but not at the pupil-level.
Participating schools can see whether these findings hold for their own school by accessing their special report in Aspire now.
Want to stay up-to-date with the latest research from FFT Education Datalab? Sign up to Datalab’s mailing list to get notifications about new blogposts, or to receive the team’s half-termly newsletter.
[1] Some schools collect predicted grades in more granular detail. For example, they may want to distinguish between a pupil who they feel is most likely to get a 4 but could get a 5, and one who is most likely to get a 4 but is at risk of getting a 3. The former pupil would have a predicted grade of something like “4+” or “4/5”, and the latter “4-“ or “3/4”. For this project, schools were asked to submit whole rather than fine grades, and they were free to decide on how to convert between the two.
[2] If we were able to measure attainment perfectly, with 100% reliability, an exam script would receive the same mark regardless of who marked the paper, what time of day they marked it, how many scripts they’d already marked, etc. This is not the case in reality, and impacts some subjects (e.g. English) more than others (e.g. maths).


Love this. I think we could do with error bars on the first graph to show the extent of the variation. It’s no surprise that the results collate around the result but how big is the variation subject to subject?
Interesting bug on the subject by subject analysis graph. If you go to Geography from any subject the graph stays the same.
Caveat around subjects with foundation and higher tiers. Easier to predict an outcome from a smaller possible spread of grades.