Unless you’ve been living in a (lovely, cool) cave, you’re unlikely to have missed the fact that there was a heatwave last week. Temperatures peaked at 37C and schools around the country closed their doors, with some reports suggesting as many as 1,200 schools were closed at the height of the heatwave.
Even where schools remained open pupils may have felt exhausted, or seen existing heath conditions aggravated, after a series of sweltering days and nights. Some will also have faced issues with transport on their journey to school.
So we would certainly expect to see a peak in school absence rates over the last week. In this post, we dig into data from around 10,000 schools subscribed to FFT Attendance Tracker to look at big that peak was, and how much of it was due to school closures.
We’ll also look at how the impact varied around the country and the impact on disadvantaged pupils.
School closures vs absences
There are two ways we’d expect missed sessions to be marked in schools’ registers: “attendance not possible”, indicating that a pupil’s school was closed [1] (fully or partially), or “absent”, indicating that a pupil’s school was open but that they did not attend.
In both cases, there is no register code to signal that the missed session was caused by heat. For example, a pupil may have been absent due to a long-term, unrelated health condition. So, instead, as a proxy, we calculate the percentage of sessions missed last week and compare with the previous week.
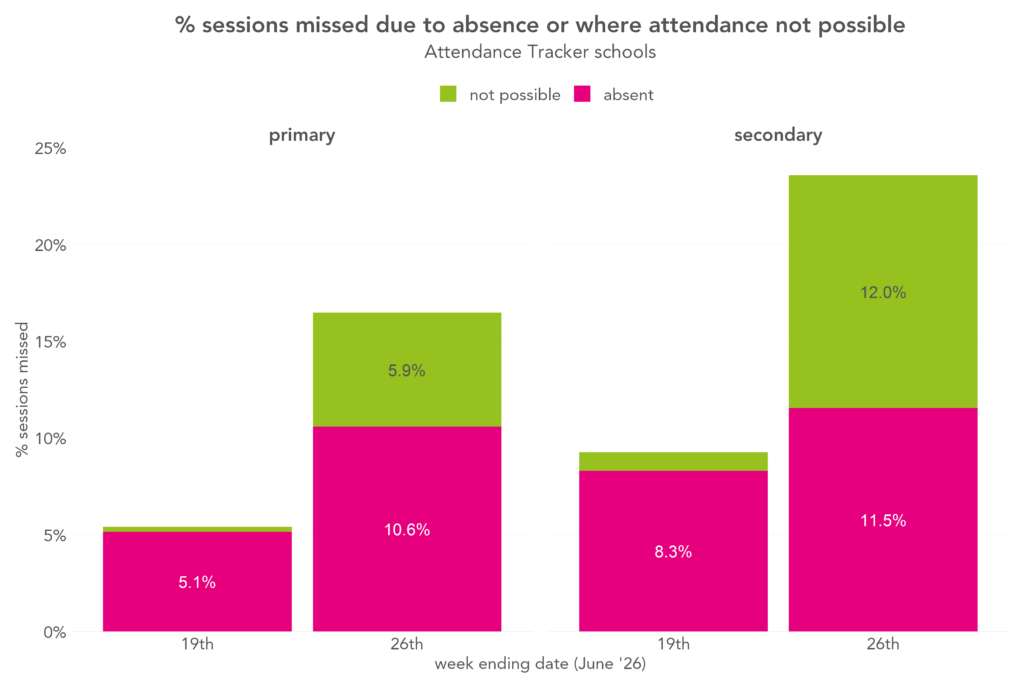
In total, 16.5% of primary sessions were missed last week, being recorded either as “attendance not possible” or “absent”, an increase of around 11 percentage points (pps) compared with 5.4% the week before. For secondary, the increase was around 14pps, from 9.3% to 23.6%.
School closures appear to have impacted more pupils at secondary than primary: there was an increase of 11pps in sessions recorded as “attendance not possible” at secondary compared with 5.6pps at primary. But there was a bigger increase in absence at primary than secondary: 5.6pps vs 3.2pps.
We can break this data down by region to see how the picture varied across the country.
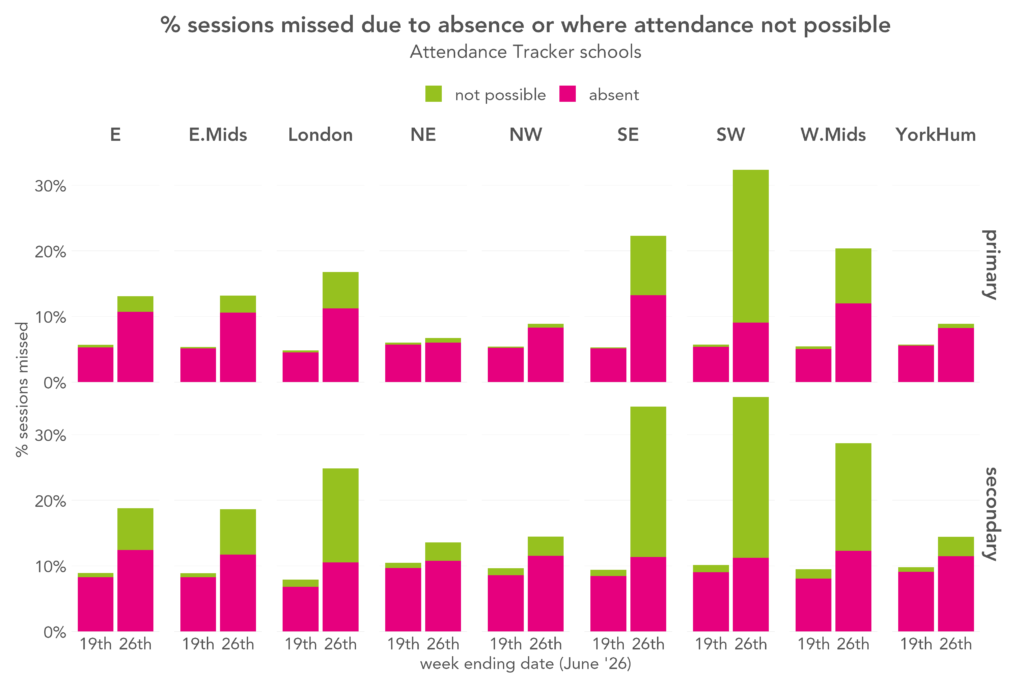
School closures at primary appear to have been most common by far in the South West, which saw a 23pp increase in sessions recorded as “attendance not possible”. The region with the second-largest increase was the South East, with 9pps, followed by the West Midlands, with 8pps.
At secondary, both the South West and South East saw high rates of closures, with increases of 23pps and 22pps in sessions recorded as “attendance not possible”. Closures appear to also have been common in the West Midlands (+15pps) and London (+13pps).
At primary, regions with higher rates of school closures tended to also see greater increases in absence, apart from in the South West, which saw a below average increase in absence (+4pps). The South East (+8pps), West Midlands (+7pps) and London (+7pps) saw the biggest increases. Conversely, the North East saw almost no increase.
At secondary, increases in absence were smaller and varied less by region. The relationship with school closures was also more mixed. Although very few schools in the East of England appeared to close, it was the region with the greatest increase in absence (+4pps), tied with the West Midlands, and closely followed by London. The South West again saw one of the lowest increases (+2pps). The North East saw the lowest increase of any region (+1pp).
Missed sessions for disadvantaged pupils
Absence rates tend to be higher, on average, among disadvantaged pupils, and absence during the heatwave has been no exception.
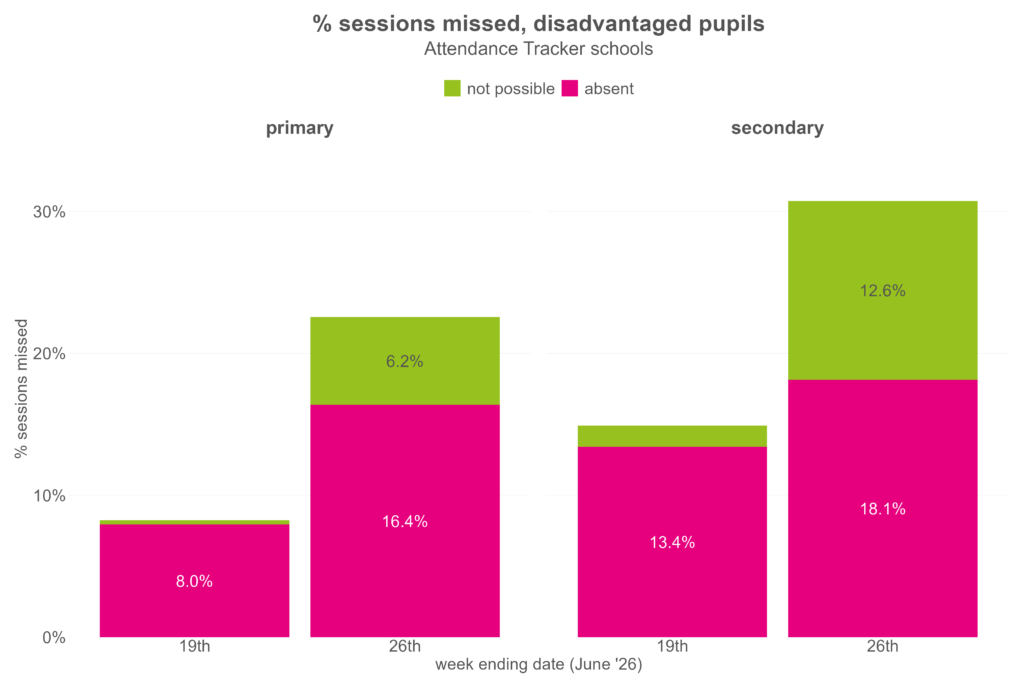
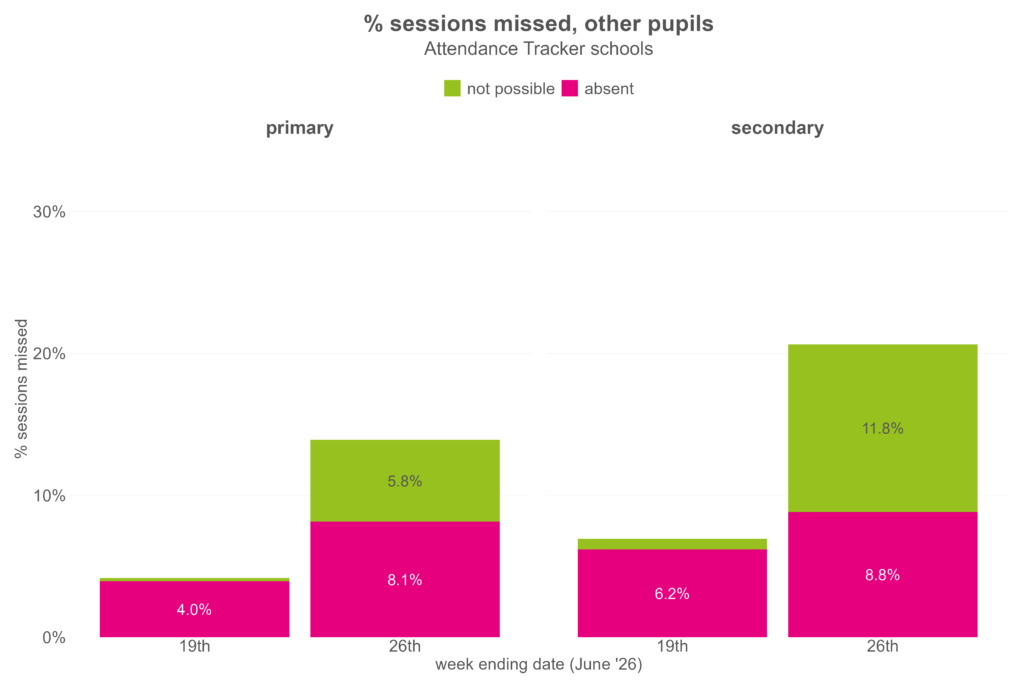
During last week, around a third of sessions were missed by disadvantaged secondary pupils, compared to around 20% of sessions missed by their peers. In primary schools, 23% of sessions were missed by disadvantaged pupils and 14% by their peers.
But there’s little to suggest that the disadvantaged pupils’ absence rates were affected more strongly by the heatwave: both in the weeks before and during the heatwaves, the absence rate for disadvantaged pupils were roughly twice those of their peers. The percentage of sessions missed due to school closures was slightly higher for disadvantaged pupils, but the differences were small: less than one percentage point for both primary and secondary pupils.
Absence rates by week and day
So far, we’ve been looking at sessions missed due to both absence and school closures. But let’s go back to looking at the more commonly used absence metric – that is, just looking at absence rather than including school closures.
So from this point on we’ll be looking exclusively at the sessions pupils could possibly have attended, i.e. sessions that occurred when their schools were open, and seeing what percentage of those sessions they missed due to absence.[2]
Here we show how absence rates last week compared to the rest of the year.
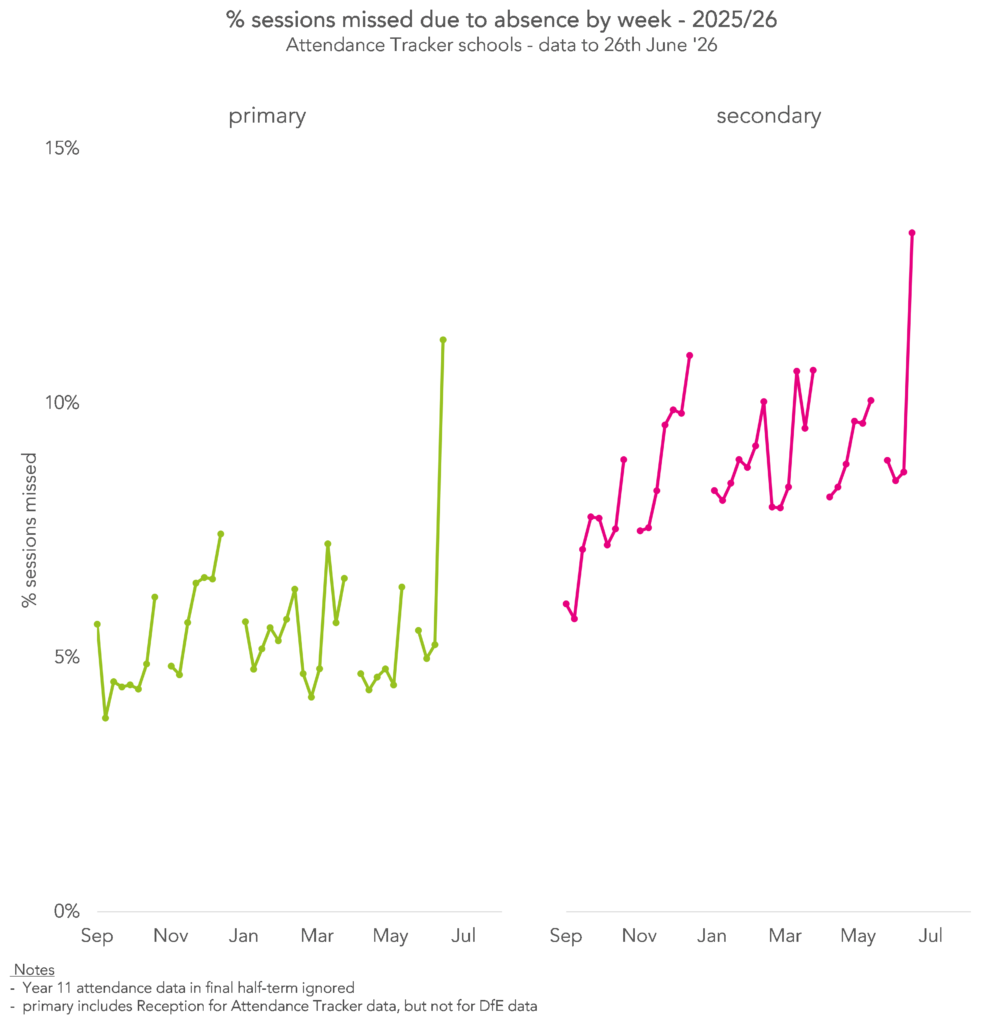
As we’ve already seen, there was an obvious jump in absence rates last week.
But the highest temperatures were not seen until later in the week and, as everyone who slogged through the heatwave will remember, the impact built up as the week went on: buildings held on to residual heat with no chance to cool down, disruption to transport worsened, and people felt the effects of night after night of poor sleep.
So let’s break absence down by day. Here we compare absence on each day of last week to absence on the same day of the week, averaged over the last three weeks.
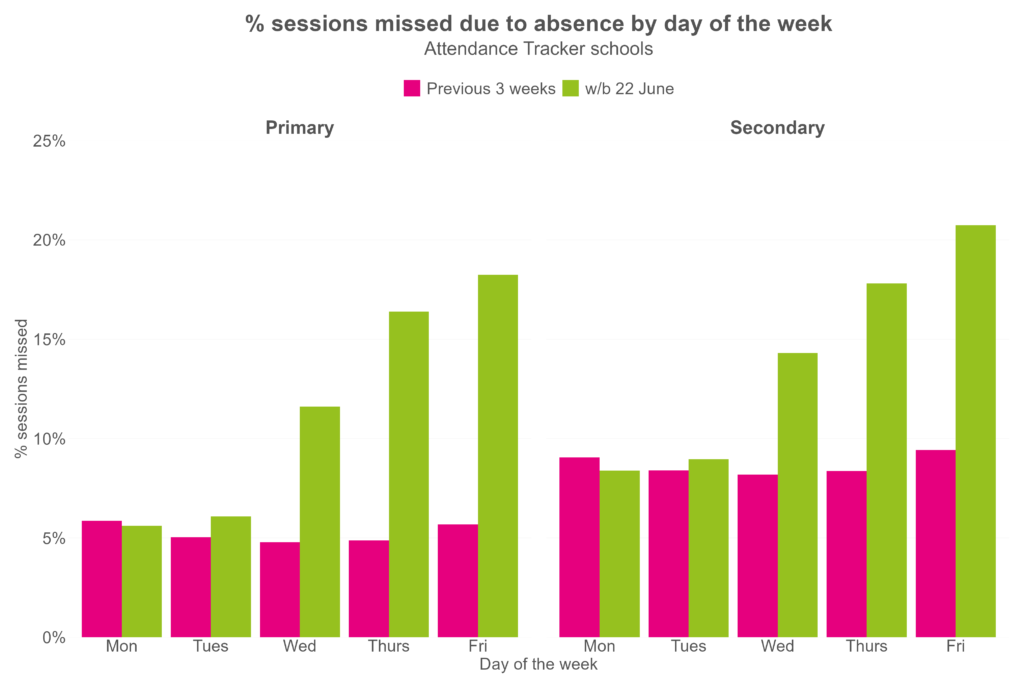
The highest absence rates were concentrated in the last three days of the week, with a peak on Friday. More than one in five sessions were missed due to absence in secondary schools on Friday, and more than one in six in primaries.
Summing up
During the heatwave there was a huge spike in both absence from school, and school closures. This varied around the country, with particularly high levels of absence and closures in the south of the country where temperatures were highest.
While disadvantaged pupils missed more school than their peers, this is in line with the usual absence rates. School closures do not seem to have impacted disadvantaged pupils substantially more than their peers.
[1]: These “attendance not possible” codes are used for other reasons, for example, when a pupil is in criminal justice detention, but they usually make up a negligible proportion of sessions recorded. When we see a lot of “attendance not possible” codes tends to be when schools are closed.
[2]: Therefore the figures shown in this section exclude pupils recorded as “attendance not possible” from both the numerator and denominator when calculating absence rates, and will differ slightly to those shown elsewhere in this post.
Want to stay up-to-date with the latest research from FFT Education Datalab? Sign up to Datalab’s mailing list to get notifications about new blogposts, or to receive the team’s half-termly newsletter.


Leave A Comment