About Dave Thomson

Dave Thomson is chief statistician at FFT with over fifteen years’ experience working with educational attainment data to raise attainment in local government, higher education and the commercial sector. His current research interests include linking education and workplace datasets to improve estimates of adult attainment and study the impact of education on employment and benefits outcomes.

What might EBacc average points scores look like?

Although previous governments used the machinery of performance tables and school accountability to drive improvements in the education system, the Coalition government of 2010 was the first to use it to influence the qualifications that pupils entered at age 16. But for all the rhetoric about the damaging effects on curriculum offer of the English [...]

Are more pupils really taking arts subjects?

Schools Week last week published a handy summary of Ofqual’s release of summer 2017 examination entry statistics. It notes that entries in EBacc subjects have risen whilst entries in other subjects have fallen. This raises the question of whether the EBacc is crowding other subjects out of the curriculum. In defence of the EBacc, Schools [...]

By |2017-10-23T12:43:11+01:0023rd June 2017|Exams and assessment, School accountability|

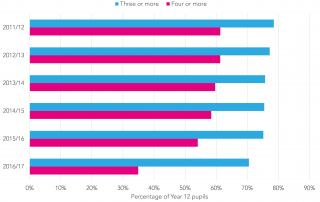
Young people are taking fewer A-Levels as qualification reforms kick in and per-student spending falls

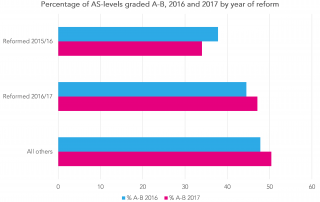
Post-16 education is in a period of flux, with major qualification reforms and a drop in per-student spending. Reformed A-Levels began to be introduced from September 2015, with a concurrent decoupling of AS-Levels. And, as the IFS have reported [PDF], spending per student in school sixth forms and further education has been falling since 2010/11. [...]

By |2017-10-23T12:50:47+01:0018th May 2017|Exams and assessment, Post-16 provision|

Shadowplay

Towards the end of last month, the Department for Education published ‘shadow’ Attainment 8 data for 2015/16 [PDF]. This shows the impact of moving from the familiar scoring of A*-G grades – one point for grade G, up to eight points for grade A* – to the interim scale that will be used in 2016/17 [...]

By |2017-10-23T13:02:05+01:0027th April 2017|Exams and assessment, School accountability|

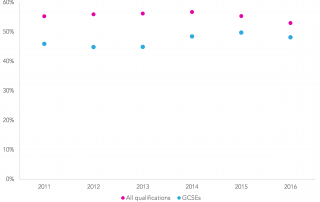
Are 19-year-olds really becoming less qualified?

Aficionados of DfE Statistical First Releases (SFRs) were shocked to their very core a couple of weeks ago with the revelation that the percentage of 19-year-olds qualified to Level 2 had fallen for the first time since records began. In the real world this equates to young people achieving five or more GCSEs at grades A*-C [...]

Weird science

So, you are in Year 9 and it’s time to pick your options. (We'll leave aside whether funding constraints leave you with many options). Which science route are you going to take? Triple science or combined science? Will your GCSE grades be roughly the same whichever route you opt for? In this blogpost we look [...]

By |2018-09-27T17:46:17+01:0020th March 2017|Exams and assessment|

Getting older quicker

At Datalab we write about half a dozen blogposts in a typical month. Some we slave over and others we knock out in a matter of minutes, usually with one eye on the football or Paw Patrol. Being unashamed data wonks, we then pore over Google Analytics to see which of our posts have left [...]

By |2025-04-01T16:39:27+01:003rd March 2017|Pupil demographics, School accountability|

Putting Progress 8 in context

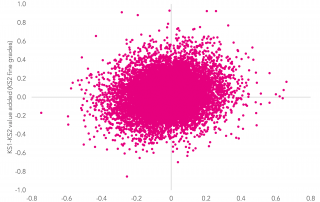
We thought we’d run out of things to say about Progress 8 but a couple of blogposts from Tom Sherrington and Jim Gordon last week made us realise that we hadn’t. Both examine, among other things, how Progress 8 scores vary by pupil and school characteristics. (Progress 8 is the headline value added measure by which [...]

By |2018-09-27T17:46:44+01:002nd March 2017|Exams and assessment, School accountability|
Go to Top