Our accountability systems – Ofsted and performance tables – require us to place all schools on a line from the very best to the very worst.
Every few years we change how this line is drawn. Every time the line is redrawn, headteachers declare the performance metric to be unfair.
There is no magical formula for converting KS2 scores into attainment targets
Attainment 8 and Progress 8 are the latest attempts to re-draw the line. At the heart of these measures are the idea that a child’s test scores at age 11 can be converted to an expected GCSE performance across a broad range of subjects.
A child with a Key Stage 2 fine grade of 4.4, for example, is ‘expected’ to achieve an Attainment 8 measure of 44.41 (grade Cs and Ds at GCSE). Where does this expected figure come from? The simple answer is that it is the average that children with a 4.4 KS2 fine grade achieve at GCSE.
The more important (and precise) answer is that this relationship is determined by a mish-mash of factors including the average academic capabilities of children who scored 4.4 at age 11, the average support that children who scored 4.4 are likely to receive at home and the average secondary school quality of those schools attended by children scoring 4.4 at age 11.
Implicit in the calculation is the idea that the school quality of the child in question is only compared to the average school quality for those who educated children like them and not the national average school quality.
The Government is judging schools on a metric that, by design, favours affluence
Outperforming an expected Attainment 8 score results in a positive Progress 8 score for the child, and adding these all up gives the school’s total Progress 8 score. At this point a problem emerges.
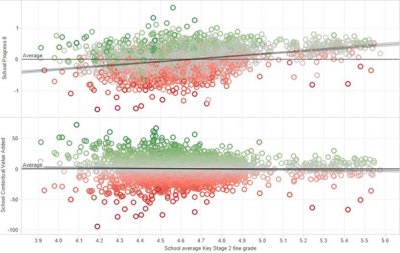
School Progress 8 is clearly related to the school’s intake attainment (see the top chart below). Why does this happen when the measure, by construction, has an expected pupil Progress 8 of zero for all levels of prior attainment?
The problem is that we don’t know why. If it is because pupils in schools have clustering of social circumstances so that a low attaining pupil who attends a relatively affluent school is likely to have a supportive home environment then Progress 8 is manifestly unfair to schools serving disadvantaged communities. There is a simple fix for this problem: return to an old-style contextual value added measure that uses regression analysis to remove the gradient and give schools with affluent and deprived intakes an equal ‘chance’ of doing well (see the bottom chart below).
Schools in deprived communities may indeed be less effective schools, but is this within their control?
However, by forcing all schools to have an equal chance of doing well across the spectrum of school types we make an enormous assumption that there are equal numbers of effective schools serving deprived communities as there are serving affluent communities. We have good reasons to suspect this is not the case.
There is a relationship between the level of school disadvantage and the turnover rate of its teachers. Schools with lower ability intakes struggle to recruit specialist teachers for shortage subjects. And they often struggle to appoint headteachers.
So, even if we could use data to divide the part of the underperformance of children from more deprived communities that results from home environment from the part that is in control of the schools, how meaningful would this division really be? Schools serving more deprived communities do differ in their practice from other schools – but they do so in an attempt to mitigate less supportive home environments and because they face very real resource constraints of their own.


Leave A Comment