Secondary school performance tables report the attainment of the pupils who are present at the end of Key Stage 4 (KS4), some of whom have completed their entire secondary education at the school and others who have joined subsequently.
But should the school be judged as equally responsible for the attainment of the child who arrives in year 10 as it is for the child who arrives in year 7?
And what about pupils who leave the school? Apocryphal tales of parents being ‘encouraged’ to take their children off-roll and educate them at home are widespread. But only rarely are accusations of malpractice designed to boost school performance proven. (And since 2006, ‘penalty add-backs’ remove the capacity of schools to do this in the last 12 months of a pupil’s school career.)
Given that pupil mobility is relatively high in England, we believe it would be fairer to publish performance table metrics based on all pupils who received any of their secondary education at a school. It would allow our judgements of schools to reflect the time investments they have made in every child’s learning. Schools would need to ensure that any transfers of their pupils elsewhere, including to special schools and pupil referral units, are indeed in the pupils’ best interests. And it would encourage schools to accept new pupils in years 10 and 11, knowing it would not excessively threaten their performance table results.
Re-weighting pupil contributions to school performance is straightforward
We know where each pupil completing KS4 in 2013/14 spent their secondary education through the 15 Census returns from autumn 2009 to summer 2014. For our analysis we collate this information for 2,864 state-funded mainstream schools that admitted a year 7 intake in September 2009, ensuring we correctly account for mergers, amalgamations and academisation. (We exclude some brand new schools, those with a tiny intake, and those with year 8 or 9 intakes.)
The autumn 2009 Census contained 518,000 pupils on-roll at the schools in our analysis. The size of this cohort increases during KS3 through migration into England. It then begins to decline, as pupils move into other types of schools – new schools such as university technical colleges and studio schools, or other types of establishment like special schools and pupil referral units.

Termly change in cohort size in mainstream schools
We match each pupil in our cohort to their end of KS4 attainment and count the number of terms each pupil was on-roll at each school, re-weighting school performance measures accordingly. So a pupil on-roll for the full 15 terms receives a weight of one, while a pupil on-roll for nine terms receives a weight of 0.6 (nine divided by 15).
Suppose five pupils attend a particular school at some point in their secondary school careers:

Example pupil data for a school
Traditional performance tables would count pupils A, B and E equally, translating to a 100% pass rate. Our methodology would reduce E’s weighting to 0.53 and add part of C and D’s results even though they finished their education elsewhere. Thus, we judge this school as having an 83% pass rate on 3.53 pupils.
With this change, most schools would see results stay largely the same, but some would see declines of more than five percentage points
We chart the difference between actual and weighted percentages of pupils achieving five or more A*-C grades at mainstream secondary schools in 2014. Overall, our weighted national average is 1.5 percentage points lower than the national average, reflecting net loss to alternative provision, special schools or home education.
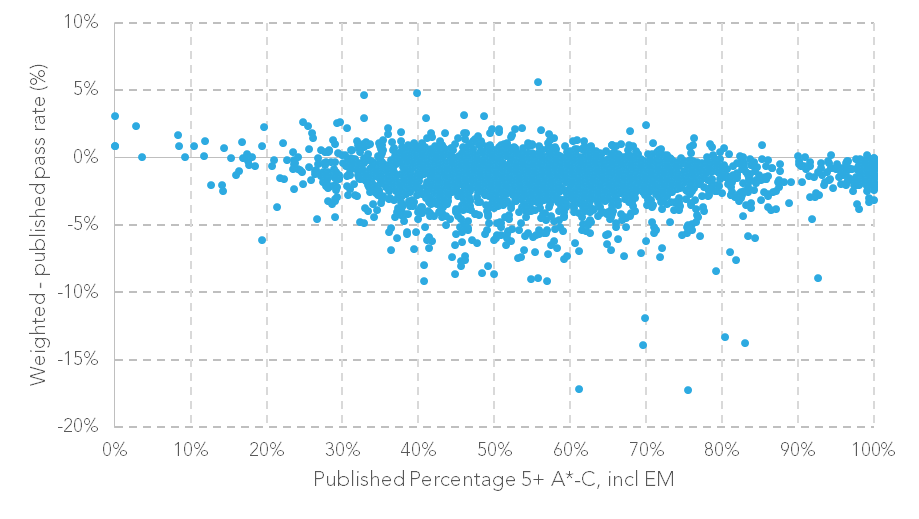
Difference between weighted and published GCSE pass rates
Published and re-weighted pass rates differ substantially for a number of reasons. In some cases, the school could have recruited pupils after year 7, thus boosting published results but counting for less under our weighted system. Playing a larger part, though, are those pupils who leave schools who therefore warrant close examination.
Leavers underperform dramatically when compared with those who don’t move school
In our analysis there are more than 85,000 instances of pupils leaving a school, relating to 74,000 individuals (some pupils leave schools more than once) or 6% of our total cohort. These leavers are markedly different children to those who stay in the same school for KS3 and KS4. 57% of transfers involved pupils known to be eligible for free school meals at some point during their compulsory education, compared to 31% of those who remained at one school from the autumn of year 7 until the end of KS4. Overall, only 25% of those in the leaver group gain five or more A*-C grades, versus 44% for those who joined a mainstream school after autumn of year 7 (the joiners group) and 63% for the stayers.
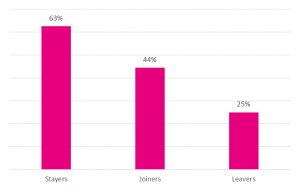
Percentage of pupils achieving five or more A*-C grades at GCSE (or equivalent) including GCSE English and maths

Final destination of leavers
London schools would lose the most if we moved to a system where all schools involved in the secondary schooling of a child were accountable for their performance
There are large regional differences in pupil mobility and so it is not surprising that schools across the country are differently affected by re-weighting performance table metrics.The difference in attainment for Inner London is largely driven by its relatively high leaver rate of 9% compared to a national average of 6%. The final destination for 17% of pupils leaving Inner London schools was alternative provision compared with 10% of all leavers nationally. Urban settings makes transfer to alternative provision more straightforward, but other cities in England do not match London in their prevalence. 27% of Inner London leavers had no final destination (22% nationally) which may be indicative of a higher level of emigration.
Mainstream schools in Inner London would see the greatest impact of our re-weighting, with an overall decline of almost 4 percentage points in pupils achieving five or more A*-C including English and maths.
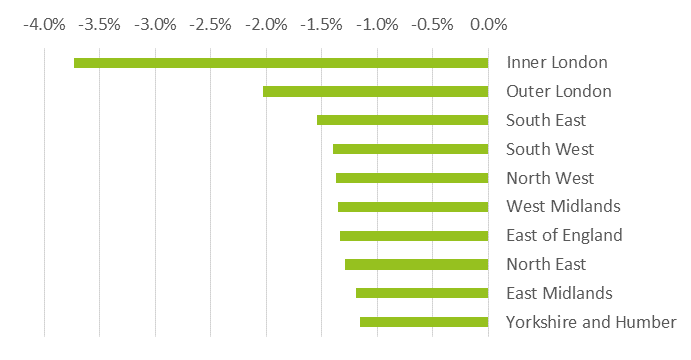
Difference between weighted and published percentages of pupils achieving five or more A*-C grades (or equivalent) including GCSE English and maths
Accountability systems must serve the interests of children first
Asking schools to retain some accountability for students they no longer teach is tough. They may not have chosen to lose the student and they cannot influence subsequent curriculum and teaching decisions that will affect the child’s GCSE performance. But all of these issues equally apply to those who transfer late to schools and yet count as much as any other pupil in performance tables. Schools equally may not have chosen to receive these pupils and they certainly have no influence on the quality of teaching prior to their arrival.
We think performance metrics should be weighted to reflect the time investment schools make in different children. Where a pupil is educated in multiple institutions, there should be shared accountability between all those involved.
We do great damage to the educational opportunities of those who, for whatever reason, need to transfer in year 10 because schools are understandably reluctant to become wholly accountable for their GCSE performance. And all transfers out of a school must be done in the best interest of pupils. Whether other mainstream schools, alternative provision or special schools are being considered, our re-weighted performance metrics will better ensure that all parties are motivated to support a school transfer only when they believe it will improve a child’s educational success.
**We first published this analysis in our report for secondary schools called Floors, tables and coasters: shifting the education furniture in England’s secondary schools.


Leave A Comment