This is part one in a series of posts exploring trends in attainment over time by month of birth. Other posts in the series can be found here.
Dave Thomson’s recent blogpost about how attainment varies by month of birth reminded me of one of the reasons I first got interested in looking at the impact of context when helping schools to evaluate performance.
It was back in 1992 when Key Stage 1 (KS1) tests were introduced. At that time I was working in a local authority context with responsibility, amongst other things, for developing the use of data analysis for school improvement.
When asked to do a ‘ranking’ of schools based on their KS1 outcomes my immediate reaction was to think ‘I wonder what difference it will make if we took account of some context factors’.
At that time we didn’t have any prior attainment for KS1 pupils so value-added wasn’t possible, so I did something very simple:
- ranked schools by the average KS1 level;
- adjusted the rank to take account of the month and gender of each pupil
Differences were small for most schools, but there were a small number with big variations.
The most extreme case was a school that went from being ranked 120 (out of 165 schools, so about 70th percentile) to 40 (24th percentile).
That’s quite a jump – below average to top quartile – caused simply by taking into account the age and gender distribution in each school’s cohort.
So, reading Dave’s blogpost and some comments on Twitter about how much difference it would make if we allowed for month of birth prompted me to have a look at recent data. I looked at reading outcomes at KS1 for 2015 and did the following calculation:
- ranked schools on average reading national curriculum level using a 1-100 scale, with 1 corresponding to the highest attainment;
- ranked schools on attainment adjusted for age and gender distribution;
- compare these ranks, so a school that moved from rank of 50 to rank of 30, for example, would have difference of +20.
This gave a distribution of changes that looked like this:

As expected, because age and gender distribution is similar for most schools, there are few schools with big differences. Changes of percentile rank below 10 are rarely significant. Overall, 461 schools (3% of the total) changed by 10 or more. So, allowing for age and gender when evaluating school outcomes can be important – but differences are probably not worth worrying about for 97% of schools.
What caught my attention, though, was that the biggest change in percentile rank was 27 – quite a bit lower than the jump from roughly 70th to 24th percentile I had seen back in 1992. We might wonder how the impact of month of birth has changed over time.
To explore this further, I looked at how attainment in reading and mathematics at KS1 from 1998 to 2015 varied by pupils’ month of birth, using a range of indicators: Level 2+, Level 2b+ and Level 3+.
Results were intriguing. Charts below show the attainment difference between the youngest pupils (born in August) and the oldest pupils (born in September).
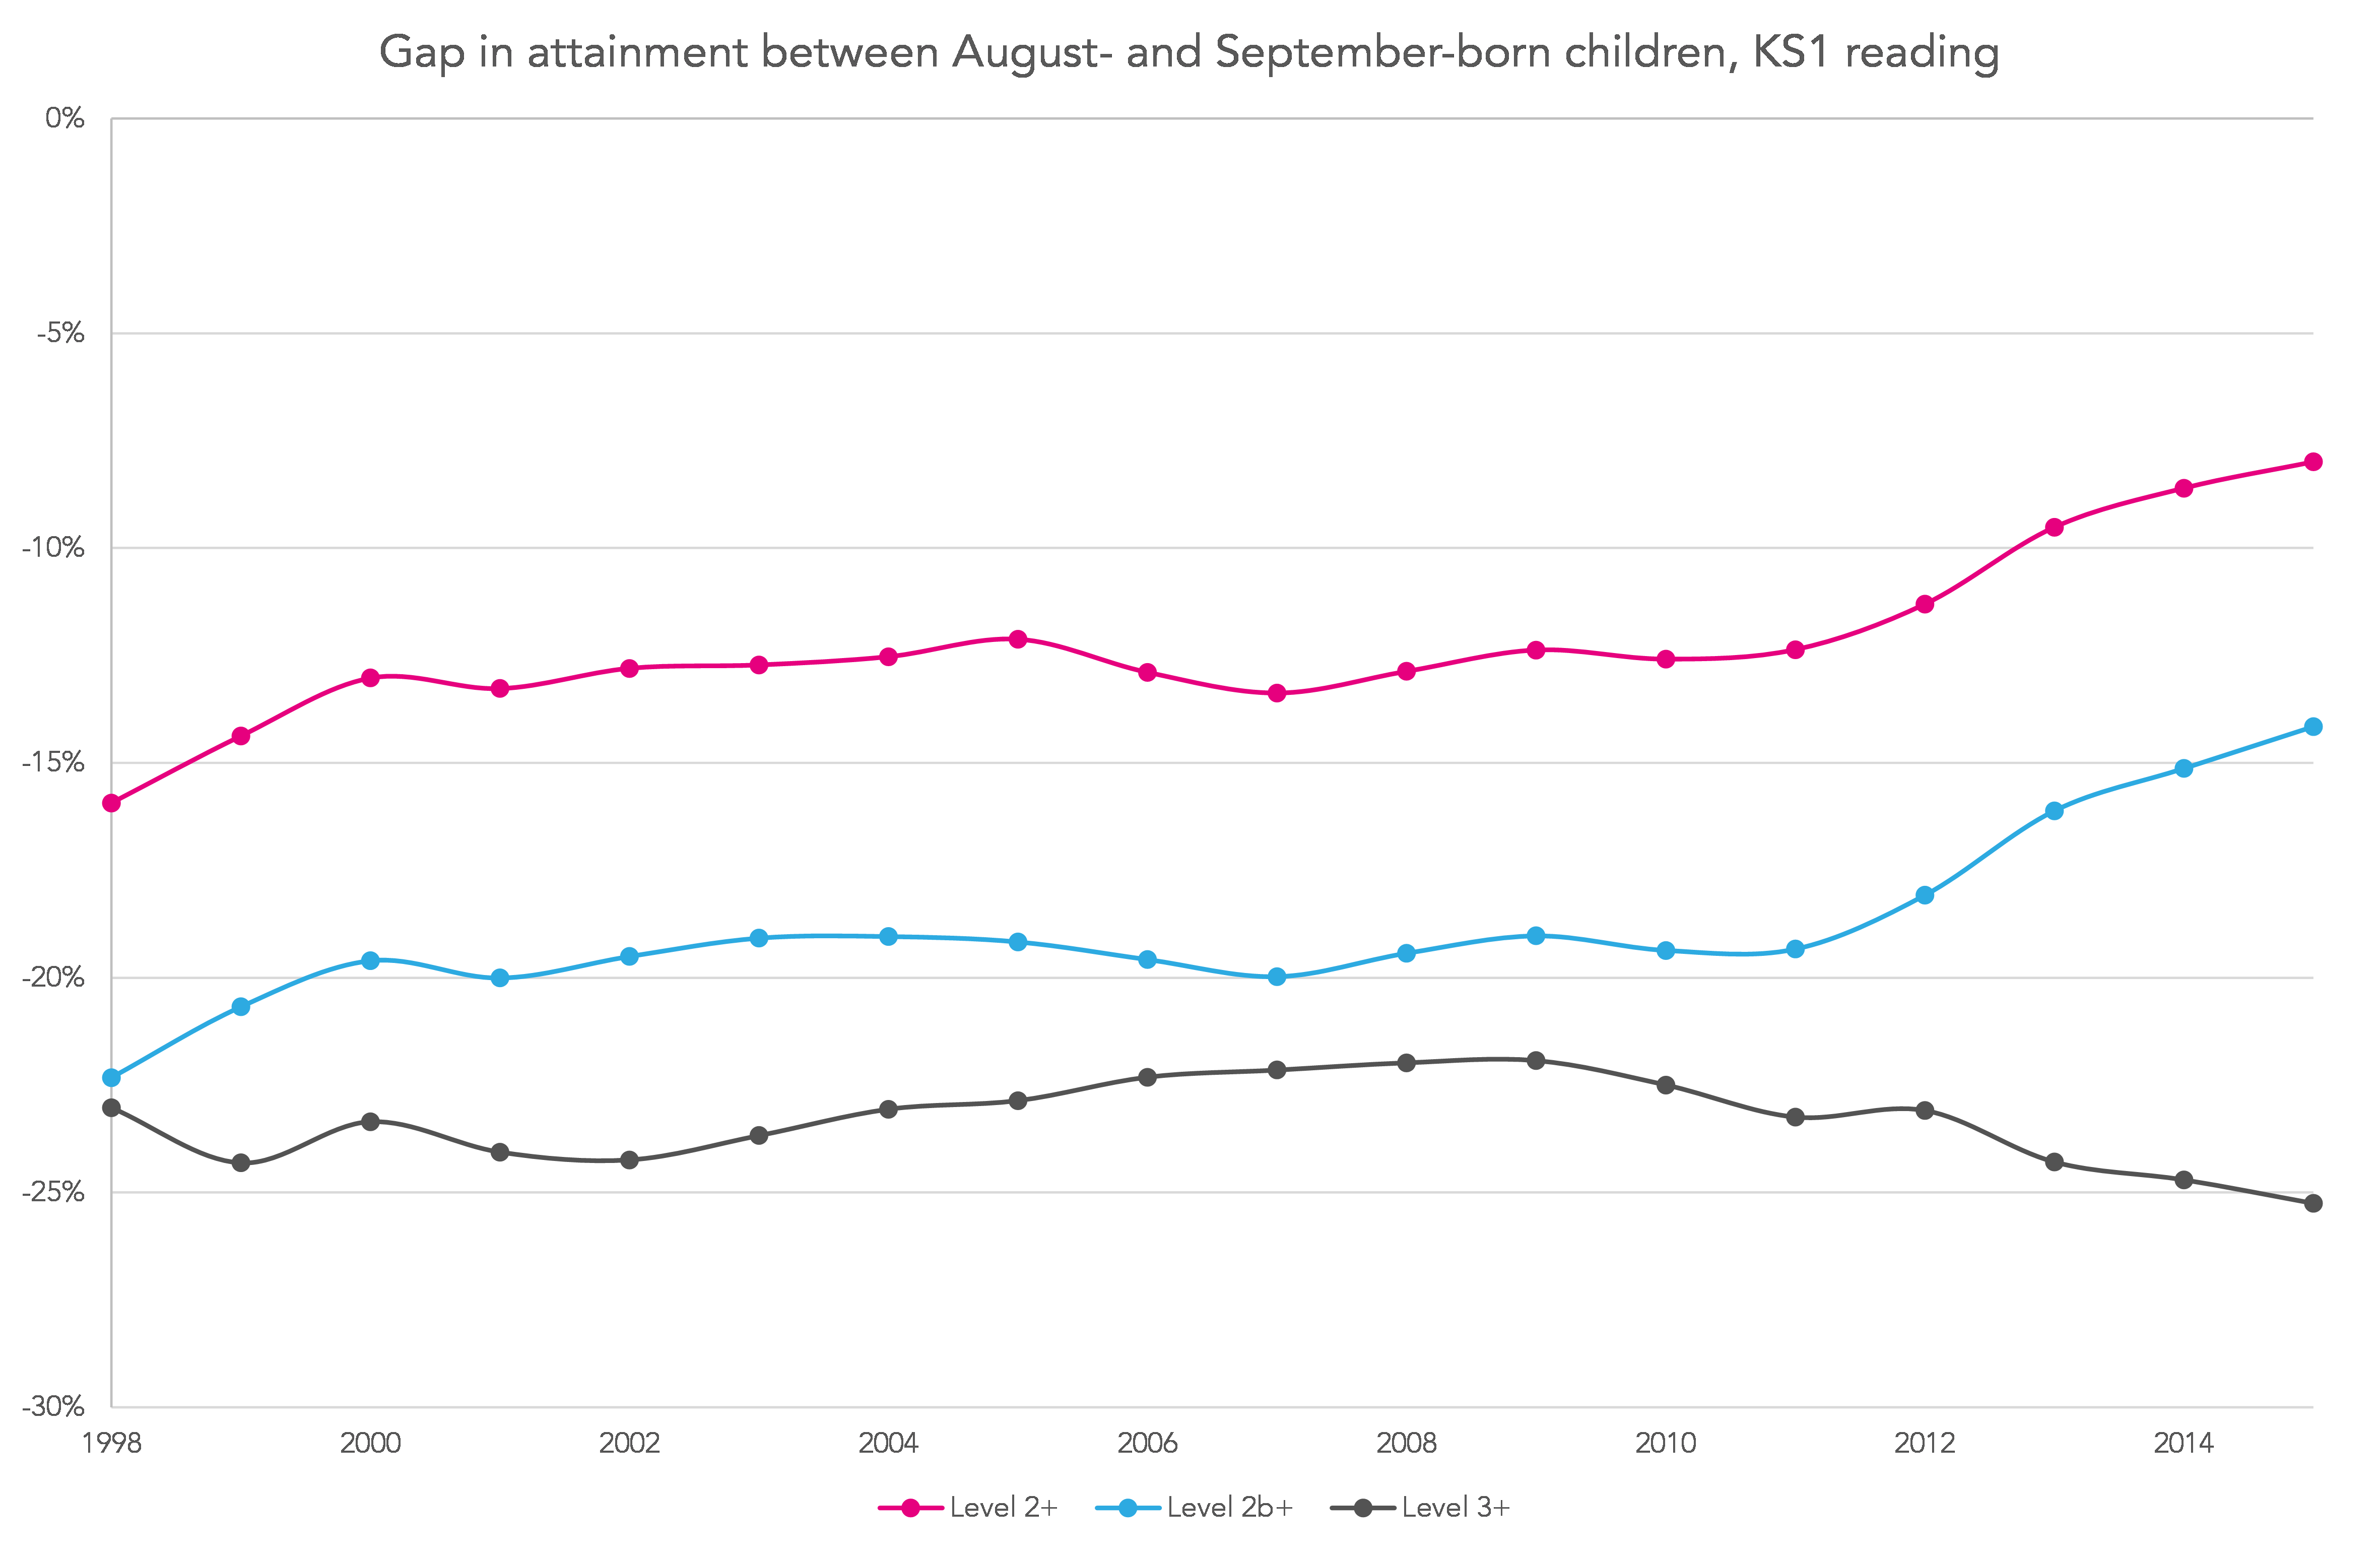
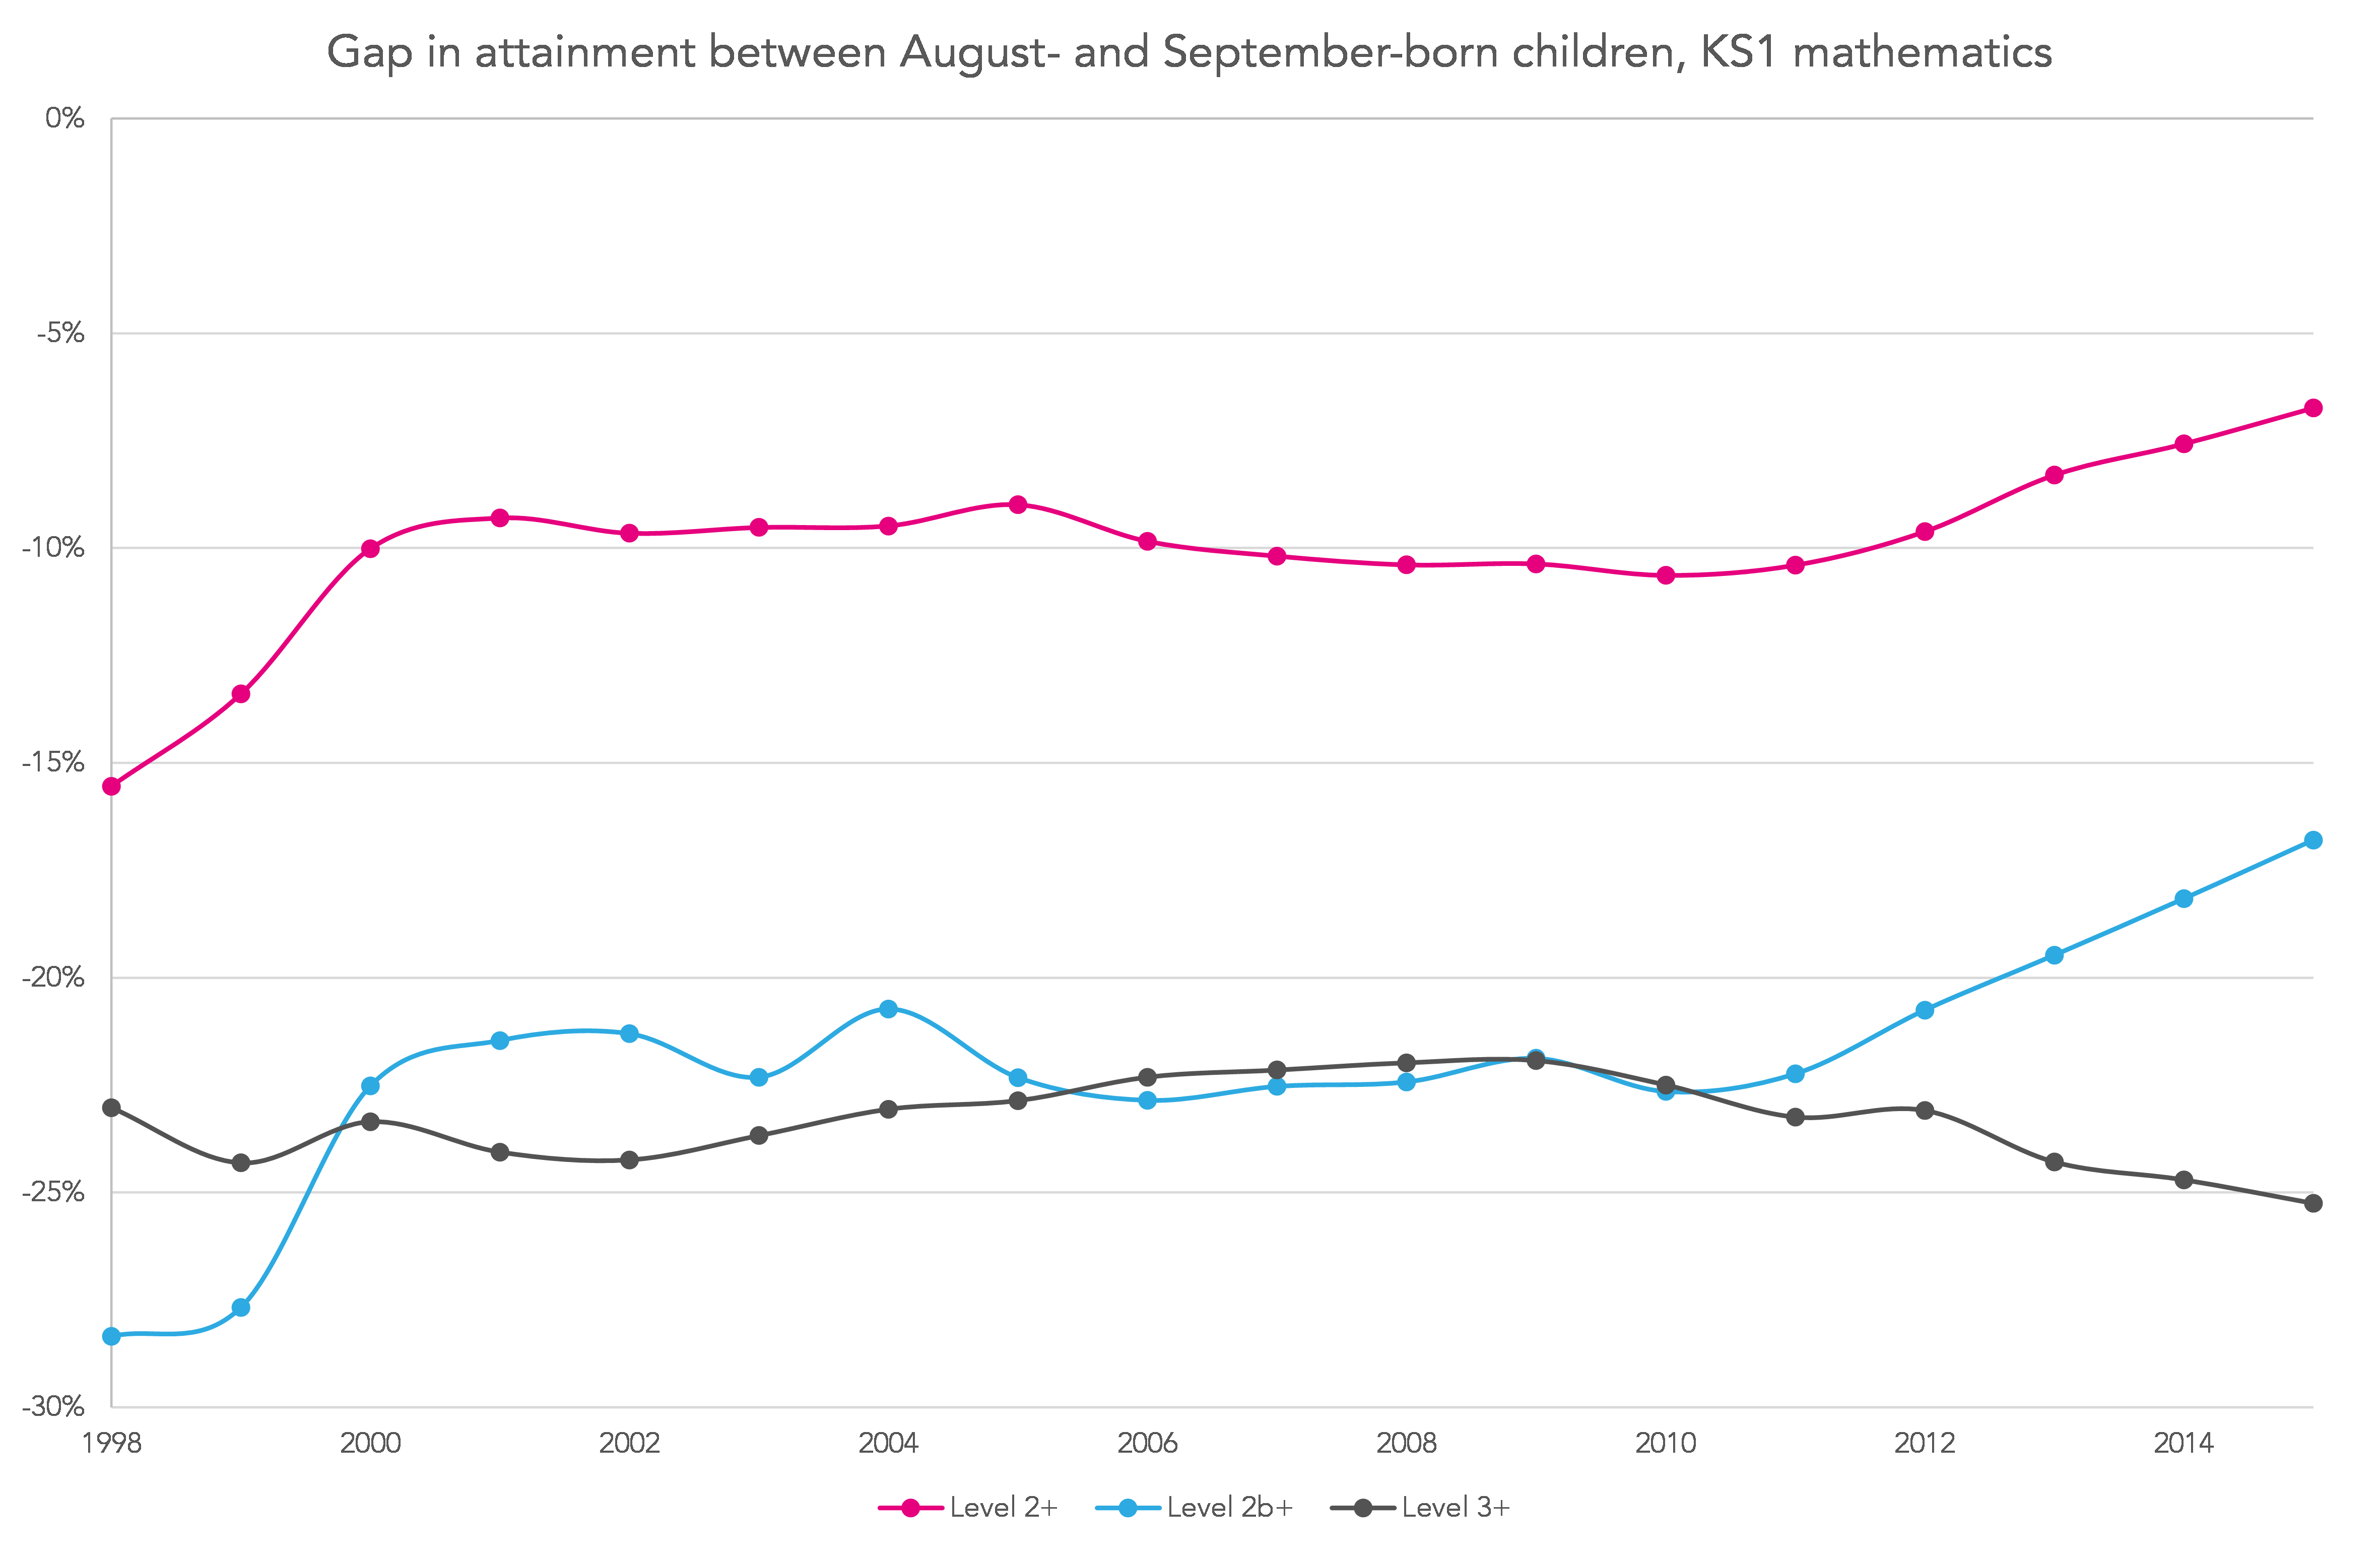
From the charts we can make out the following patterns:
- the gap is smallest for Level 2+ and biggest for Level 3+;
- the gap for Level 2b+ in mathematics is bigger by a few percentage points than that for reading;
- the gap has reduced for Level 2+ and Level 2b+, but widened slightly for Level 3+.
The patterns over time are intriguing – a closing of the gap from 1998 to 2000; small changes between 2001 and 2008; and a closing of the gap at Level 2+ and Level 2b+ from 2009 onwards whilst, at the same time the Level 3+ gap has widened slightly.
So, it looks like my calculations back in 1992 were OK – variations in attainment by month of birth were wider then, so allowing for them made more difference.
And although only 3% of schools had changes of 10 or more in their rank in 2015 that’s still nearly 500 schools – so it’s worth looking to see if the age/gender distribution is unusual when evaluating performance.
What’s more interesting is to postulate reasons why the gap has closed, and has done so particularly since 2009 – but not at Level 3+. Possible factors might be:
- a focus on improving attainment for pfupils likely to attain below Level 2 (or 2b);
- reluctance to assess pupils as attaining Level 3 because of concerns about impact on KS1 to KS2 value-added;
- earlier improvements in the attainment of younger pupils – in nursery or reception classes.
In a subsequent blogpost we will look at changes in Foundation Stage Profile data, to explore this issue further.
Want to stay up-to-date with the latest research from Education Datalab? Sign up to our mailing list to get notifications about new blogposts, or to receive our half-termly newsletter.

Leave A Comment