Late last night the Department for Education published the draft Bill with details of how ‘coasting’ will be defined. Three years’ data, from 2013/14 to 2015/16, will be used. The same indicators used to define floor standards will be used but the bar will be raised. The position of the bar for 2016 is not yet known.
For secondary schools, a school will be coasting if:
- in 2014 and 2015 fewer than 60% of pupils achieve 5 A*-C including English and mathematics and they are below the median level of expected progress in both English and mathematics; and
- in 2016 (and thereafter) their Progress 8 score is below a yet to be defined threshold.
Over 1000 secondary schools met the criteria for 2014, 356 of which were previously defined to be below the floor standard. However, not all of these will meet the criteria over three years. Using data for 2012-2014 as an example of how this works, we think 405 (13%) of secondary schools meet the criteria using three years of data. (A further 163 escape judgement because they are new or have changed status so don’t have 3 years of performance data available.)
In the figure below we show what proportion of schools would be deemed to be coasting on this metric, grouped by the average intake ability (KS2) of their intake. Schools serving more affluent communities will escape this judgement.
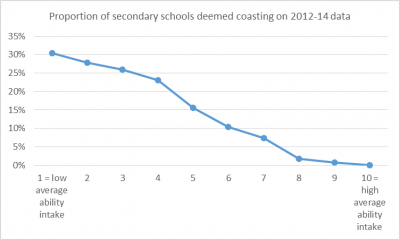
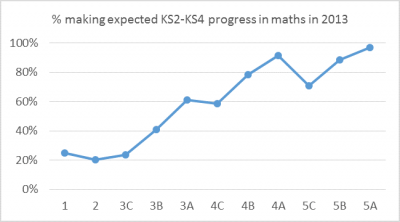
Why does this happen? It arises through the use of the expected progress indicator in the definition, in our view the very worst indicator routinely published about schools. As the chart below shows, the likelihood of a pupil making expected progress depends on their prior attainment. Therefore it is not a measure of progress at all.
Unfortunately this social gradient in judgements of coasting will not disappear as we switch to Progress 8
Schools in more affluent areas will, on average, achieve higher Progress 8 scores and so will be less likely to be judged as coasting. To give an idea of the magnitude of the problem, in 2014:
- Just 42/380 schools with FSM6 below 10% had a negative Progress 8 score
- 191/347 with FSM6 over 50% had a negative Progress 8 score
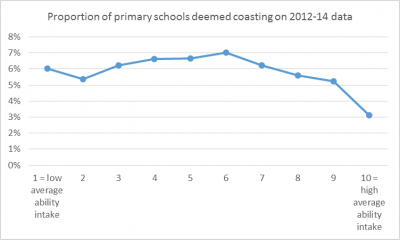
The distribution of the coasting judgement is less inequitable for primary schools
The Government proposes that:
- For 2014 and 2015 a school is coasting if fewer than 85% of its pupils achieve Level 4 or above in reading, writing and mathematics and below the median percentage of pupils make expected progress.
- From 2016 onwards, the 85% expected standard threshold will remain in some form and a progress indicator will be also be included. We await announcements of exactly how these will be defined.
Leave A Comment