So now we know.
The new Key Stage 2 tests in reading and maths were harder than their predecessors.
And there was also substantial variation in writing teacher assessment between local authorities.
In this post we examine which pupils met the expected standards in 2016, and how that compares to 2015.
We also look at the difficulty of this year’s reading test, and the comparability of this year’s results with last year’s.
Meeting the expected standards
Prior to the introduction of the new tests we were told [PDF] that a scaled score of 100 or more would be equivalent to Level 4b or above on the old tests. (A scaled score of 100 is the expected standard under the new-look Key Stage 2.)
In the grammar, punctuation and spelling component (GPS) this was true.
But it was not the case for reading and maths. In fact, a similar percentage of pupils achieved Level 4a or above in reading in 2015 as achieved this expected standard in 2016.
Percentage of pupils reaching expected standards, 2015 and 2016

Overall, 53 per cent of pupils met the new expected standard in all three of the reading test, maths test and writing teacher assessment, with 19 per cent of pupils meeting two of the three expected standards. Just 16 per cent were below the expected standard in all three subjects.
Percentage of pupils reaching expected standards in different combinations of subjects, 2016

How hard was the reading test?
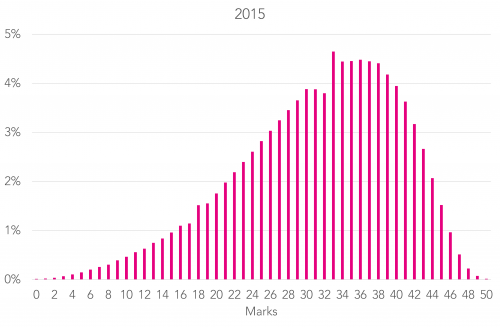
Just like its predecessor, the 2016 Key Stage 2 reading test had a maximum of 50 marks. However, that’s where the similarity ends.
The chart below shows that the 2015 distribution has shifted to the left. The modal number of marks was 33 in 2015 – the lower boundary of the Level 5 range – compared to 26 in 2016. That said the shape of the 2016 distribution is beautiful.
Distribution of marks awarded in KS2 reading, 2015 and 2016

Furthermore, there was an increase in the percentage of pupils who were not tested as they were considered to be working below the level of the test (up from 2.9 per cent to 3.3 per cent).
Leaving those pupils to one side, the top 20 per cent of pupils tested in 2016 achieved a score of 34 or more. (This equated to a scaled score of 110, the threshold for child to be considered to be at a high standard, as opposed to being at the expected standard.)
In other words, the top 20 per cent of pupils were spread across 17 marks (34-50) – a third of the whole test range.
This compares to 11-12 marks in the 2015 reading test (39- or 40-50), and 15 marks in the 2016 maths test, albeit out of a total of 110.
In other words, the overall difficulty of the reading test could probably be lowered without affecting the reliability of the test around this part of the distribution.
And on that note, technical details of the reliability of the test would be welcome.
Year-on-year comparability
In its statistical first release [PDF], the Department for Education said that it had:
“examine[d] the correlation between the ranked position of all schools on the percentage achieving Level 4b or above in 2014 and 2015 and the percentage reaching the expected standard in 2016 (as for the LA comparisons comparing 2014 final data with 2015 provisional data and 2015 final data with 2016 provisional data). This gave correlation coefficients of 0.56 for 2015 and 2016 data and 0.58 for 2014 and 2015 data. This suggests that we are not seeing greater variability in the data at school level.”
In other words, primary schools results from year-to-year are rather volatile, but the introduction of the new tests does not appear to have introduced any further volatility.
But what about groups of pupils? To investigate, we have retro-engineered the 2015 Key Stage 2 data to make it statistically comparable with the 2016 Key Stage 2 data. (We leave aside the rather important question of whether the new tests are measuring the same dimensions of reading and maths as the former tests.)
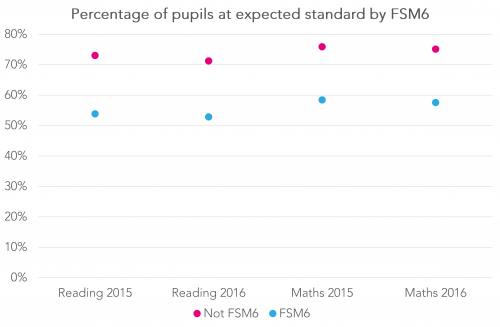
First we look at pupils eligible for the Pupil Premium due to being eligible for free school meals at some point in the previous six years (FSM6).
Here there was hardly any change in the attainment gap between this group and their peers in 2016.
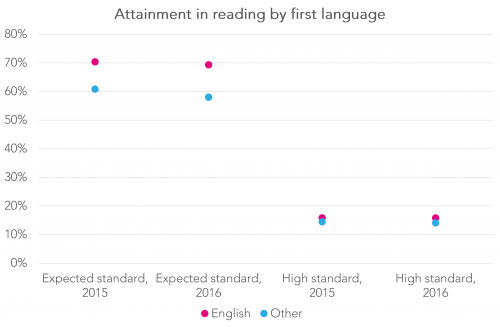
Pupils whose first language is other than English extended their advantage in maths in 2016, although they fell fractionally further behind in reading.

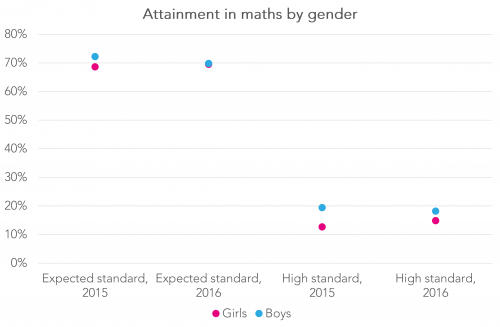
Finally, girls broadly maintained their advantage over boys in reading, and closed the gap with boys in maths.


Thanks for this post, Dave – it’s a very useful analysis of the big picture when looking at the changes introduced by the 2016 KS2 testing regime.
Can I ask where the data linking marks and number of children for the 2016 reading test come from? I’ve had a good look at the Statistical First Release you reference, but I can’t see it there. Is it published somewhere else, or have I missed something?
Ta.
Thanks Jack. DfE have given us access to to the pupil level data for 2016.
Ah, that makes sense – thanks for letting me know.
Hi Dave,
Thanks for this., very interesting Have replicated the curve for Ealing for 2016, which is a bit more spiky than the “beautiful” national curve as you would expect from a smaller cohort but differs a little in shape with a wider top and a far steeper drop on the downward slope than the national graph. Have produced similar curves for GPS and Maths for Ealing which are far more skewed towards the top end of the marks, only dropping off at the very top end. Our outcomes in GPS and maths were much better than in reading. Would be interested to see what the national distribution graphs look like for GPS and maths if you’ve got time to produce them
Kim