KS2 performance tables 2016: Primary schools in the North East are pulling away from the pack

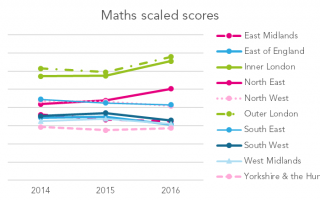
A decade ago, the proportion of 11-year-olds reaching expected standards did not vary much across the regions - except for a little place with an unfixable education system called Inner London. The lines in blue on the chart below show that most regions had just over 70% of pupils meeting the expected standard at that [...]

By |2016-12-15T13:08:34+00:0015th December 2016|Exams and assessment, School accountability|

KS2 performance tables 2016: Do we need value added at Key Stage 2?

Value added data, calculated by a number of different methods over the years, has been a feature of school performance tables since 2003. In principle, the idea is sound. Comparisons of schools’ raw attainment measures often say more about schools’ intakes than they do about the quality of teaching and learning. So if the state [...]

KS2 performance tables 2016: What can we tell about the new floor standards?

Final Key Stage 2 data has been published this morning, with 665 primary schools identified as being below the floor standards, compared to 676 last year. In line with the move to scaled scores, the way floor standards are calculated changed this year. Schools were judged as being below the floor standard if they failed [...]

By |2018-09-27T17:51:43+01:0015th December 2016|Exams and assessment, School accountability|

Should KS2 floor standards be based on an overall value added score?

From this year, the secondary school accountability framework will be predominately based around a single value added measure, Progress 8, although a small number of headline attainment indicators will be published alongside it. However, there is no single equivalent measure for primary schools. Three value added (VA) measures have been calculated in reading, writing and maths. [...]

By |2018-02-23T15:17:46+00:0026th October 2016|Exams and assessment, School accountability|

How did this year’s Key Stage 2 reading test compare to last year’s?

So now we know. The new Key Stage 2 tests in reading and maths were harder than their predecessors. And there was also substantial variation in writing teacher assessment between local authorities. In this post we examine which pupils met the expected standards in 2016, and how that compares to 2015. We also look at [...]

By |2017-10-23T12:45:46+01:0019th September 2016|Exams and assessment, Pupil demographics, School accountability|
Go to Top