Final Key Stage 2 data has been published this morning, with 665 primary schools identified as being below the floor standards, compared to 676 last year.
In line with the move to scaled scores, the way floor standards are calculated changed this year. Schools were judged as being below the floor standard if they failed on two criteria:
- the percentage of pupils reaching the expected standard in reading, writing and maths was below 65%; and
- any one of three progress measures was below a certain standard:
So which of these criteria actually led to schools being below the floor standard?
As the below Venn diagram shows, the vast majority of schools that were below the floor standard – 532 out of 665 – failed on just one of the progress criteria.
Combinations of progress criteria that led to schools being below the floor standard
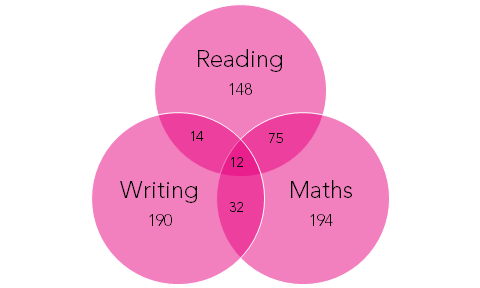
Twelve schools didn’t meet any of the three progress criteria, while a further 121 schools didn’t meet two out of the three criteria.
Of these, schools were most likely to be below the required standard in reading and maths, than in one of the combinations involving writing.
What else can we say from the data?
Although the government set out the intention [PDF] that no more than 6% of eligible primary schools would fall below the floor standard, 6.4% of junior and middle schools did so compared to 4.2% of all-through primaries. That might give further weight to concerns that the current way of measuring progress systematically disadvantages junior schools. (We explore the options for primary progress measures in more detail here.)
And no school had more than 65% of pupils reaching the expected standard in reading, writing and maths, and yet had progress below the required level in one of these subjects – meaning, this year at least, the 65% criteria was irrelevant in defining the floor standard.
Want to stay up-to-date with the latest research from Education Datalab? Follow Education Datalab on Twitter to get all of our research as it comes out.
1. The upper confidence level for these progress measures also needed to be above zero.


Although you note that the upper confidence interval needs to be above zero, as far as I can tell any school where the confidence interval is more than +/- 5 will automatically be exempted because of having too few pupils, making it equally as irrelevant as the 65% rule…
i am quite sure it is either one of the criteria the school must fit to be below the floor…
A school would need to meet both criteria to be below the floor standard. See e.g. https://www.gov.uk/government/uploads/system/uploads/attachment_data/file/659863/Primary_school_accountability_in_2017_technical_guide.pdf#page=5 (that’s the 2017 guidance, but the definition was the same in 2016).
That guidance is written in terms of being above the floor standard, so it states that schools have to meet either one of the criteria.