This is the seventh year that English Baccalaureate (EBacc) data has been published. It was first launched in January 2011 when retrospectively applied to 2010 Key Stage 4 data. Since then, much has been written about its impact on take-up of creative subjects, its suitability for less academically-gifted pupils, and even whether it risks failing to prepare pupils for their future lives.
Despite all these words – and the government’s ambition to increase EBacc take-up to 90 per cent of pupils – data published today shows that just 40 per cent of pupils were entered for all five elements of the EBacc[1] in 2016.
(One thing to note: the data released today is provisional KS4 data. Results tend to be revised up a little between the release of provisional results in October and the release of final results in January. All the 2016 figures discussed here are provisional figures.)
In fact, there has been little increase in EBacc entry or attainment since 2014. The chart below shows EBacc entry and achievement rates since 2011, the first year for which data on entries (as opposed to just data on EBacc achievement) was published.
EBacc entry and achievement rates, 2011 to 2016

The subject-by-subject picture
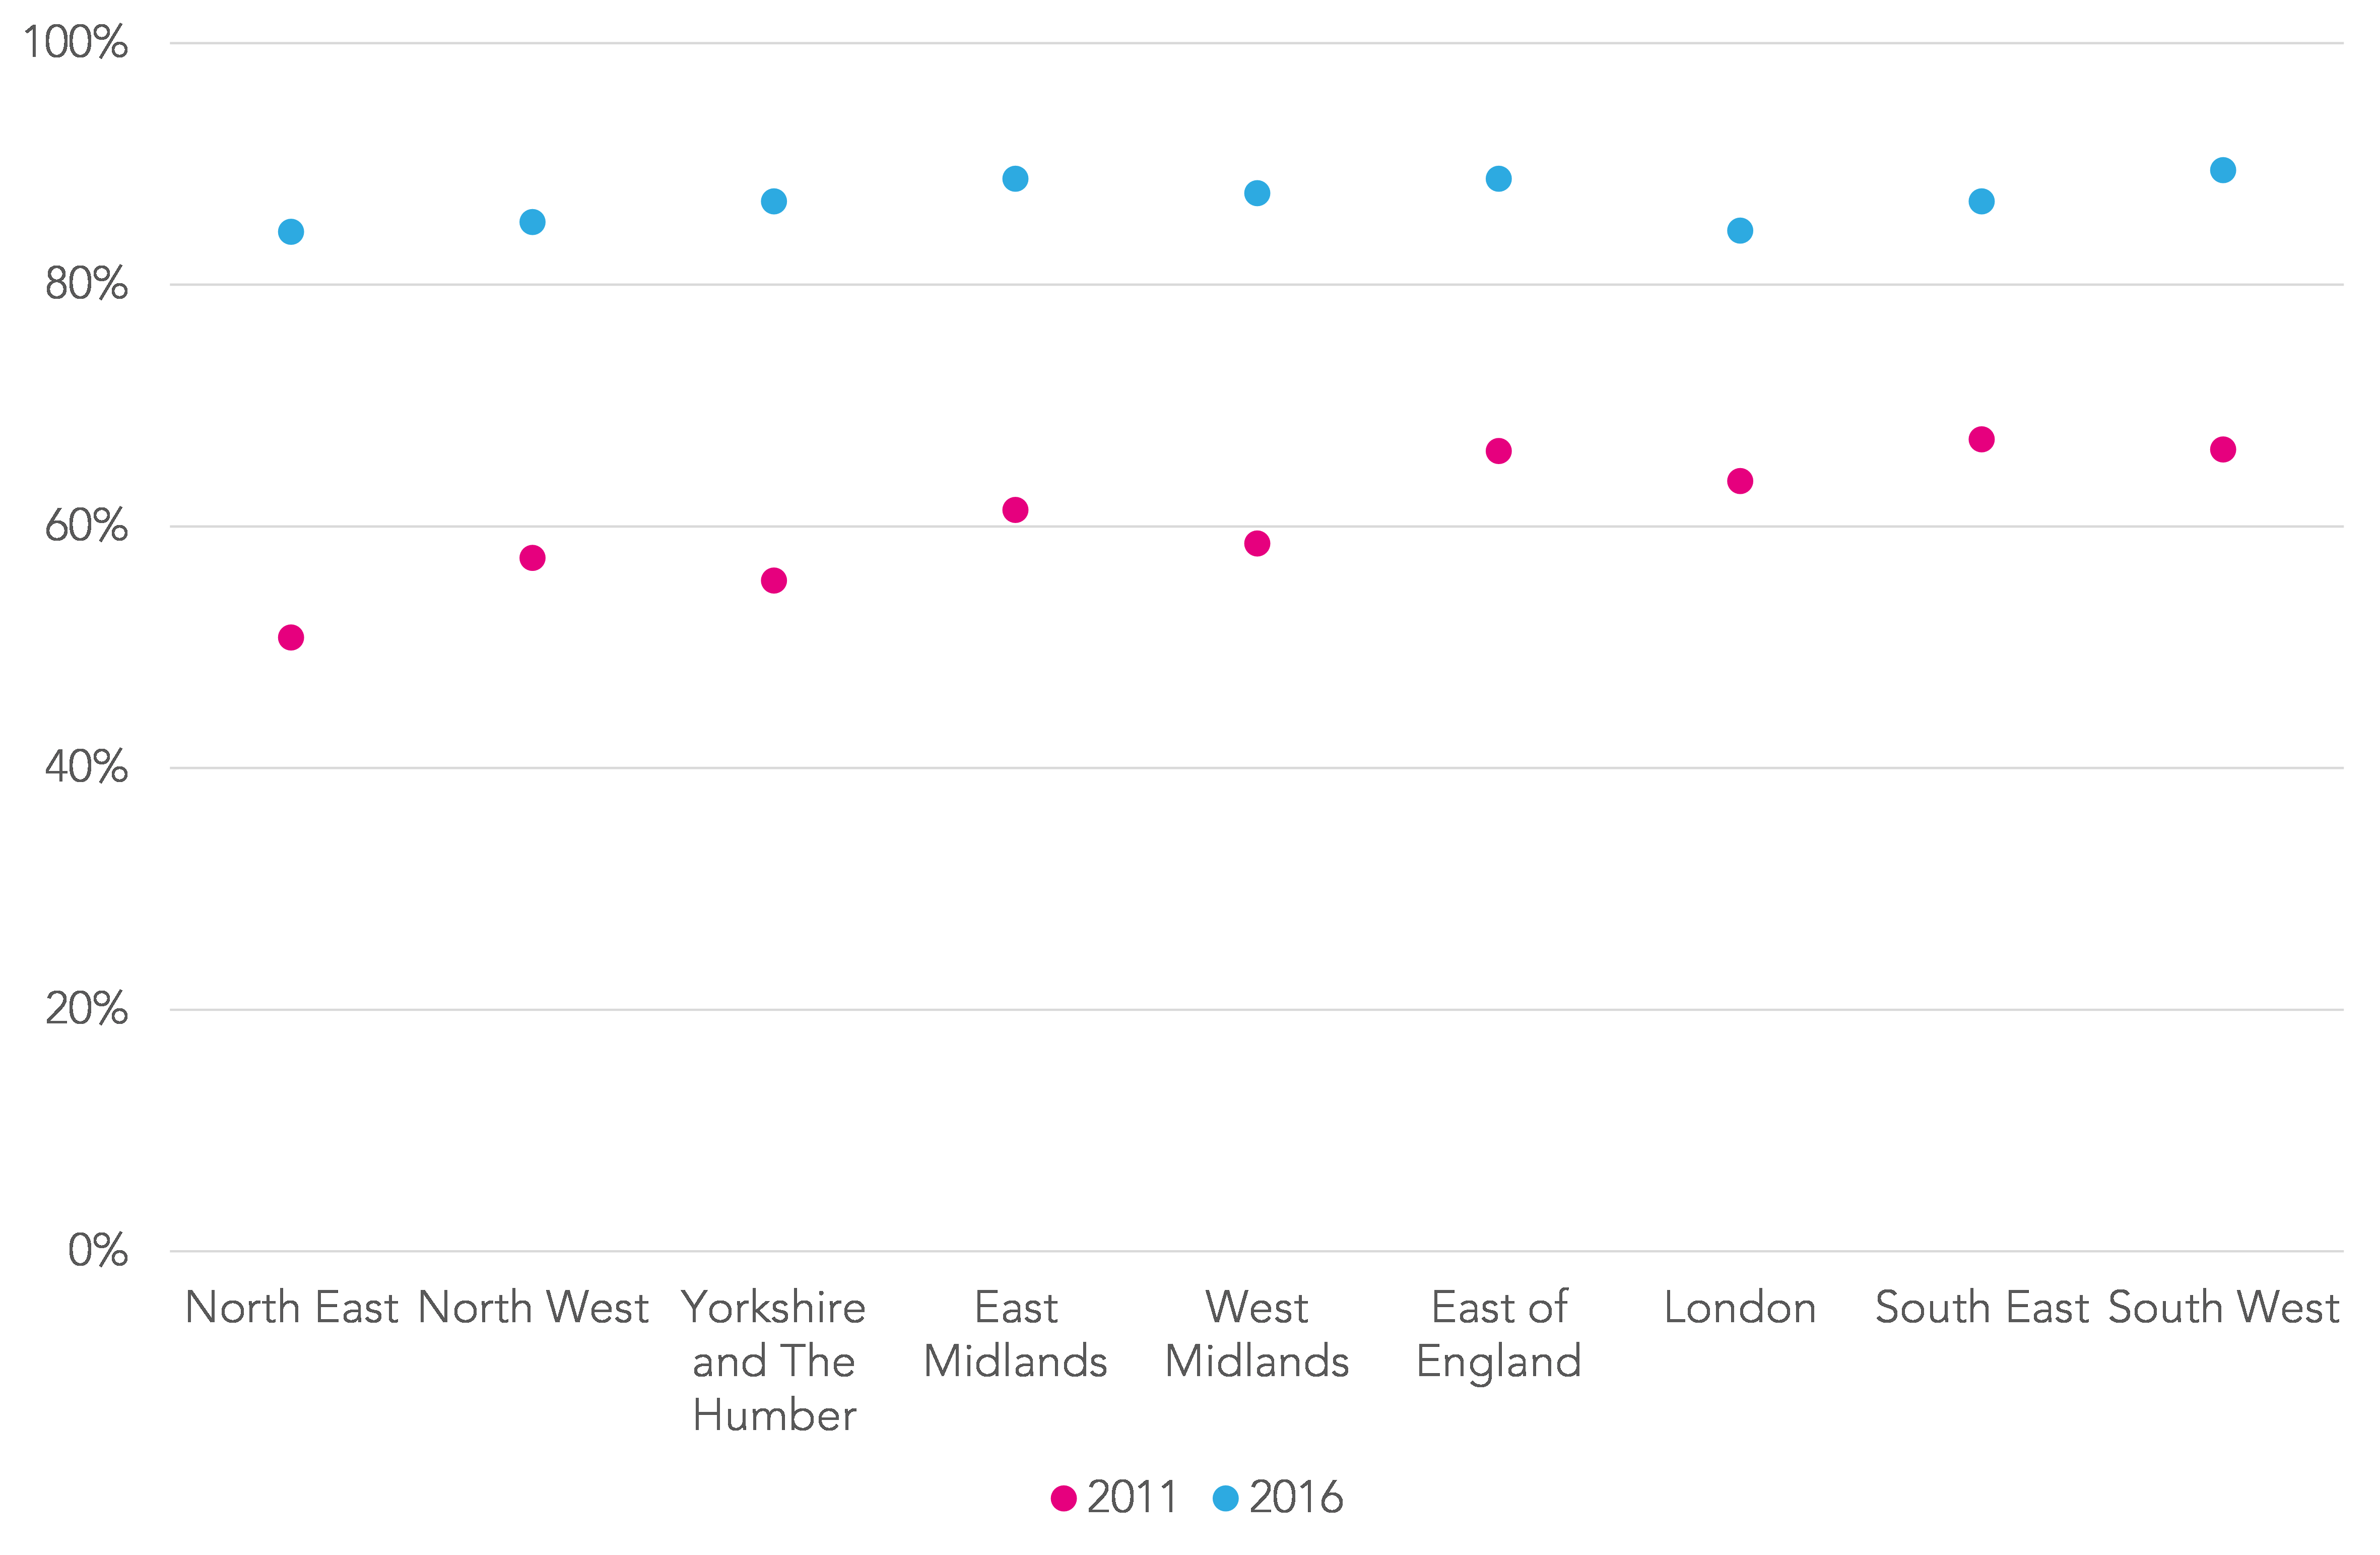
Even though there has been little change in the overall EBacc entry rate, the percentage of pupils entered for two sciences has increased nationally from 61 per cent in 2011 to 87 per cent in 2016.
As the chart below shows, there is now less regional variation in entry rates in GCSE sciences than there was in 2011. Much of the increase coincides with a decline in BTEC science and a rise in GCSE core and additional science.
EBacc double science entry rates by region
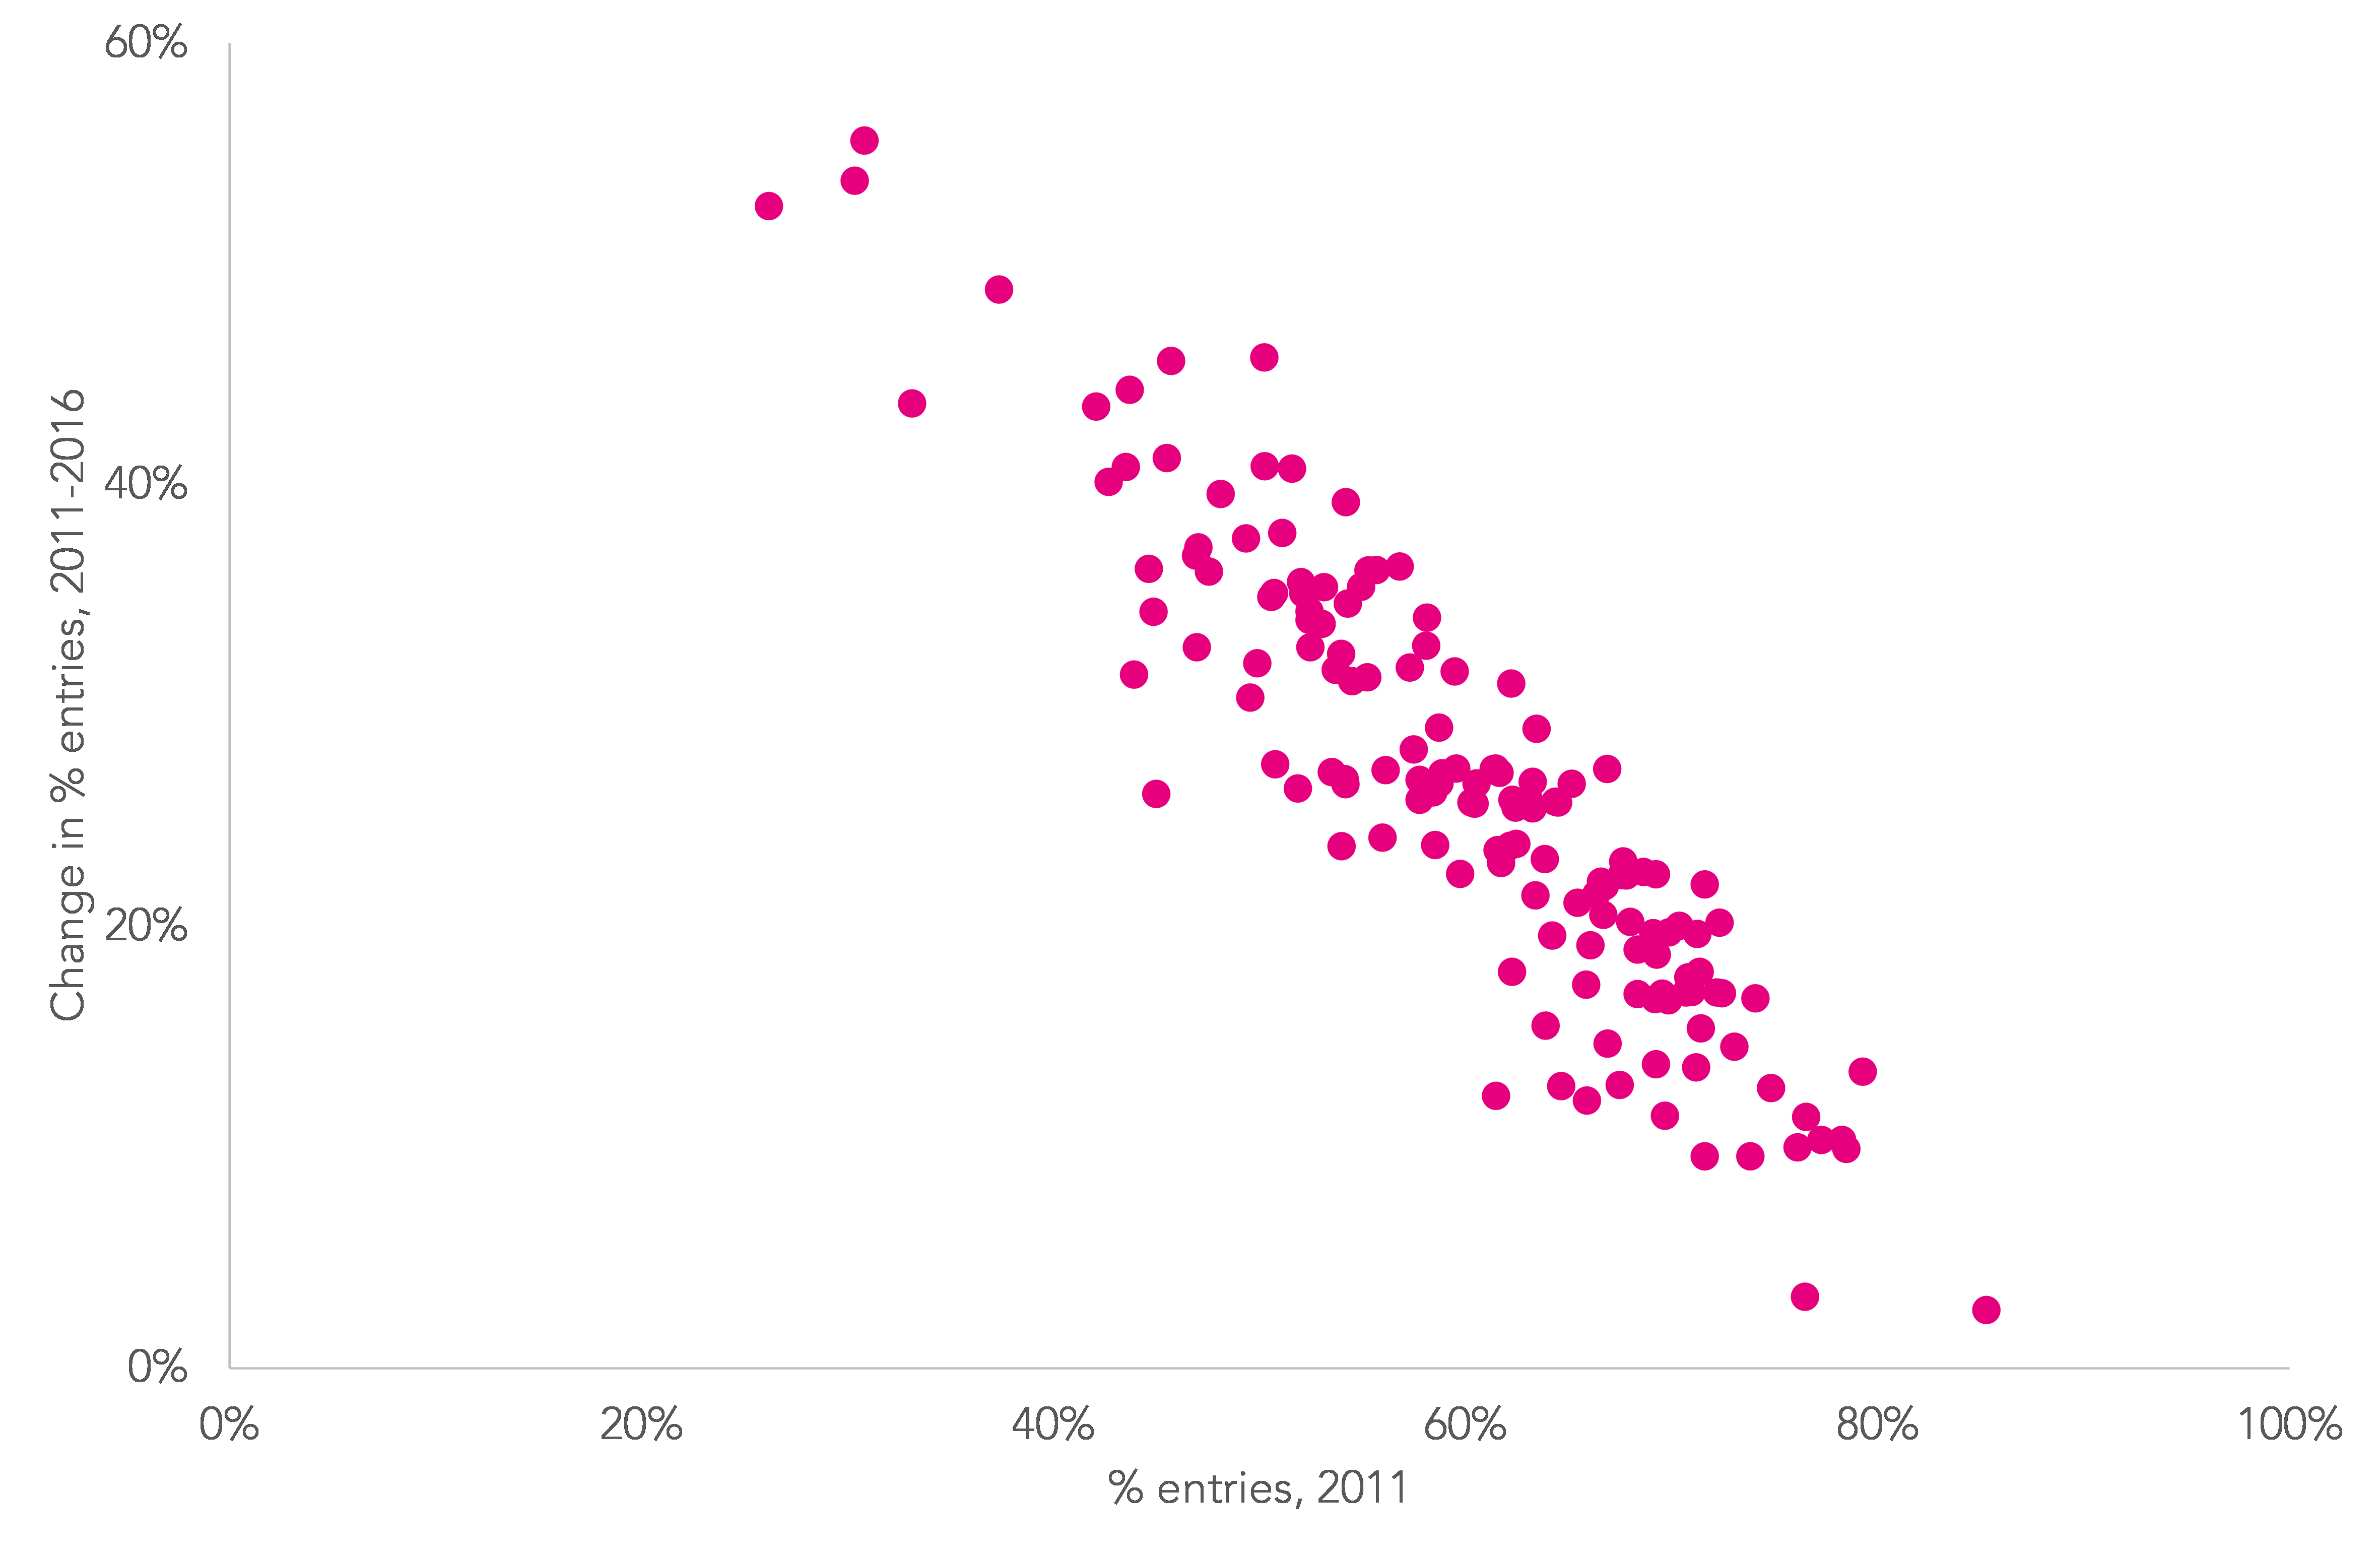
As you would expect, much of the increase in GCSE take-up has occurred in local authorities with hitherto low entry rates. Less than 40 per cent of pupils entered two sciences in 2011 in Halton, Knowsley, City of Hull, north-east Lincolnshire and Stoke-on-Trent. In 2016, more than 75 per cent did in each of these authorities.
Change in EBacc double science entry rates by local authority
The percentage of pupils entered for a humanity has also increased from 48 per cent to 74 per cent between 2011 and 2016.
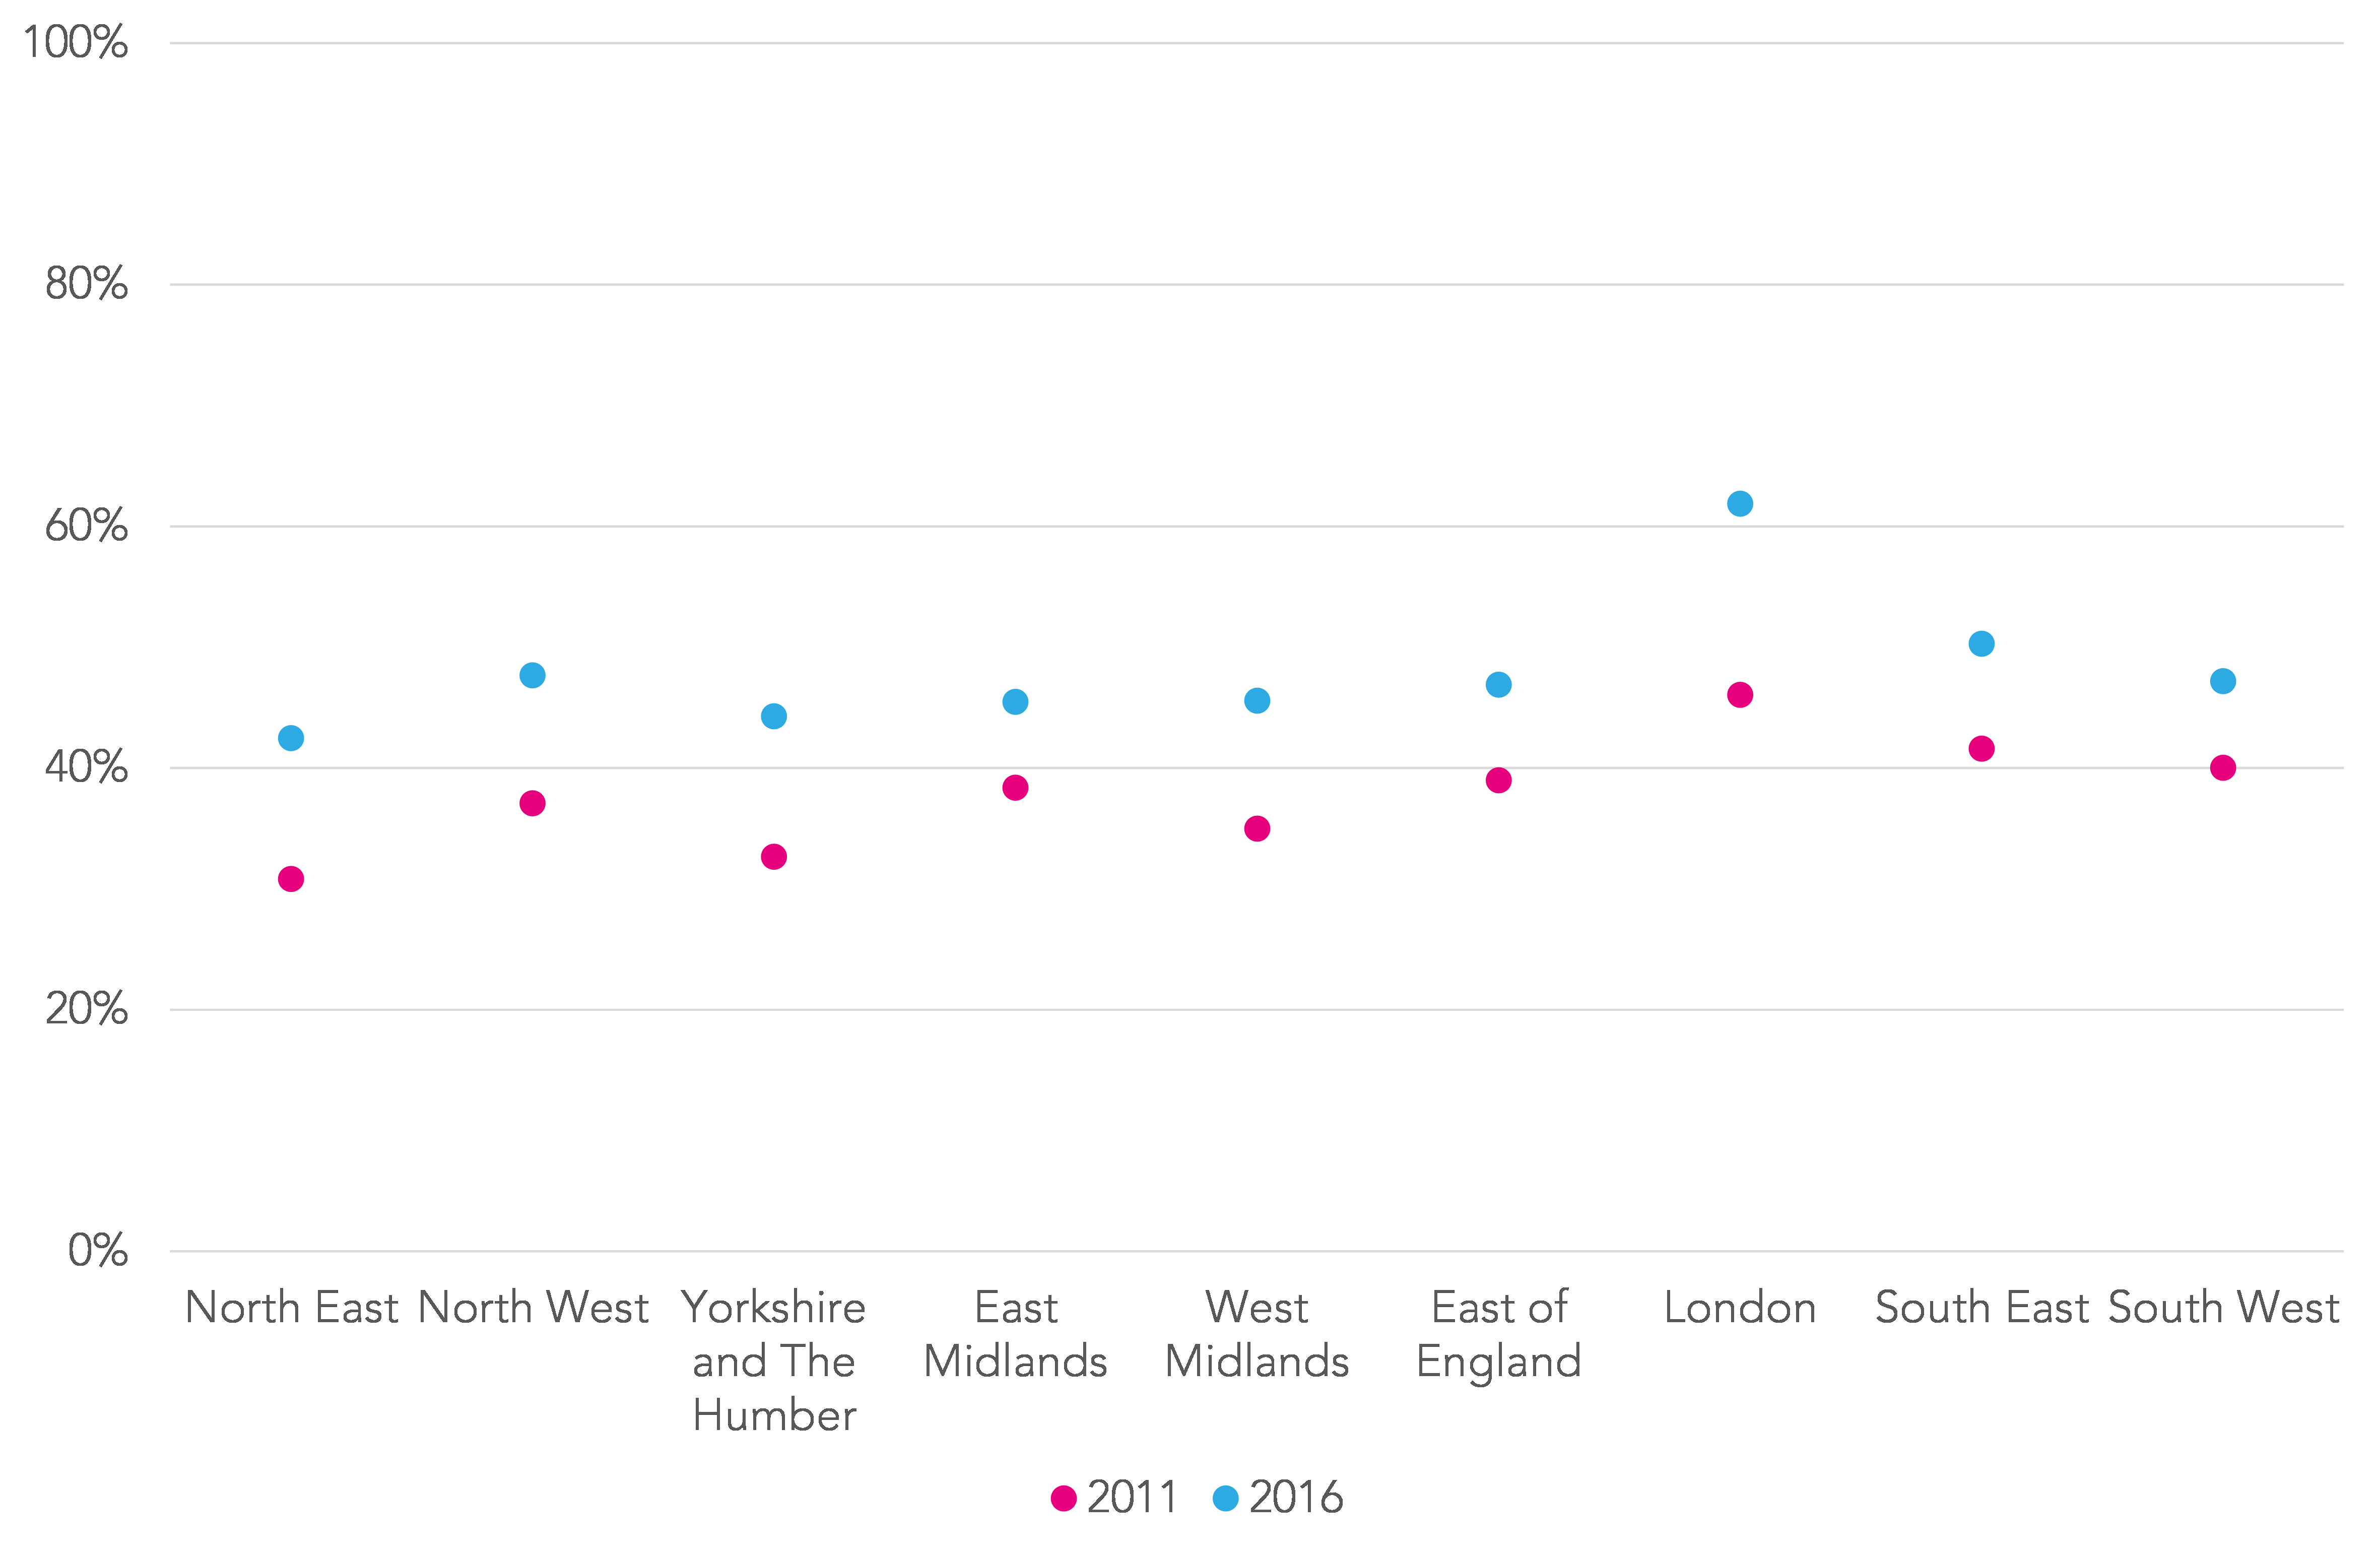
However, the overall EBacc entry rate has stalled because there has been little increase in entries in languages. Although there was an improvement from 39 per cent in 2011 to 50 per cent in 2014, since then the entry rate has fallen slightly to 49 per cent.
London continues to lead the way with an entry rate of 62 per cent. However, some of this apparent advantage is likely due to London having greater numbers of children who speak a different language at home who have taken GCSEs in these subjects.
In 2011, for example, 46 per cent of pupils in London entered the languages component of the EBacc. Looking just at French, German, Spanish, Latin or classical Greek, though, this figure falls to 40 per cent – the same as the south-east and just fractionally higher than the south-west.
EBacc language entry rates by region
Progress 8 is driving curriculum change more than the EBacc is
We have written previously about the difficulties of achieving 90 per cent EBacc take-up. We estimate that we would need over 3,000 extra language teachers to meet this requirement. Schools cannot deliver it on their own, even if they wanted to.
So far, then, the EBacc has not been an entirely effective driver of curriculum change in schools.
In contrast Progress 8, which will be used in the definition of floor standards this year, has been. On average, today’s figures show pupils filled 2.7 of a maximum three EBacc ‘slots’ counted in the Attainment 8 measure this year – according to our calculations, an increase of 0.4 since 2014.
Want to stay up-to-date with the latest research from Education Datalab? Follow Education Datalab on Twitter to get all of Datalab’s research as it comes out.
1. English, maths, two sciences, a humanity and a language.


Very interesting analysis. Thank you.
We know that students are moving from BTEC science to gcse core/additional science in significant numbers. That means that the vast majority of students will be filling 2 of the necessary 3 EBacc slots from science alone.
If a school has a ‘we will fill all the buckets for all students’ type policy then it leaves students (or schools) having to pick a 3rd subject from MFL, Geog, hits or computer science (or going for separate sciences over core/additional).
We have seen entries in Geog and history rise which probably is based on the type of policy described yet little rise in MFL entries. That could be because languages are ‘marmite’ subjects which students either love (and already take) or hate (and would pick almost anything else instead).
Equally it could be that languages are viewed as subjects that are ‘harder’ and there is a body of evidence that suggests that language gcses are graded 1/4 or more grades harsher than the average of gcses.
Progress 8 will never result in significant additional entries if this latter reason is the main issue. It is neither in student, nor schools, interests to push students towards subjects/qualifications that suffer harsher grading.