This is part two in a series of posts exploring trends in attainment over time by month of birth. Other posts in the series can be found here.
In the first part in this series we looked at how attainment at age seven – Key Stage 1 – varied with pupils’ month of birth. Overall, we found that:
- September-born pupils (the oldest in a year group) have consistently higher attainment than August-born pupils;
- the biggest difference is at higher levels of attainment (Level 3 or higher);
- the ‘gap’ at Level 2+ and Level 2b+ has reduced over time – but this is not the case for Level 3+.
But what sort of month of birth gaps exist under the Foundation Stage Profile? (FSP data is collected at the end of Reception – two years earlier than KS1.)
Analysing this data over time presents some difficulties because of changes introduced in 2012/13. Although there is, in theory, one indicator that could be used – the percentage of pupils reaching a ‘good standard of development’ – it’s clear that the change introduced an inconsistency, as the chart below shows.
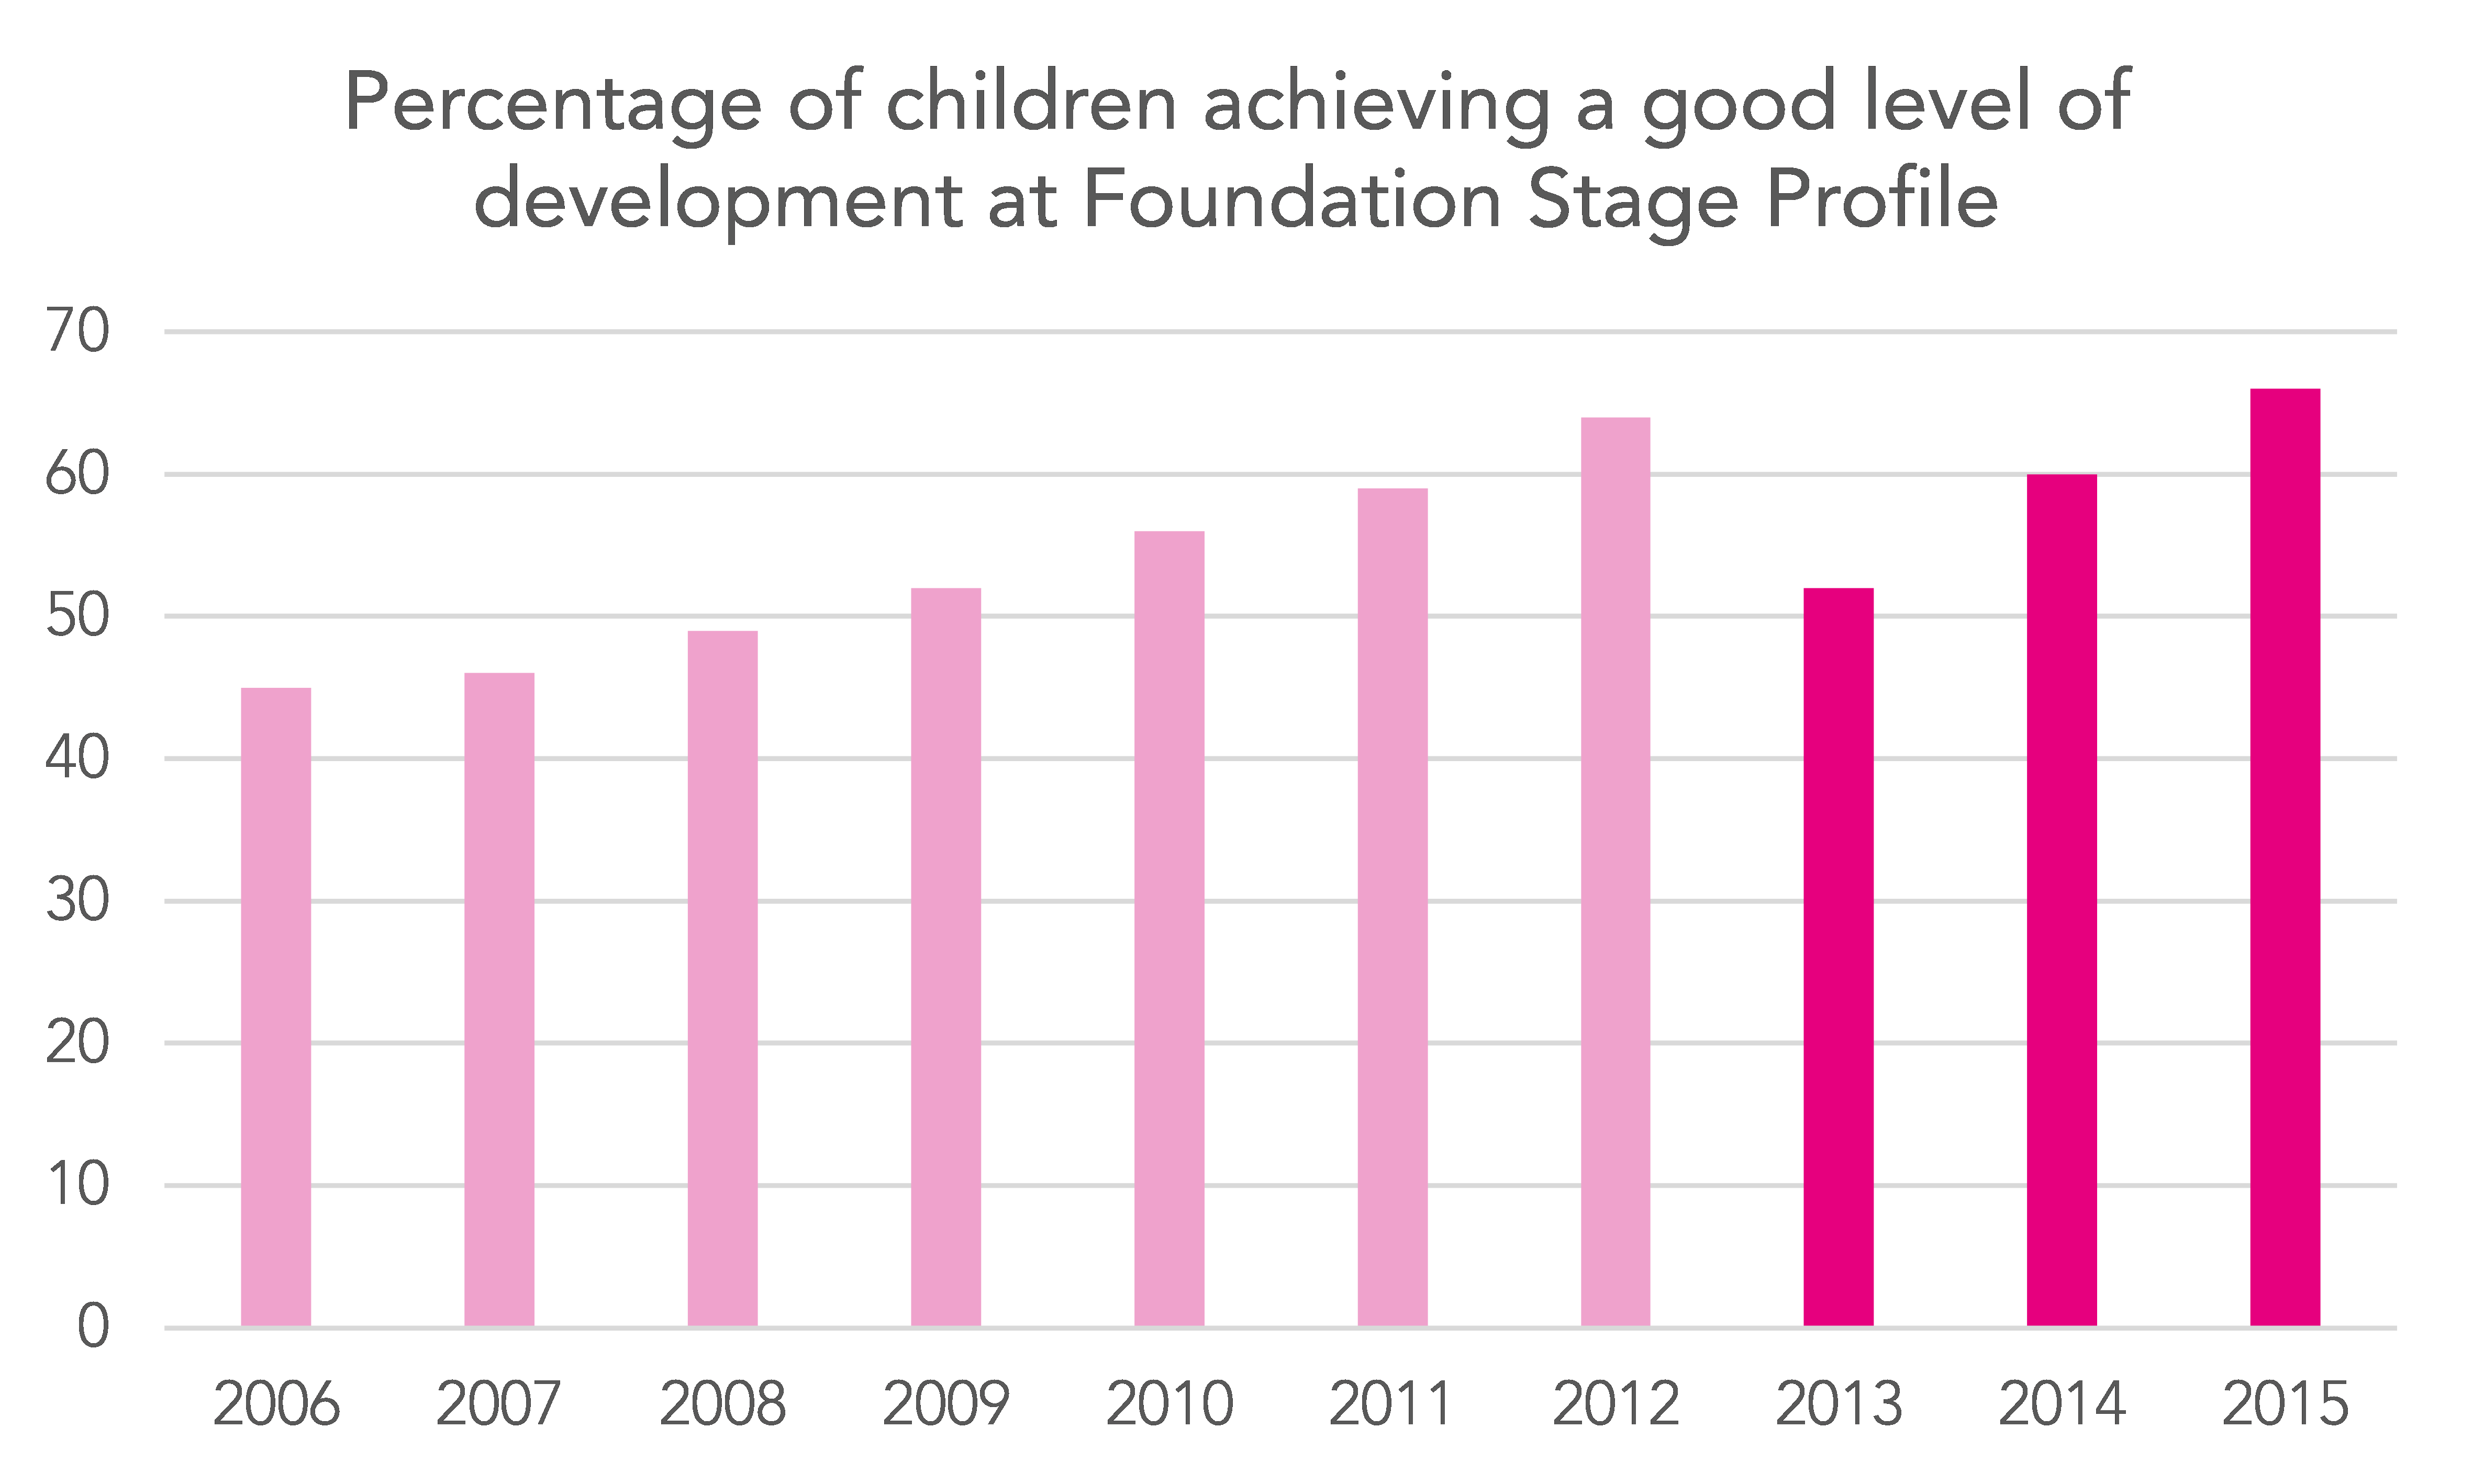
Also, we know from looking at KS1 data that the month of birth gap varies by overall level of attainment – so looking at just one indicator (good level of development) is not sufficient.
Instead, we can use the underlying FSP score[1] and set break points to generate outcomes consistent with Levels 2, 2b and 3 at KS1 in terms of the percentage of pupils with that mark or higher.
For example: an FSP total score of 76 (pre-2012/13) or 25 (2012/13 onwards) generates outcomes where the percentage of pupils with this score or higher is broadly consistent with the percentage of pupils attaining Level 2b at KS2. For the rest of this post we’ll refer to this level of attainment as ‘FSP2b’, and so on[2].
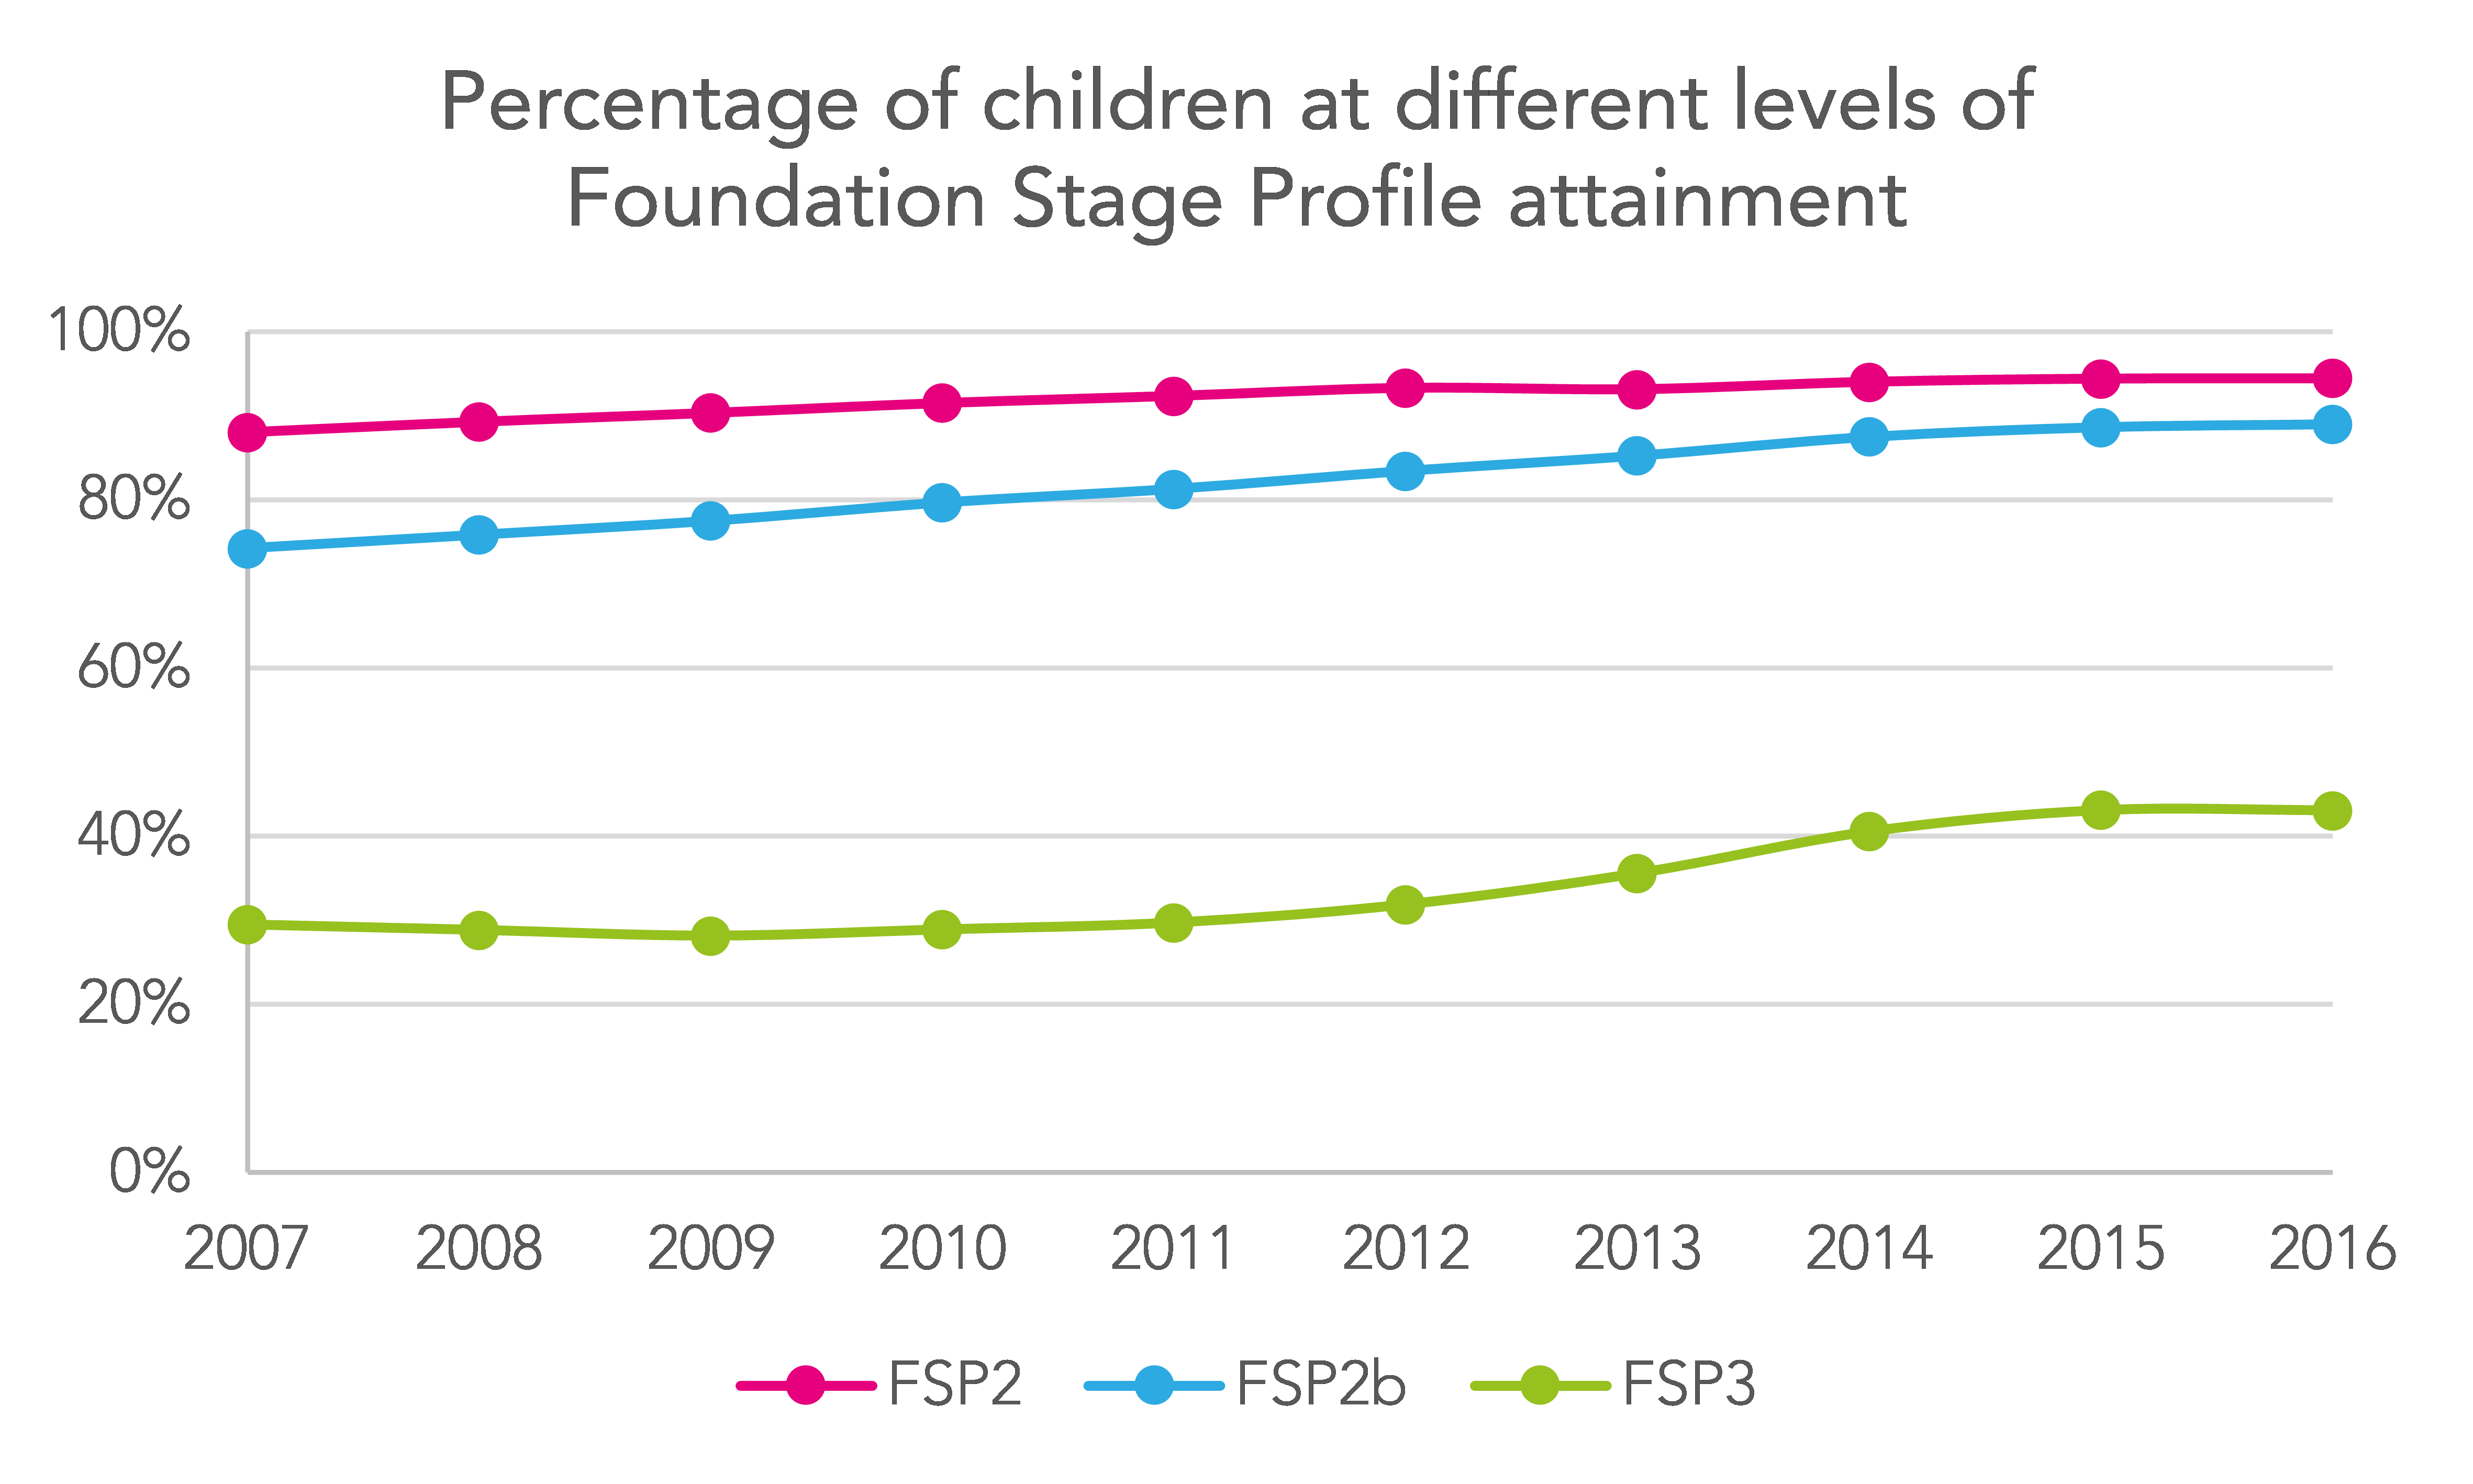
The chart below shows the trend at FSP over time.
And using these indicators to examine differences by month of birth reveals the picture shown in the chart below in 2008.
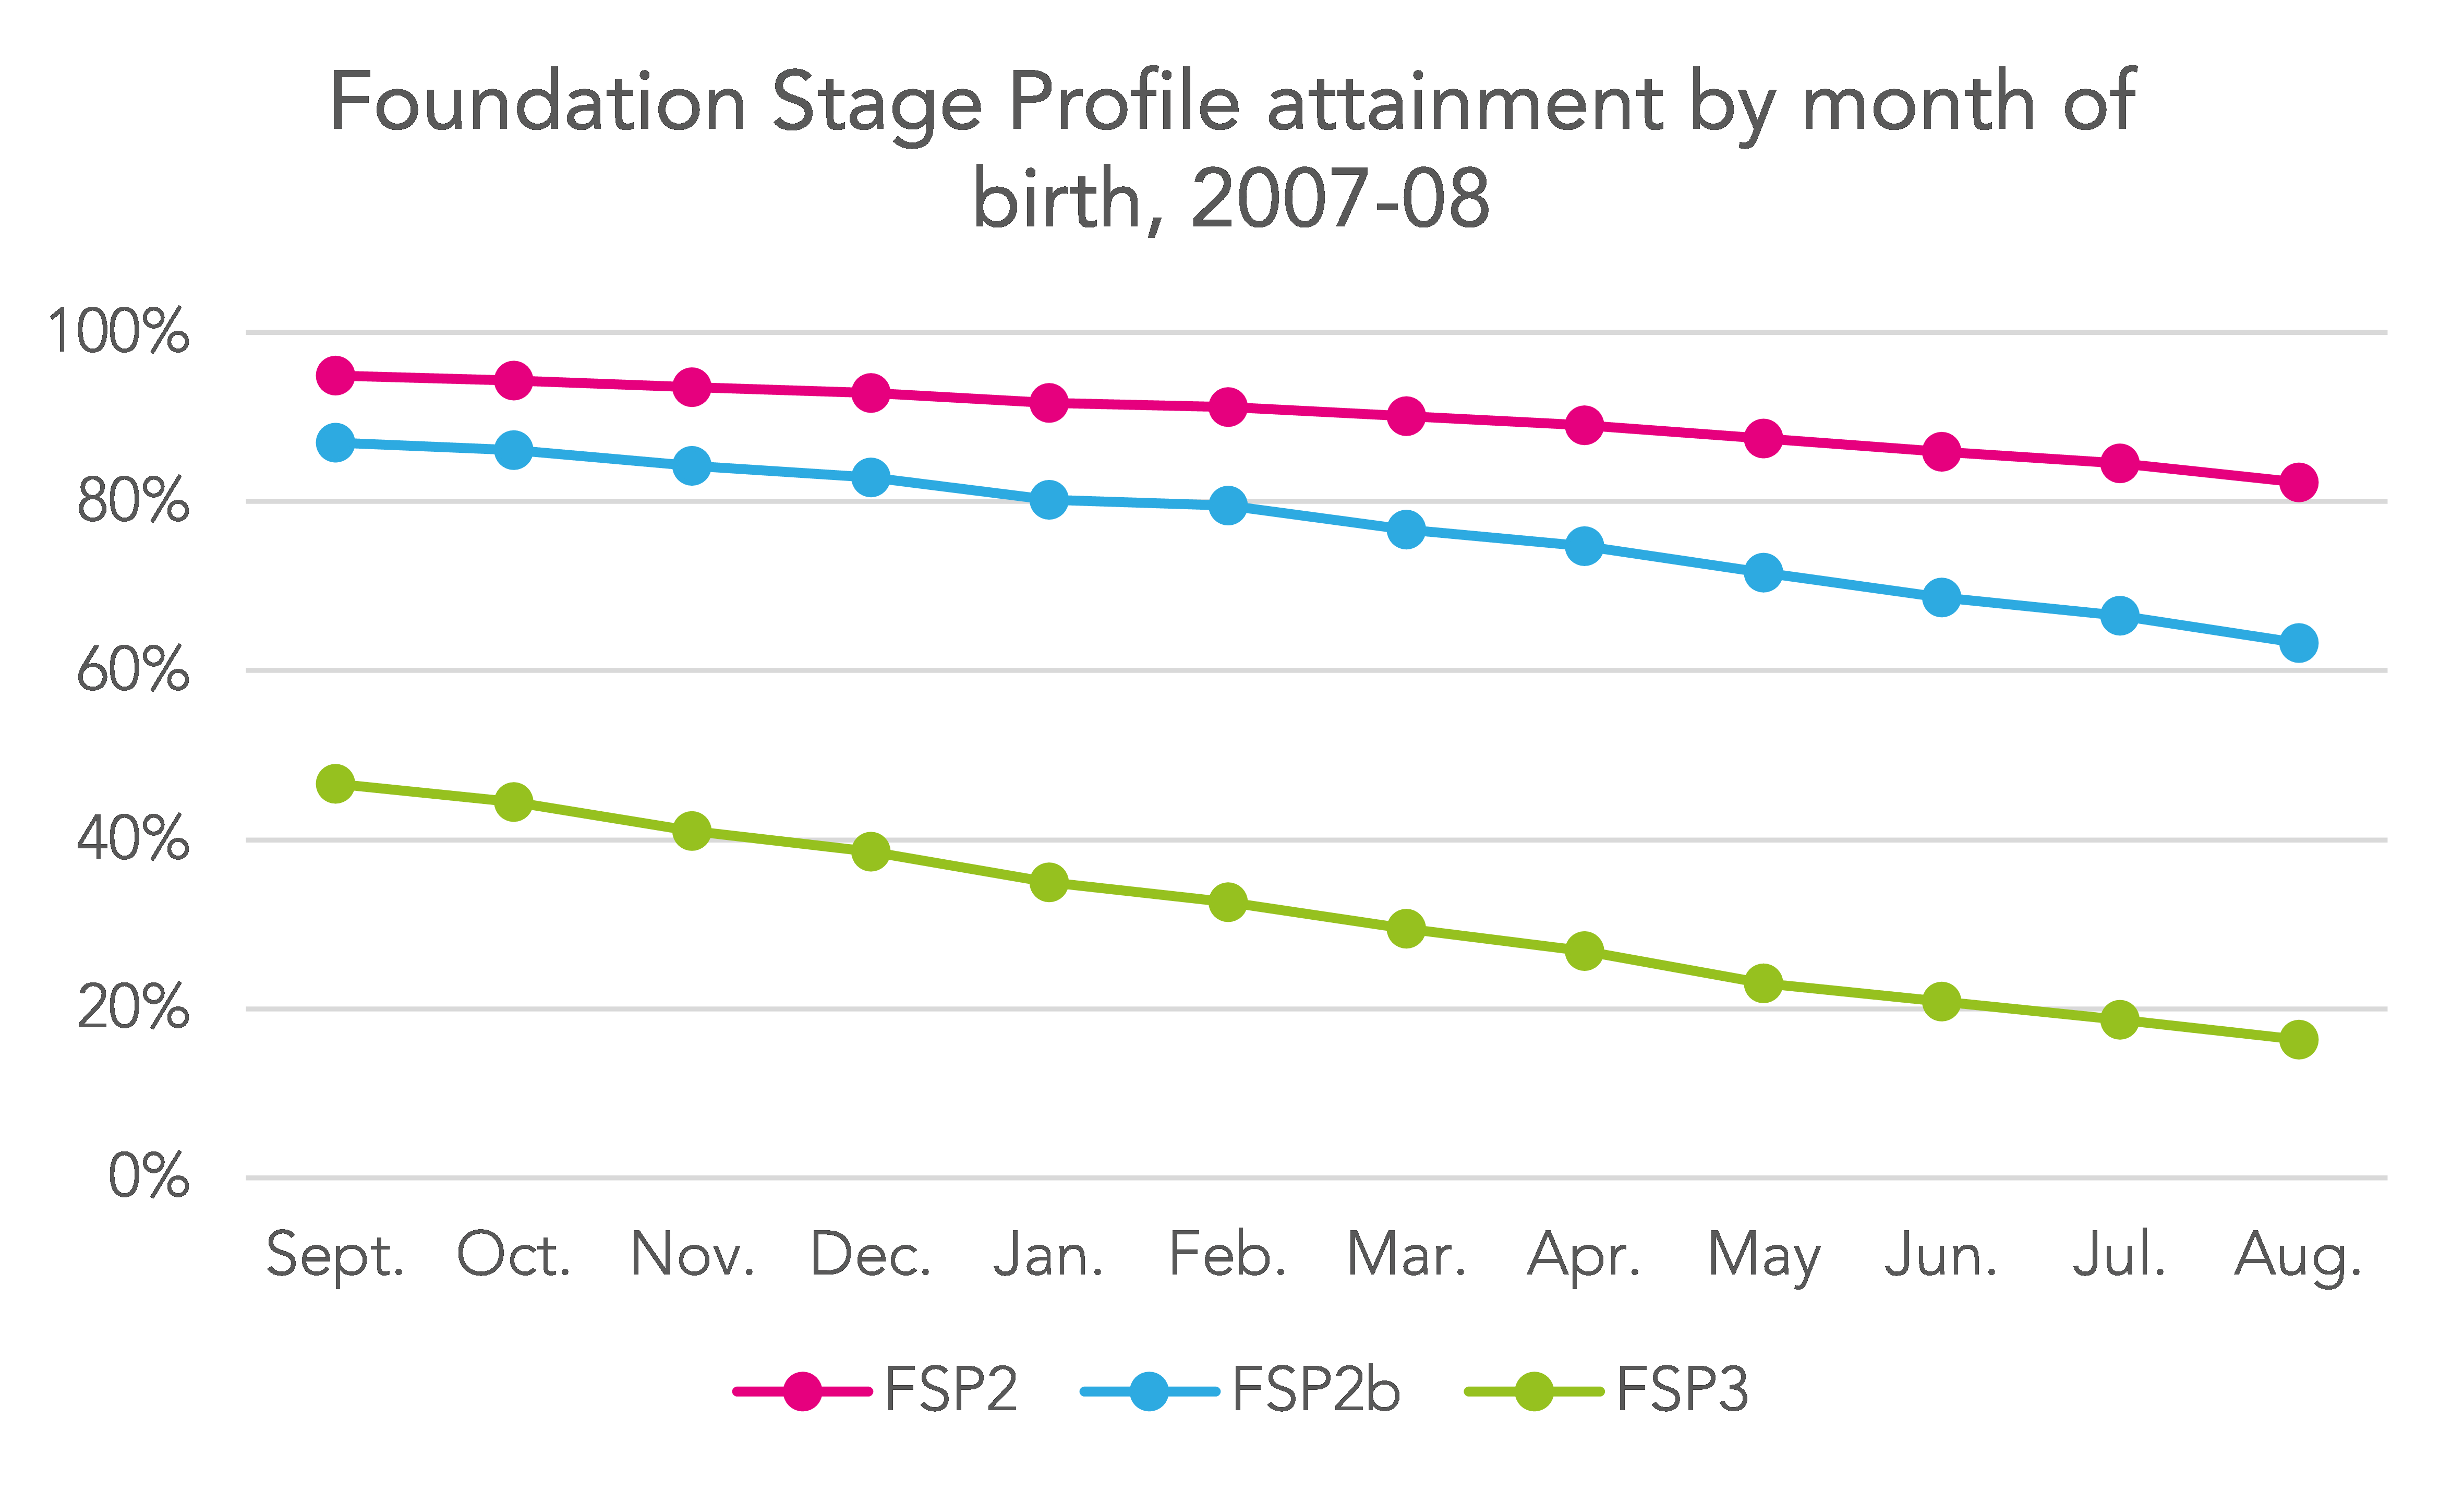
On average, when August-born pupils are compared to September-born pupils, we find in 2008 that:
- 13% fewer attain FSP2
- 26% fewer attain FSP2b
- 34% fewer attain FSP3
But has the gap in FSP attainment changed over time?
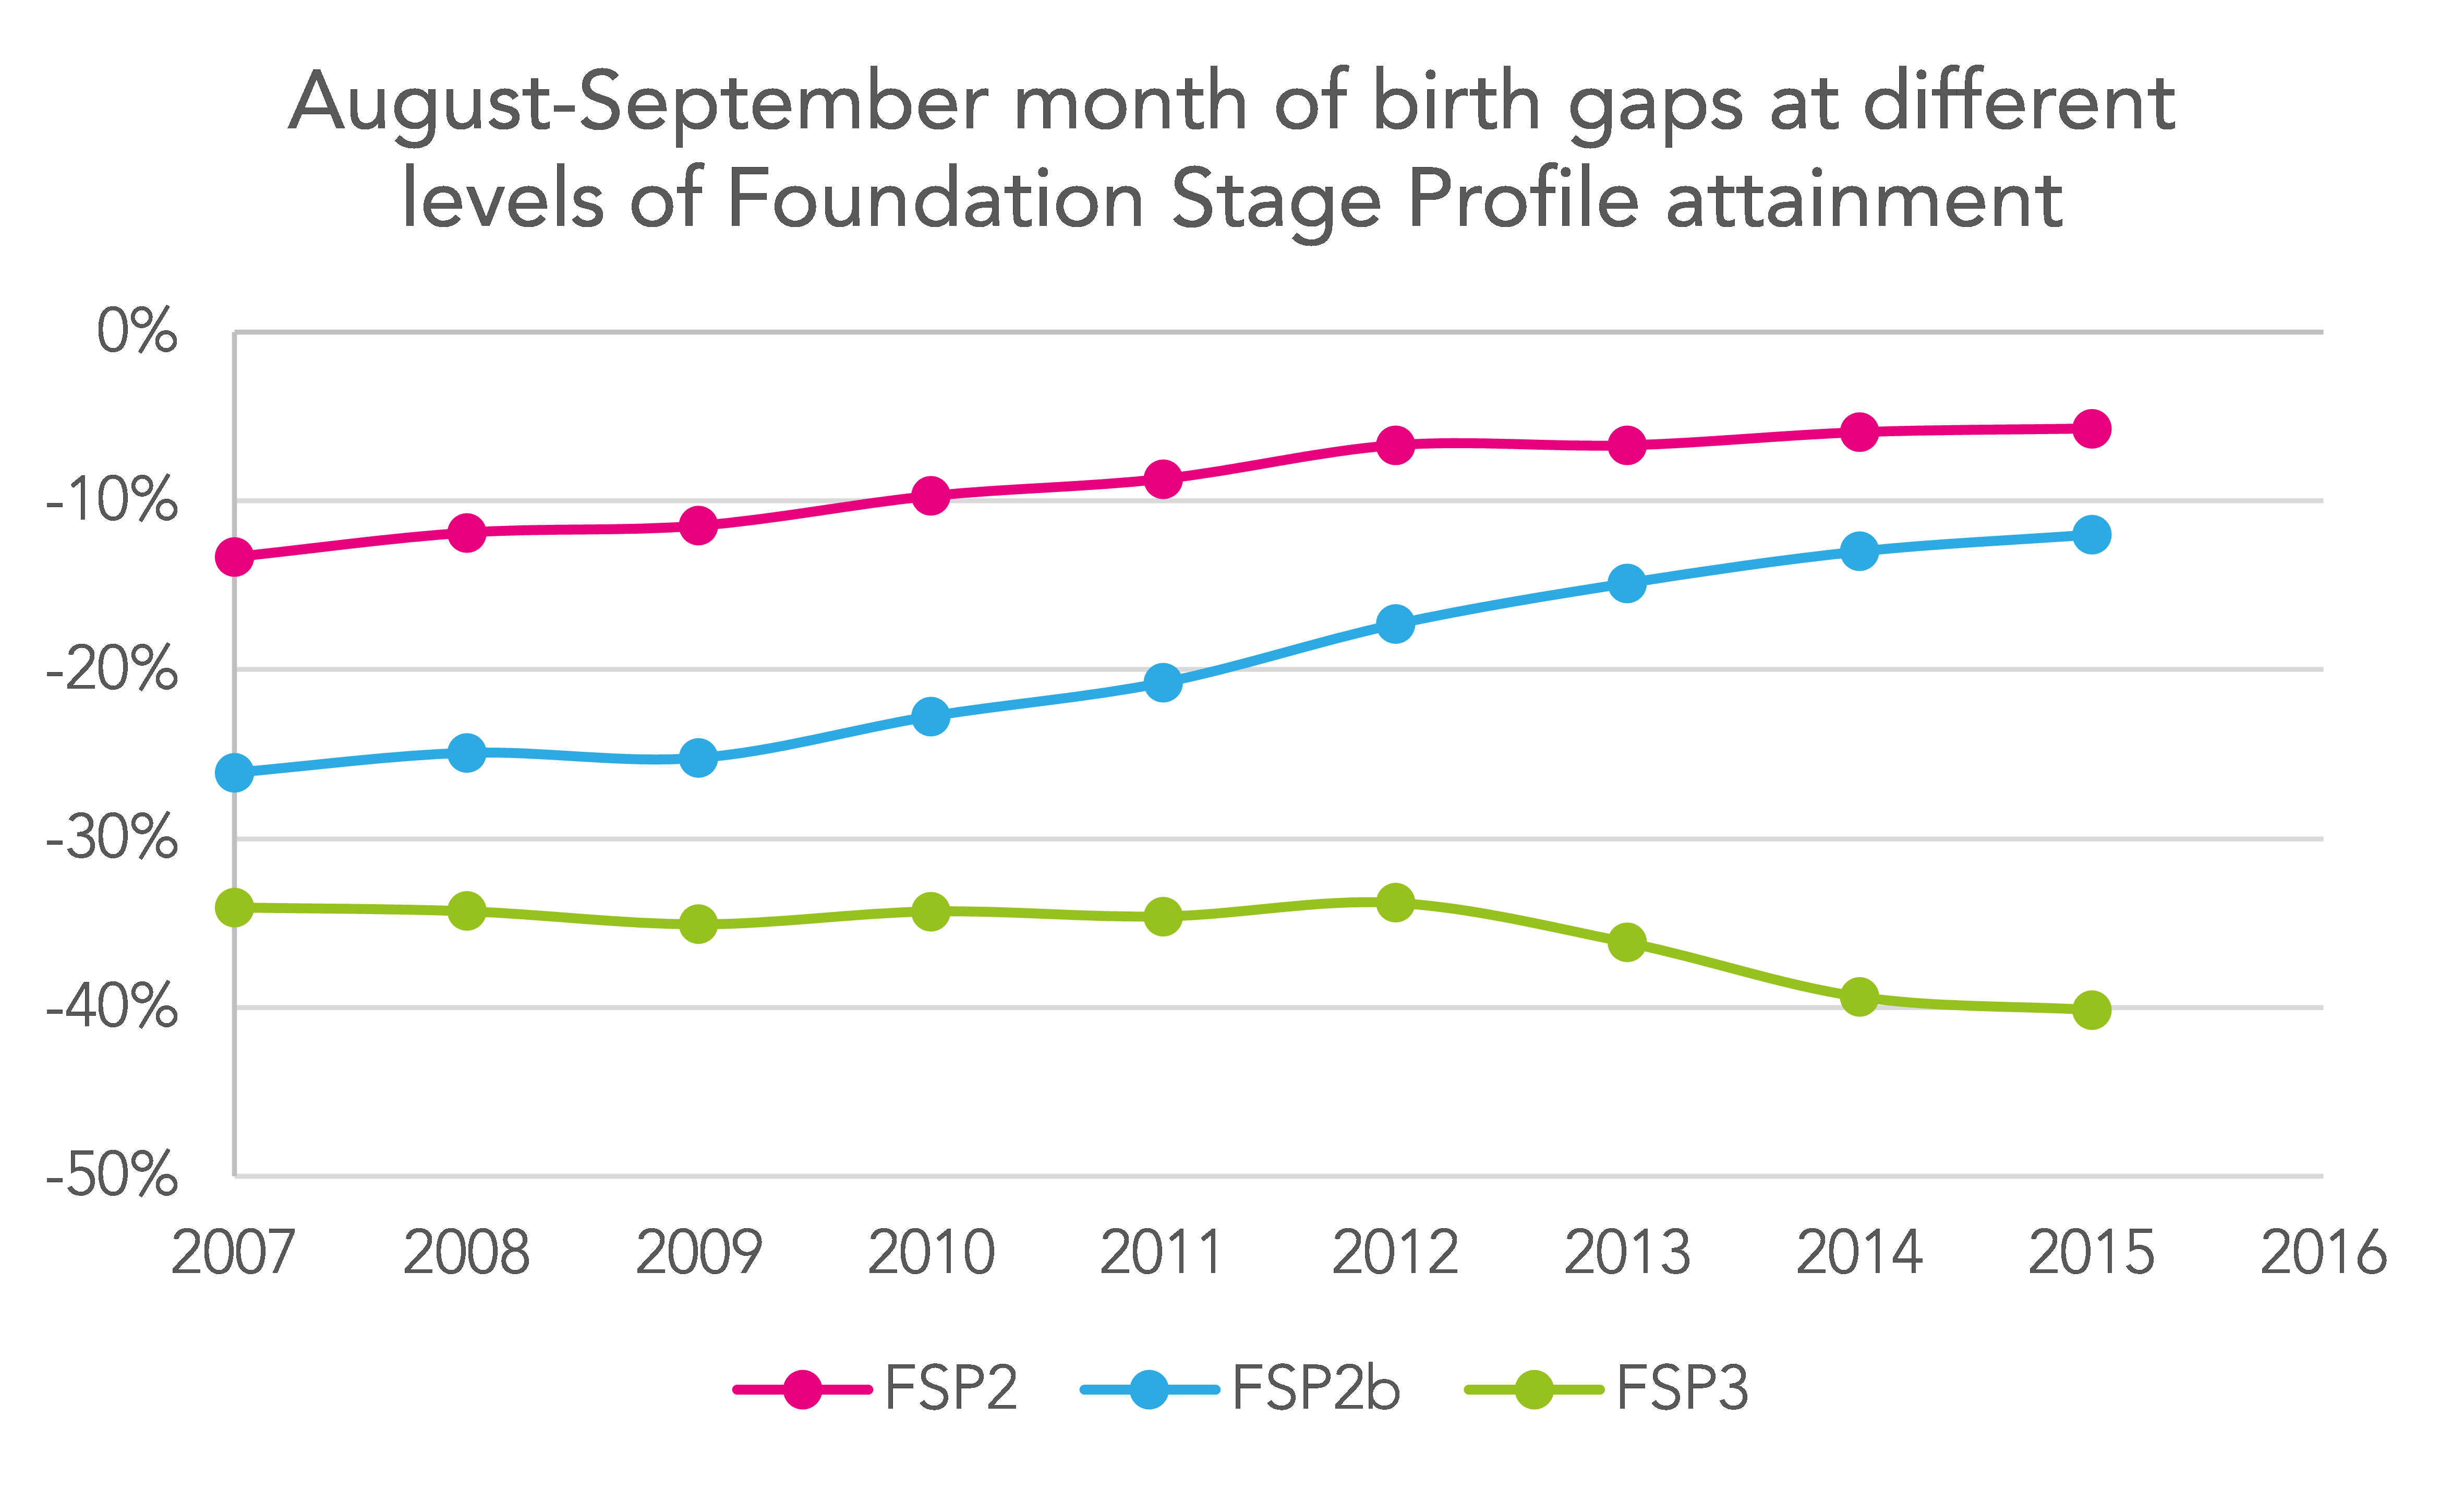
The chart below shows the August-September gap, and shows a strikingly similar pattern to trends at KS1. I.e.:
- the gap for FSP2 and FSP2b displays substantial reduction over time;
- the FSP3 gap is stable, then widens.
And we can go further and track the same cohort of pupils from FSP to Key Stage 1 and, for three years, on to Key Stage 2. For example, pupils who were at FSP in 2007 have KS1 data in 2009, and KS2 data in 2013.
This allows us to see how persistent month of birth gaps are – shown in the chart below[3].

The trends in this chart are intriguing. It looks like:
- the gap at age five (FSP) shows substantial and fairly consistent reduction;
- the gap at age seven (KS1) is also reducing, but at a lower rate – with the consequence that difference in the size of the month of birth gap that exists at FSP and at KS1 is no longer reducing;
- the gap at KS2 is not changing.
It’s probably too early to draw any conclusions about KS2 – although it is worth noting that, for the 2011 FSP cohort:
- the August-September month of birth gap at FSP was 5% smaller than that seen in 2008;
- the gap at KS1 for the same cohort showed only a 2% reduction;
- the gap at KS2 did not show any reduction.
Is this a consistent pattern – gains made in early years not seen in subsequent years – or are other factors at play?
In part three of this series we will explore this further, and also see if there are any differences associated with first language and socio-economic disadvantage.
Want to stay up-to-date with the latest research from Education Datalab? Sign up to our mailing list to get notifications about new blogposts, or to receive our half-termly newsletter.
1. Total score across all elements.
2. Break points are as follows (pre-2012/13 and 2013 onwards):
FSP2 63/20
FSP2b 76/25
FSP3 98/35
3. KS1 data for 2016 has not been included because we do not have directly comparable data – in 2016 the percentage of pupils reaching the expected standard in reading was around 8% lower than the percentage attaining Level 2b+ in 2015. At KS2, data based on calculations using scaled scores is included.


Leave A Comment