Although previous governments used the machinery of performance tables and school accountability to drive improvements in the education system, the Coalition government of 2010 was the first to use it to influence the qualifications that pupils entered at age 16.
But for all the rhetoric about the damaging effects on curriculum offer of the English Baccalaureate (EBacc), it has not really caught on in schools.
As the chart below shows, the percentage of pupils entered for all five components of the EBacc – English, maths, science, humanities, and modern and ancient foreign languages – has stalled at around 40% over the last few years. (We do not show English and maths, as nearly all pupils are entered).

Nonetheless, the percentage of pupils entered for the science and humanities components of the EBacc have increased since 2011, with the introduction of Progress 8 in 2016 leading to a relatively large increase compared to previous years. However, there was no such increase in languages in 2016 or in any other year since 2013.
We’ve written before that the EBacc itself is not driving behaviour – we would need more teachers of languages for it to do so. Rather, it is the wider reforms to performance tables introduced in 2014 following the Wolf Review of 2011, and Progress 8, introduced in 2016, that are.
Perhaps as a result, in its recent consultation response the government lowered its initial target of 90% of pupils being entered for the EBacc by 2020 to 75% studying it by 2022, a subtle distinction covered by Schools Week.
The government also announced its intention to publish an EBacc points score measure, perhaps as another lever to encourage behaviour. At present the percentage of pupils entered for the EBacc is published, along with the percentage achieving A*-C grades in all six component slots (there are two slots for science). But this achievement measure only incentivises attainment at the grade C borderline.
There are at least three different options for an EBacc average points score (APS) measure, all of which have their issues. Such an APS measure could be:
- Based only on pupils entered for all six slots of the EBacc
- Based on all pupils, but only counting filled slots (so a pupil with three filled slots would be equivalent to 50% of a pupil with six filled slots)
- Based on all pupils, and counting all six slots for every pupil (in effect assigning zero points to each unfilled slot)
Number one offers little in the way of incentive for schools to enter more pupils for all six slots of the EBacc (or more accurately enter more for a language), so would have to be interpreted alongside the EBacc entry measure.
Number three, meanwhile, would be more a measure of entries than attainment, to begin with at least. Number two is a halfway house.
On Monday, DfE announced that it would be adopting method three (the details are given in a footnote on the first sheet of the Excel document).
We calculated the three measures for each state-funded mainstream school using 2016 data with A*-G graded GCSEs. When the measure is introduced in 2018, EBacc GCSEs will be graded 9-1. Nonetheless, the same sorts of issues will emerge.
The table below shows the 2016 national averages for the three methods. Ignoring the switch to 9-1 grades, the average for method one – under which only pupils with a full five slots count – would doubtless decline if more pupils entered the EBacc. By contrast number three – under which empty slots count as zeros – would improve with more entries.
EBacc points national averages under three different approaches[1]
| Method one | 5.9 |
| Method two | 5.2 |
| Method three | 4.3 |
However, number three is heavily correlated (r=0.94) with the current EBacc attainment measure based on A*-C grades (see chart below). It is also heavily correlated (r=0.82) with the percentage of pupils entered for the EBacc.

In fact, method 3 also correlates very highly (r=0.96) at school level with another published indicator: Attainment 8.
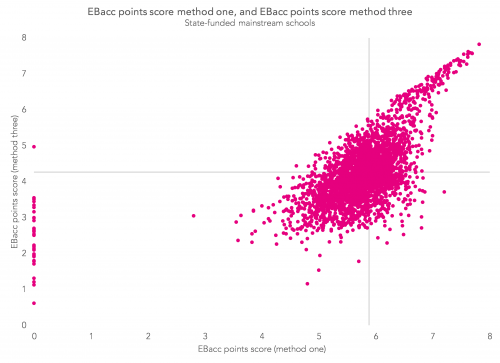
For high-attaining schools, methods one and three produce broadly similar results. However, for other schools there are some wide variations, with some schools changing by more than four points. Note that there were 39 schools at which no pupils were entered for all five components of the EBacc in 2016 and so would not have an EBacc APS under method one.

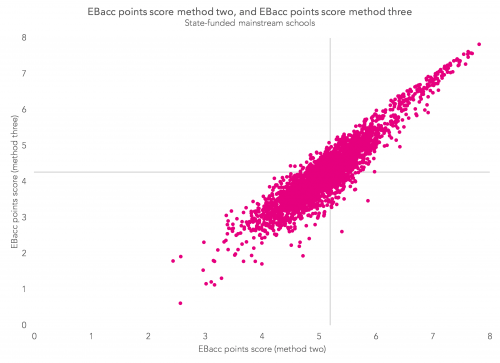
Methods two and three produce largely similar results, although with some quite marked differences for a small number of schools.

Cynics might suppose that method three has been adopted because the national average is bound to improve. But whichever version is chosen, like all measures of attainment it would be biased against schools with disadvantaged intakes and in favour of those with high attaining intakes.
We also wonder where this leaves Attainment 8. The EBacc APS might as well be called Attainment 6.
Want to stay up-to-date with the latest research from Education Datalab? Sign up to our mailing list to get notifications about new blogposts, or to receive our half-termly newsletter.
1. In 2016, GCSE points still followed a scale that increased uniformly from 1 for a G to 8 for an A* [PDF].


Leave A Comment