The 2017 GCSE English and maths papers were graded on the new nine-point scale (9-1) rather than the old eight-point scale (A*-G). The content and structure of the English and maths GCSEs have also been reformed at the same time. The rest of the GCSEs will follow suit over the next few years.
The new grading scale has been introduced for two reasons. The first is to signal the move to the new qualifications. This is achieved by the switch from letter to numbers. The second is to differentiate more clearly between the ability of the students that take the exam. This is achieved by moving from an eight-point to a nine-point scale, increasing the number of grades that cover the former A*-C range whilst compressing the former D-G range into three grades.
There is no official pass grade for GCSEs. Technically, a pupil is awarded a GCSE for any paper which receives a grade. However, since school performance tables were first published in 1992, the use of the headline five A*-C GCSEs metric has made C the unofficial pass grade. This perception was reinforced when the 2010-15 government introduced a new “floor standard” based on this metric.
So what is a pass on the new 9-1 scale? The Secretary of State says that she expects employers and colleges who previously required a C or above for entry into jobs or course will now require a 4 or above. This has been dubbed a “standard pass”. For the purposes of developing headline performance metrics however, Greening announced that 5 or above will be considered the relevant threshold. This has been dubbed a “strong pass”.
FFT Aspire
If you are a school using FFT Aspire, why not check your results against estimates in Aspire?
Not an FFT Aspire user?
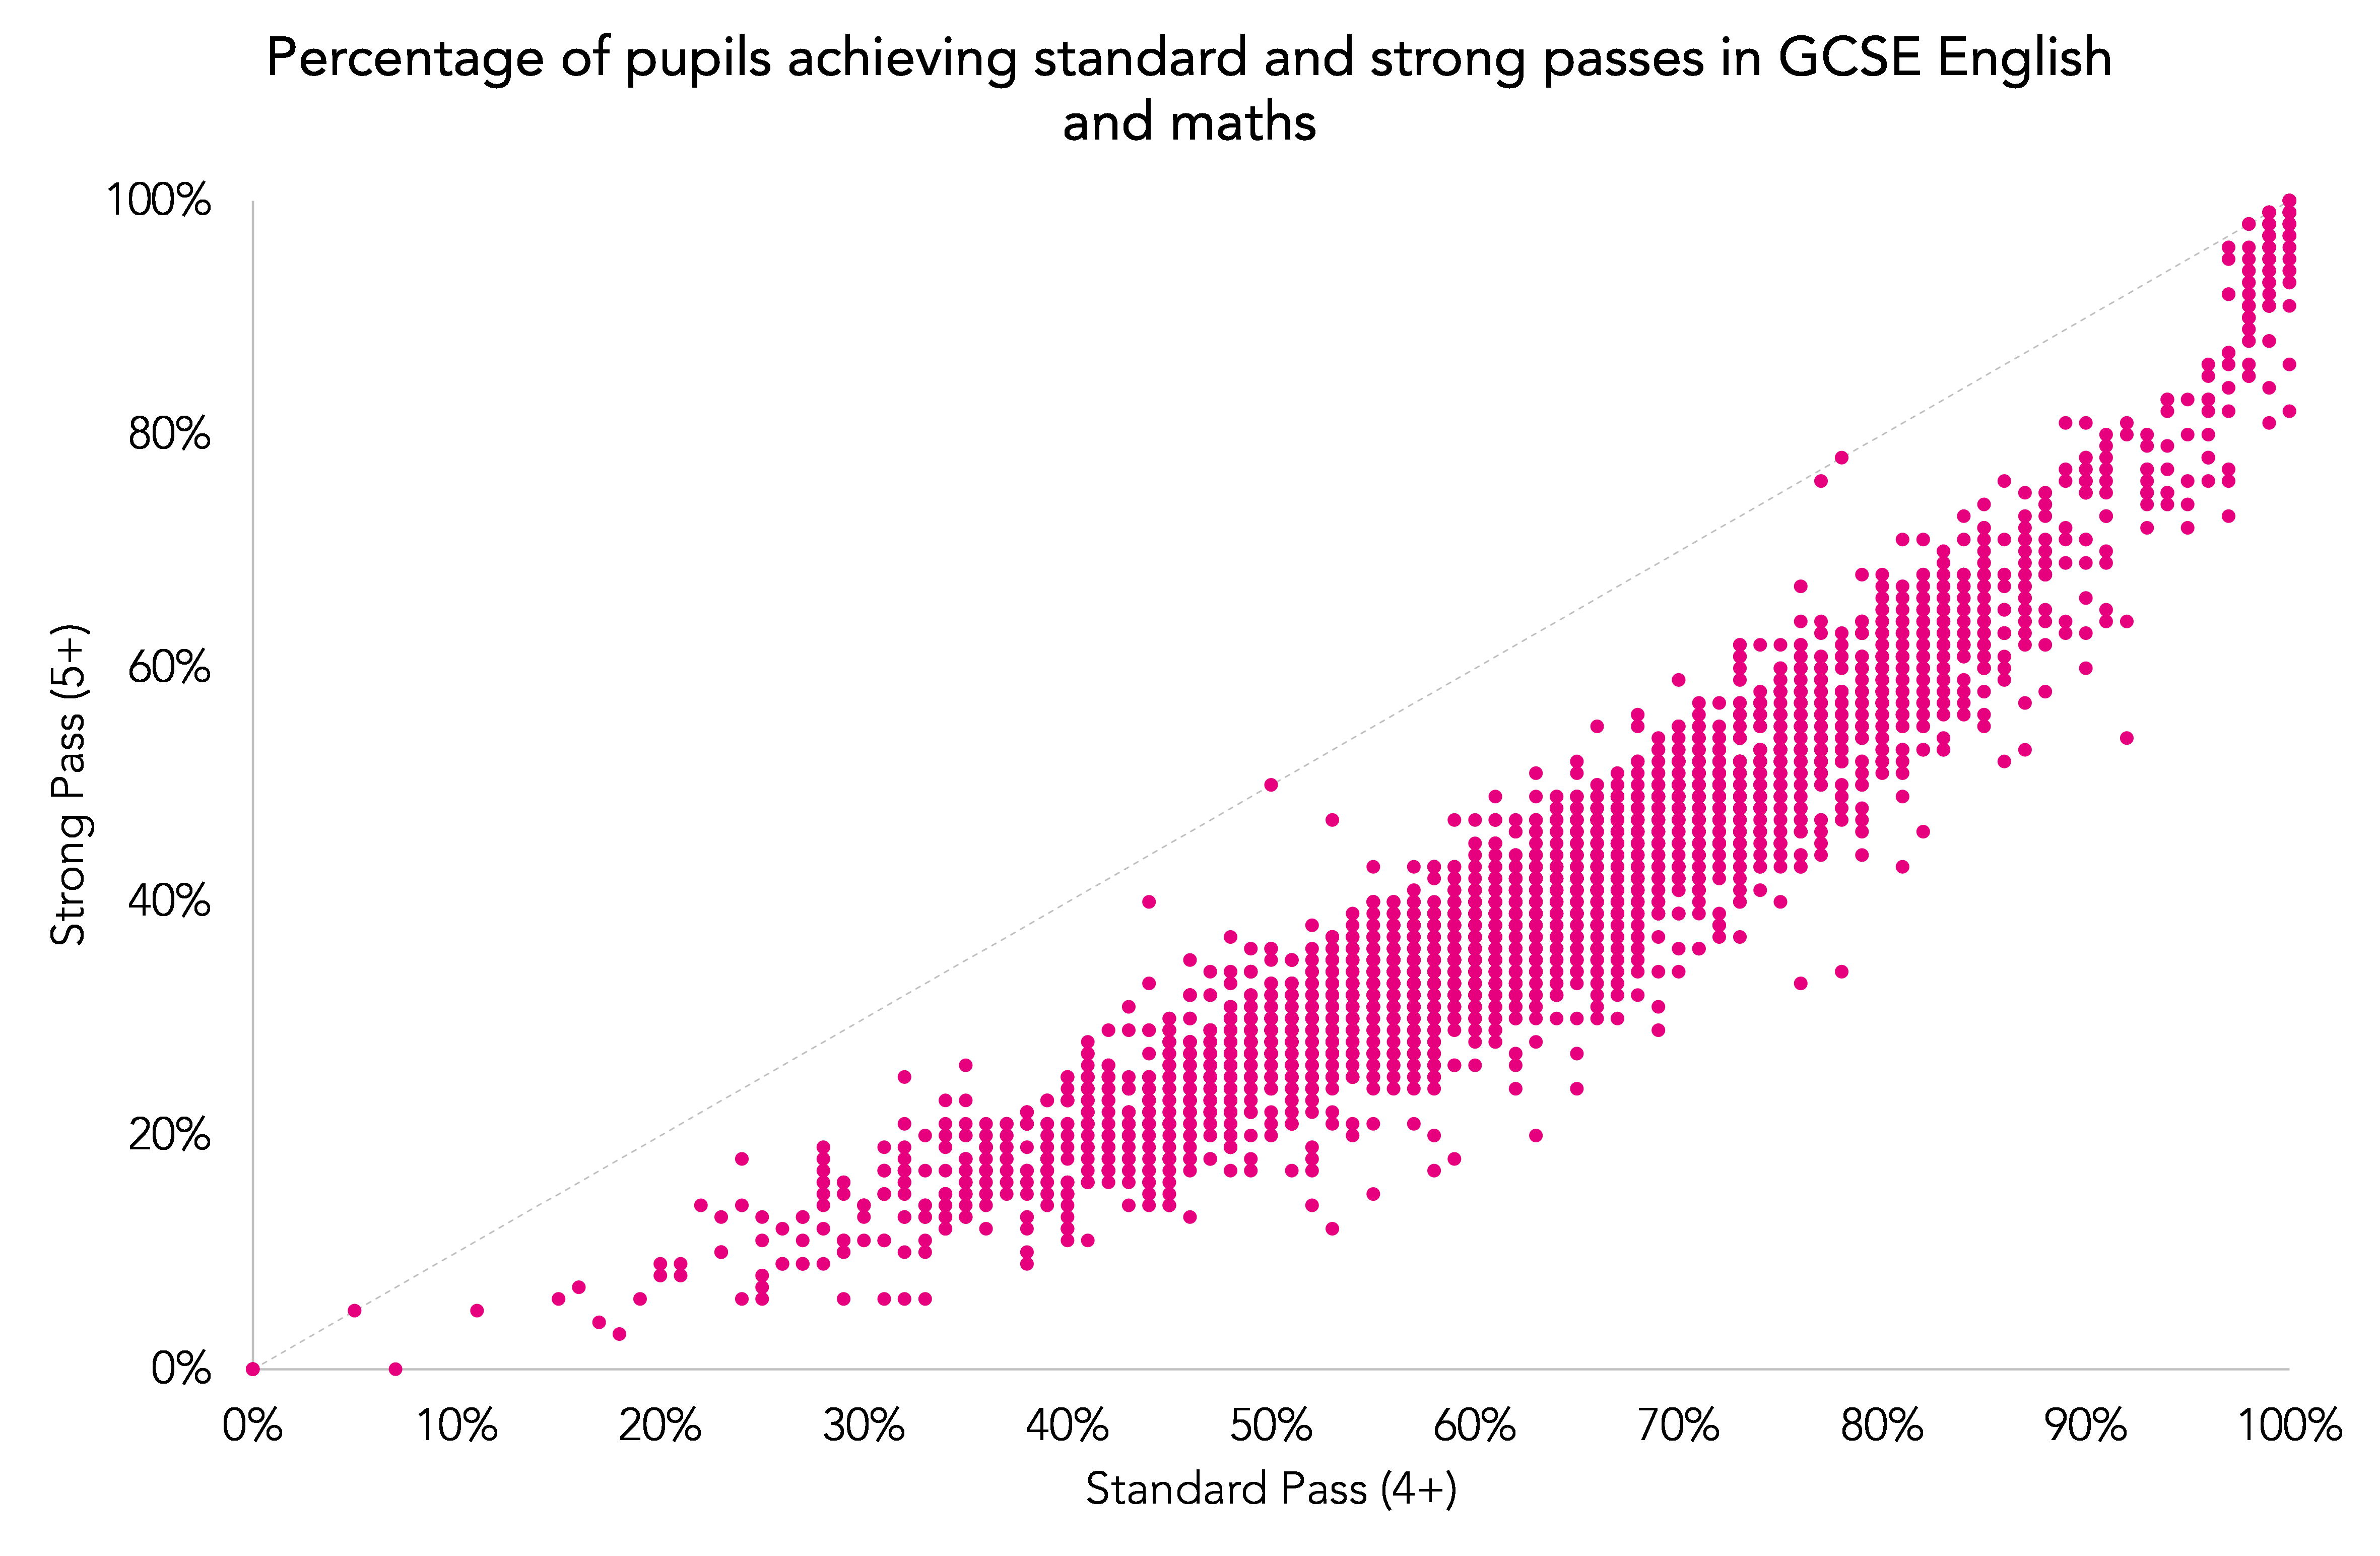
So schools are now being held to a higher standard of 5 rather than 4. We can use the English and maths results for this year to see what will do to pass rates. The first chart shows how schools compare in terms of the proportion of their pupils receiving either a standard pass (4+) or a strong pass (5+) in both English and maths in their 2017 results. Each dot represents a school and any schools below the diagonal line have a strong pass rate which is lower than their standard pass rate. The further they fall below the line, the bigger the difference.
Almost all schools are, inevitably, below the line. But what seems to have surprised some colleagues who have been in touch with us is that there are schools with similar standard pass rates but wildly different strong pass rates. The exceptions are a bunch of schools in the top right, many of which are grammar schools.
How big are these differences? The second chart arranges all schools by the size of the percentage point difference. At the bottom left of the chart are the schools, mostly grammars, who see only a small difference in their pass rates depending on the definition used. Around 9% of schools for whom results were released today will see their pass rate drop by less than 10%. Just under 84% of schools lie on the flatter middle part of the line, seeing somewhere between a 15 and 30 percentage point drop in their pass rate. Then, on the right hand side of the graph, are those schools who have seen a big difference (between 30 and 45 percentage points) in their pass rates. Around 8% of schools will see a drop of this size. On the far right of the graph is a school which has a 44 percentage point difference: 78% of pupils achieved a standard pass in English and maths but only 34% achieved a strong pass.

We had a dig around in the data to look at which types of schools will see the biggest changes, but there were few patterns. The big losers just seem to be the schools that happened to have a lot of pupils that were just about getting a C on the old scale, but are not getting a 5 on the new one.
Want to stay up-to-date with the latest research from Education Datalab? Sign up to our mailing list to get notifications about new blogposts, or to receive our half-termly newsletter.


Can you tell me what the provisional national average was for the basics 9-5 and 9-4?
Hi Nigel. 39.1% and 58.5% respectively for all schools and 42.2% and 63.3% respectively for state-funded schools. From Section 4 of https://www.gov.uk/government/uploads/system/uploads/attachment_data/file/653532/SFR57_2017.pdf.