The first free schools opened in September 2011, and as most secondary free schools opened with only a single year group of pupils we’re only now starting to get results for many of these schools.
A total of 49 mainstream free schools have results in this morning’s release of provisional 2017 Key Stage 4 results. (We’re thinking about plain, vanilla free schools here, setting aside studio schools and university technical colleges.)
So what can we say about how they’re faring as a group?
Health warning
First of all, some disclaimers.
We’re still talking about relatively small numbers of free schools – 49 this year, compared to 27 last year.
The first couple of cohorts which a free school enrols might be quite different to the population which the school is likely to serve longer-term.
It’s also not hard to think that running a school with only one or two year groups of pupils might be different to running a secondary schools with a full five year groups.
And the nature of what a free school is has also changed somewhat between the first couple of waves of approvals and later waves [PDF].
But, keeping these points in mind, what can we say from this morning’s results?
Distribution of results
The 49 free schools in today’s provisional data have an average Progress 8 score of 0.11, against 0 for all state-funded mainstream schools. Last year, the 27 free schools that featured in KS4 results had an average P8 score of -0.02.
The charts below show the spread of P8 scores this year for all mainstream schools, and for free schools.
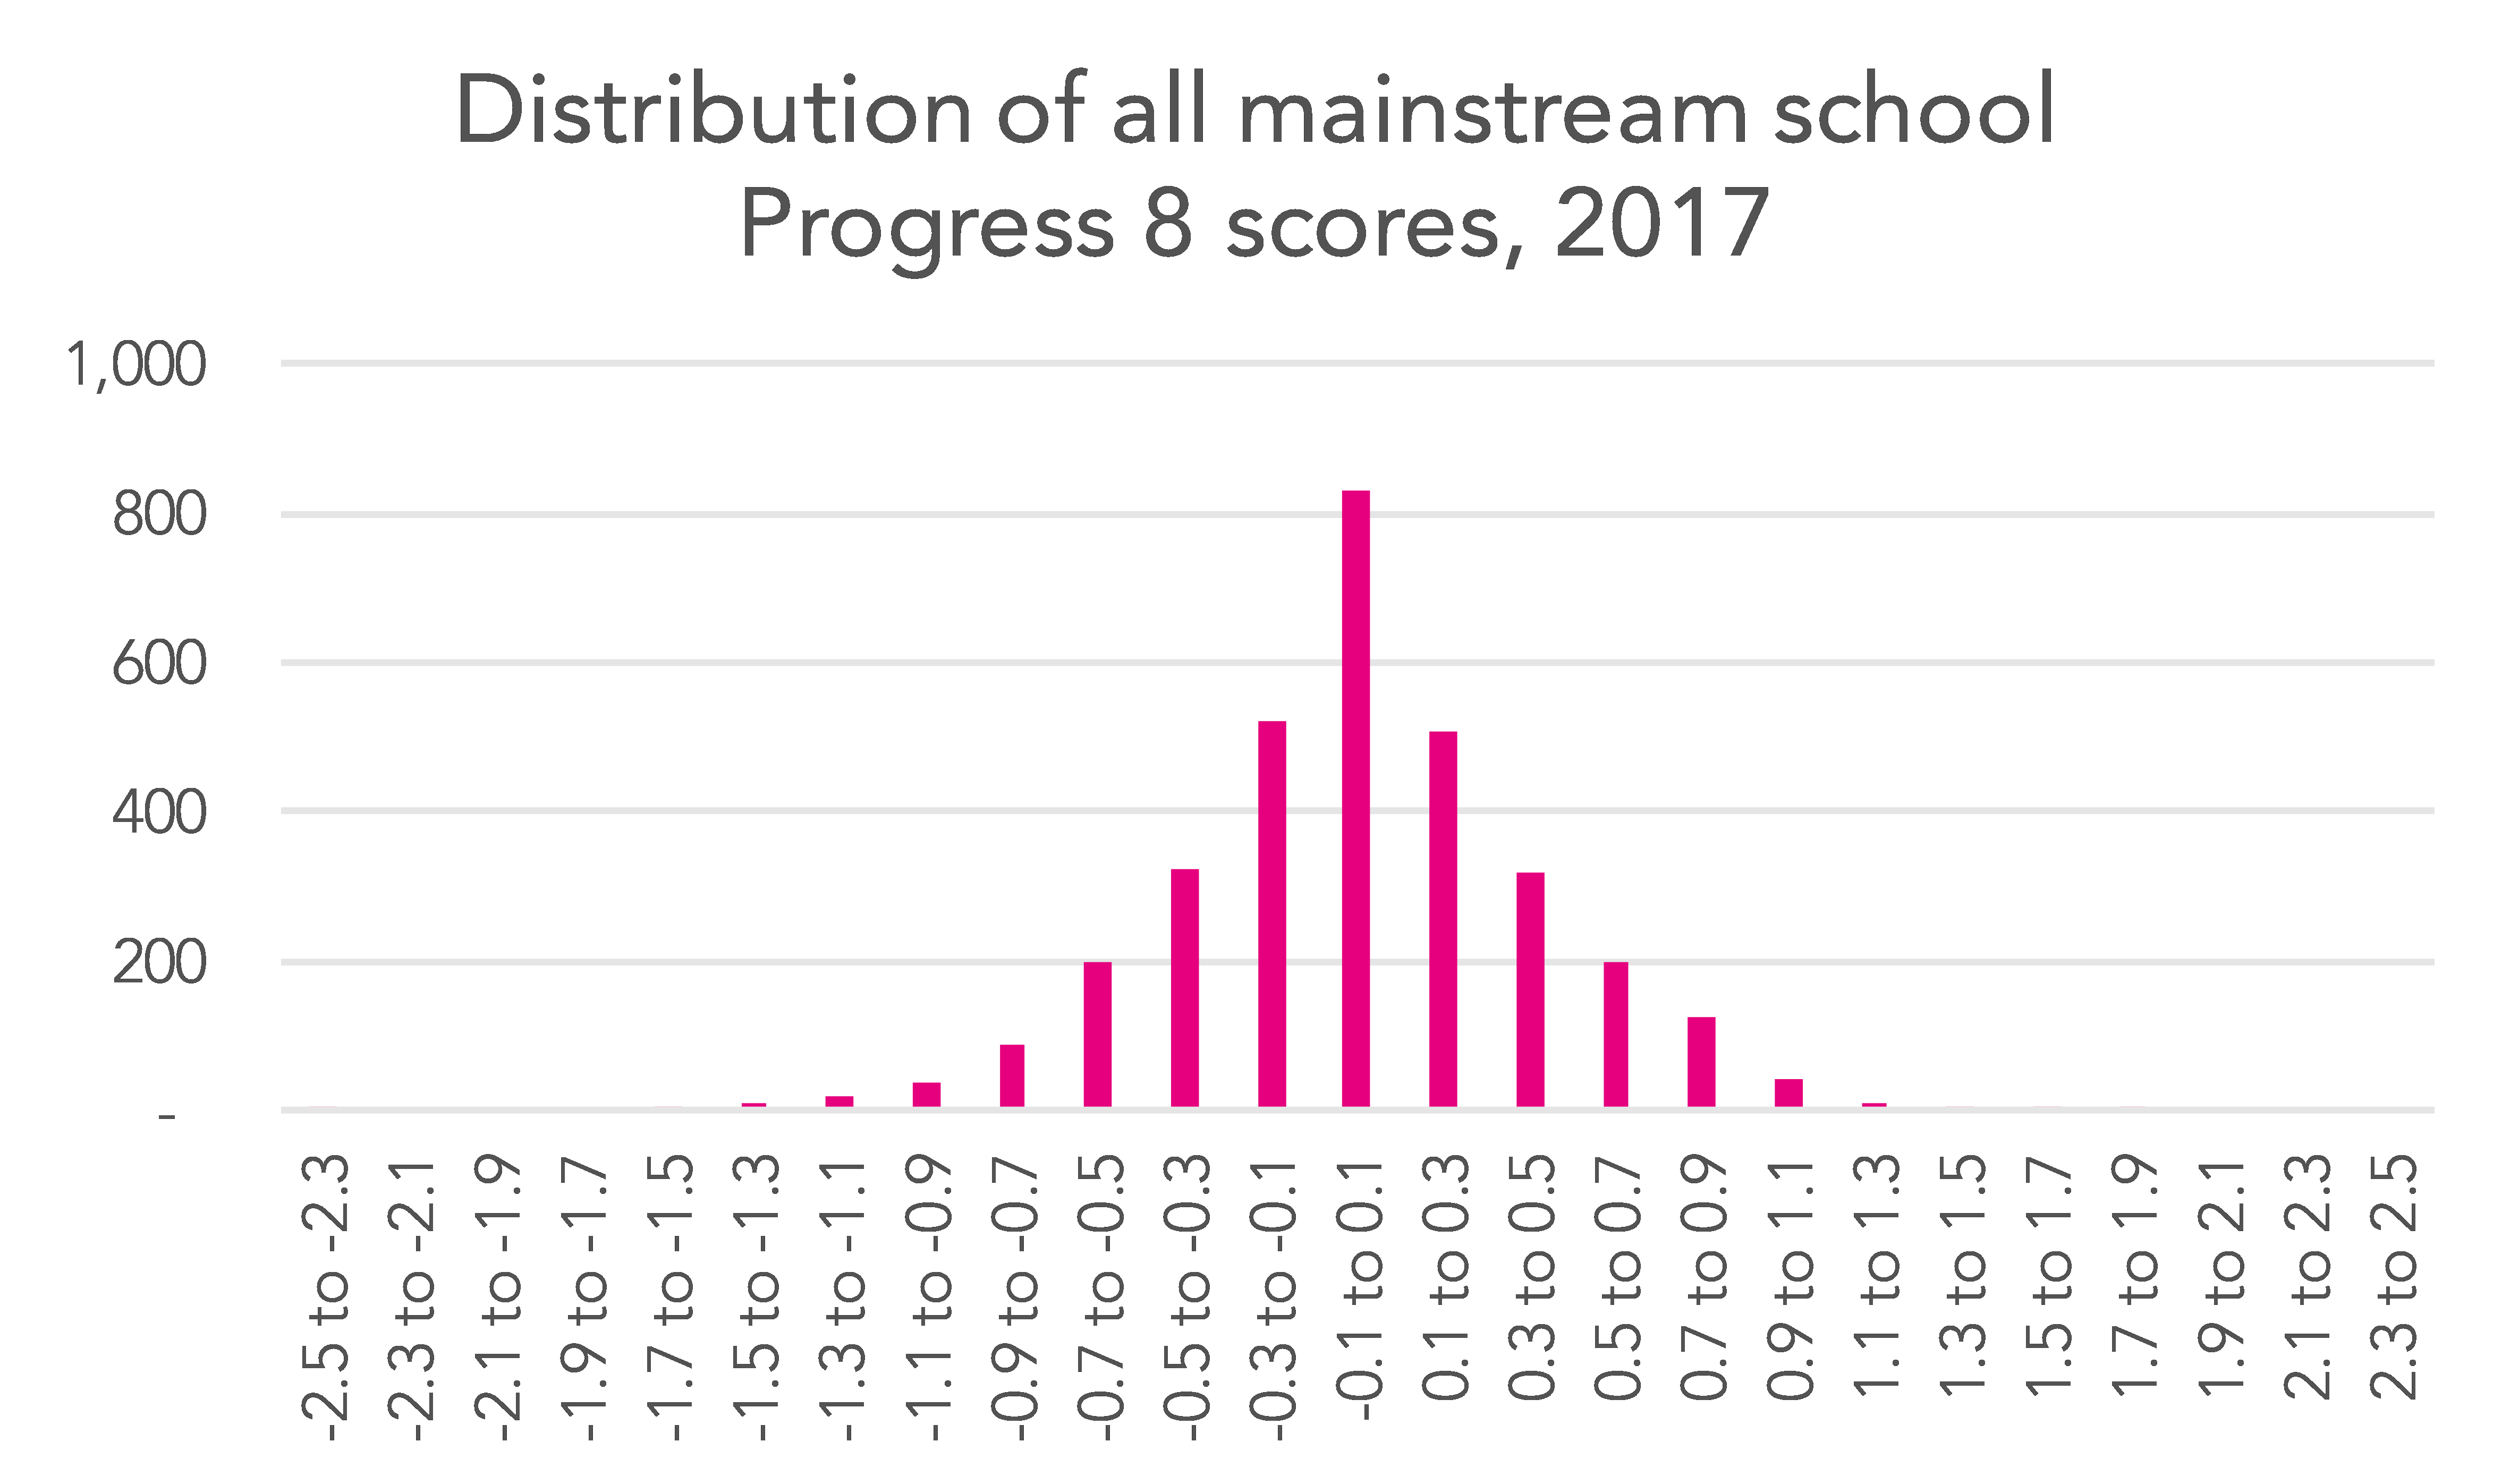
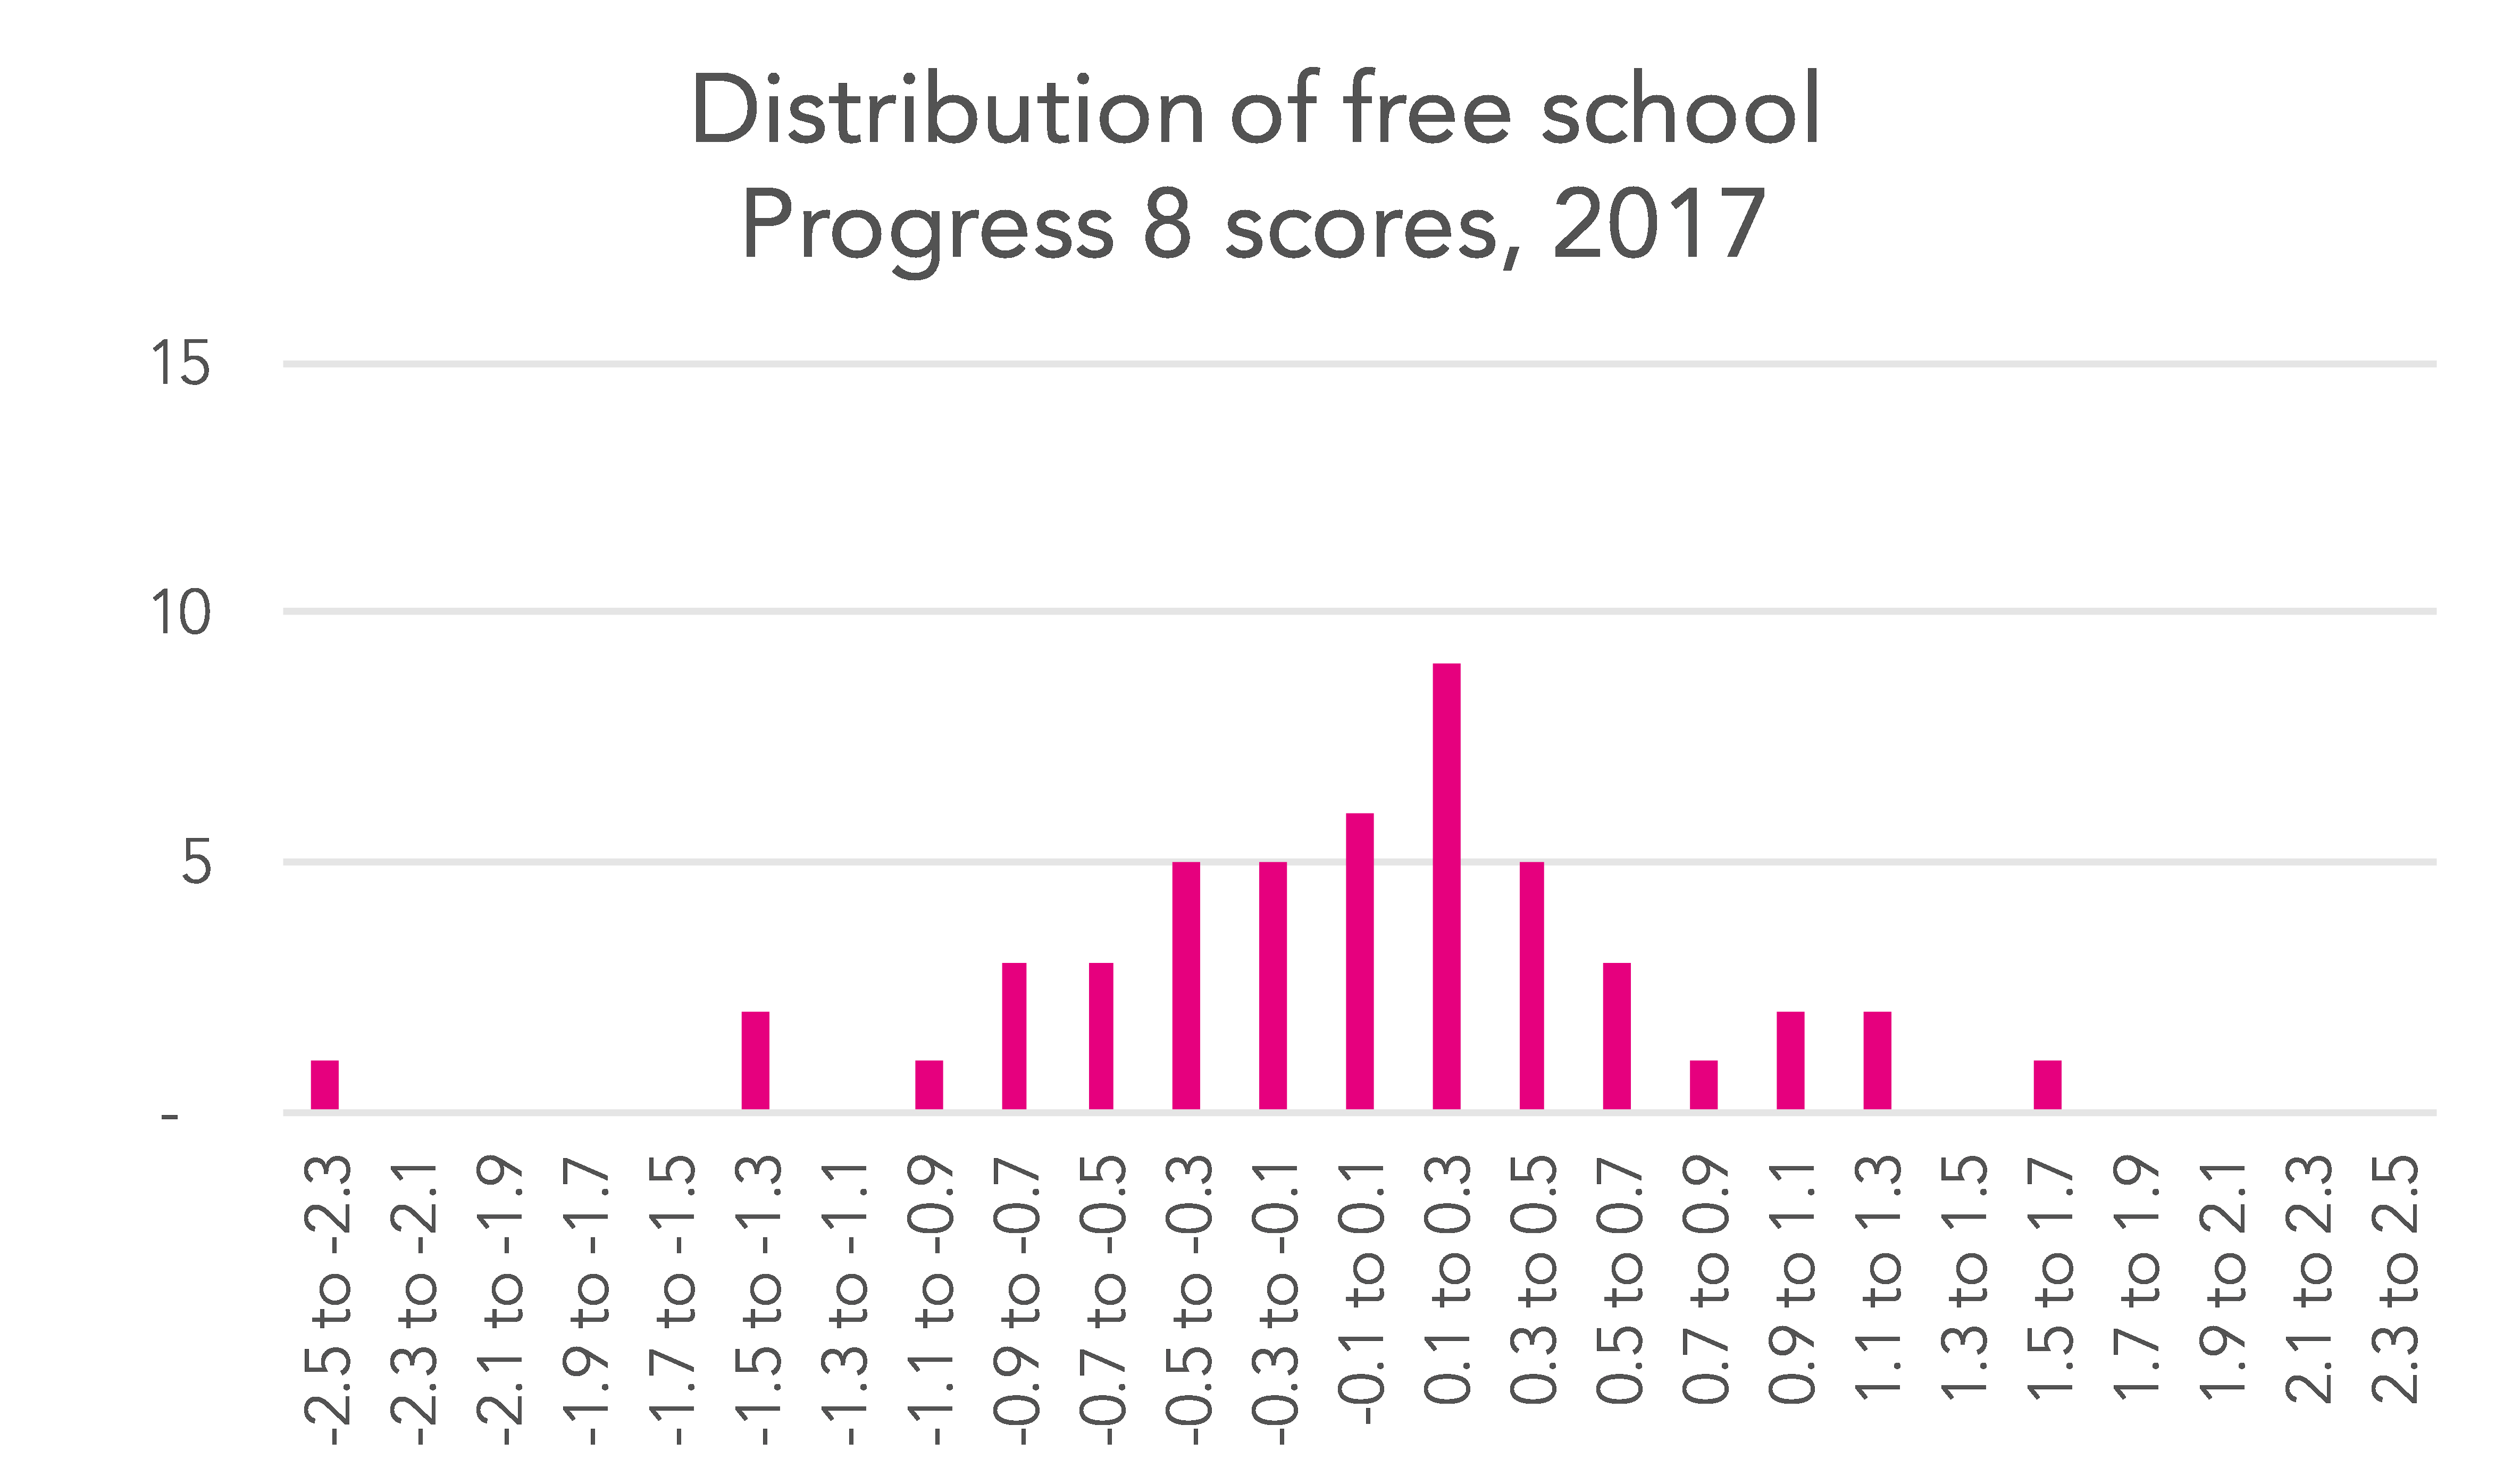
So we can see that, while the average P8 score for free schools is a little above that for mainstream schools in general, overall the distribution of results has a flatter profile. That is, there are more very high and very P8 scores for free schools than there are for schools in general.
This is perhaps not surprising. Free schools are innovating greatly, and, to some extent, that could be seen as part of their purpose. So maybe it’s unsurprising that we’re now seeing them achieving results that are further from a Progress 8 score of 0 – whether above or below that.
(It’s worth noting that the free school with a particularly low P8 score, of -2.32 is one of a very small number of 14-19 free schools: Robert Owen Academy. Some of the points which we have made previously about accountability measures for schools that admit at age 14 might apply.)
First cohort v second cohort
FFT Aspire
If you are a school using FFT Aspire, why not check your results against estimates in Aspire?
Not an FFT Aspire user?
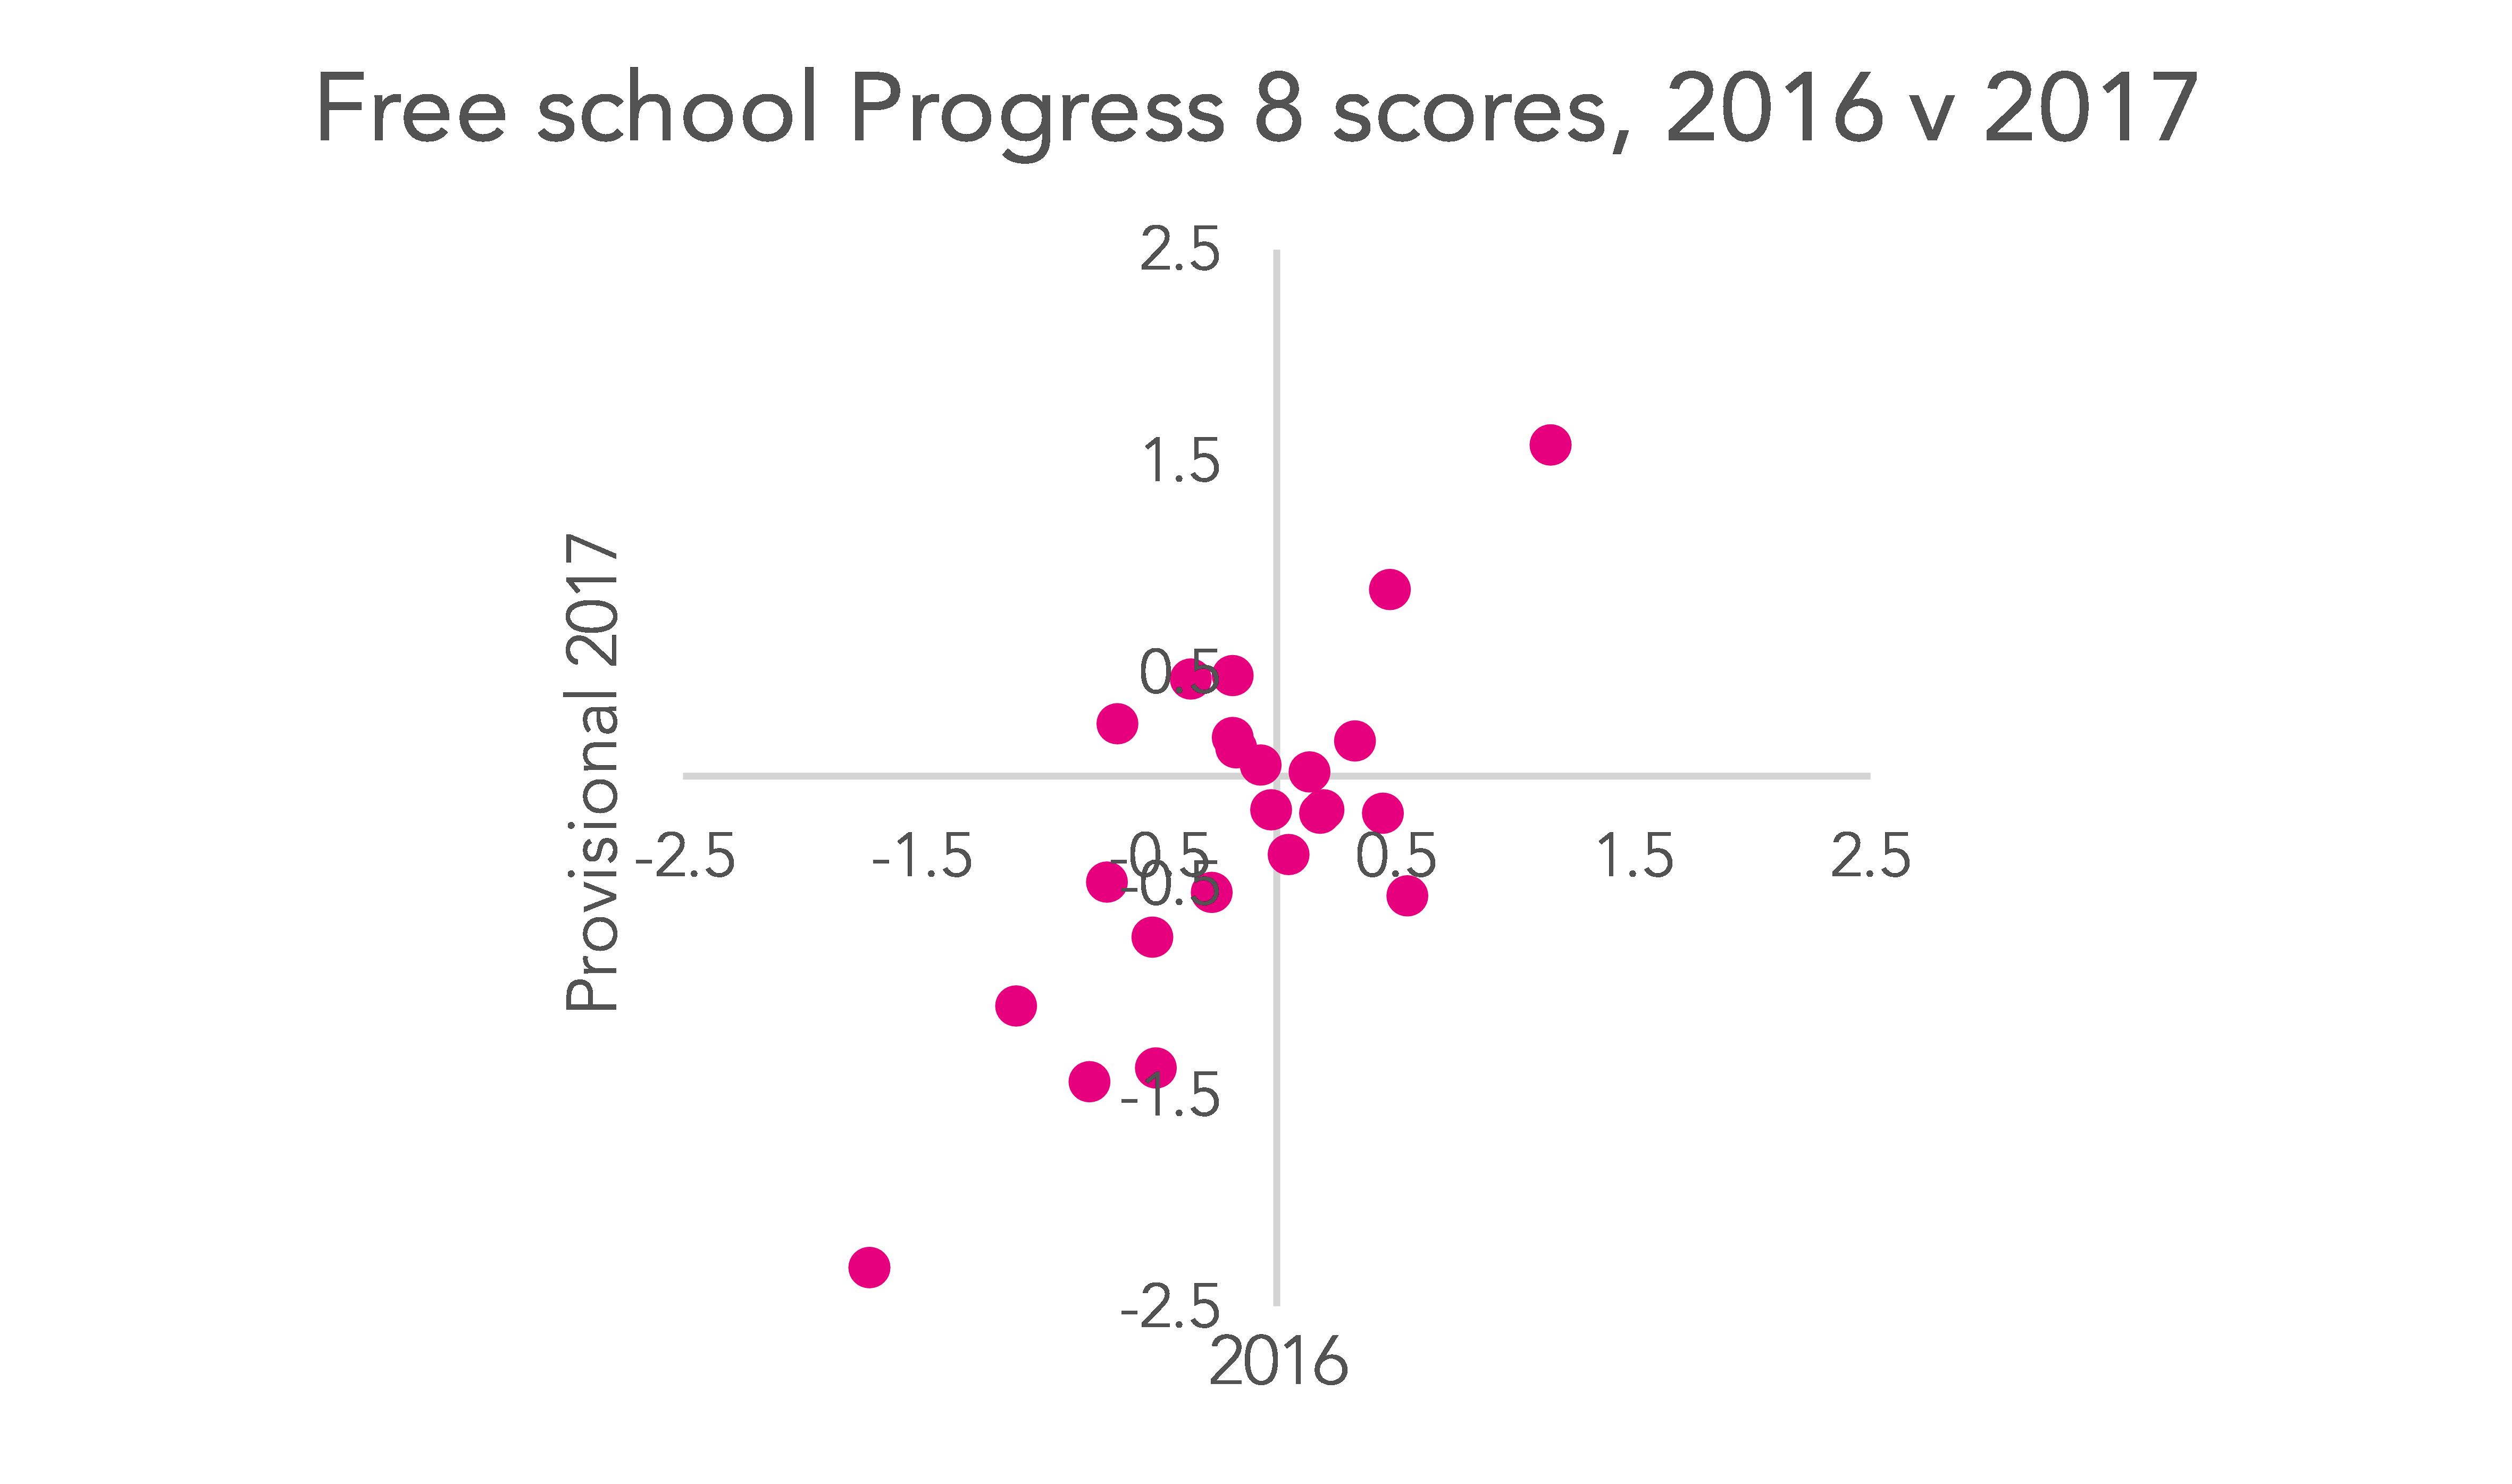
For those free schools that have now had two cohorts sit GCSEs, we might wonder if there was any difference in results for the first and second cohorts (thinking that, the intake of the free school might change over time, particularly if it started below roll).
On a first look, there doesn’t seem to be much sign of this. The below chart plots 2016 Progress 8 scores against today’s provisional 2017 figures.
There are only 23 free schools that had results both years, and as we explain in our post this morning, there are factors that reduce how comparable this year’s P8 scores are to last year’s, but broadly speaking, we think things probably look as we’d expect. If intakes are changing, perhaps looking at the second intake is too early to spot any differences.
Proposer groups
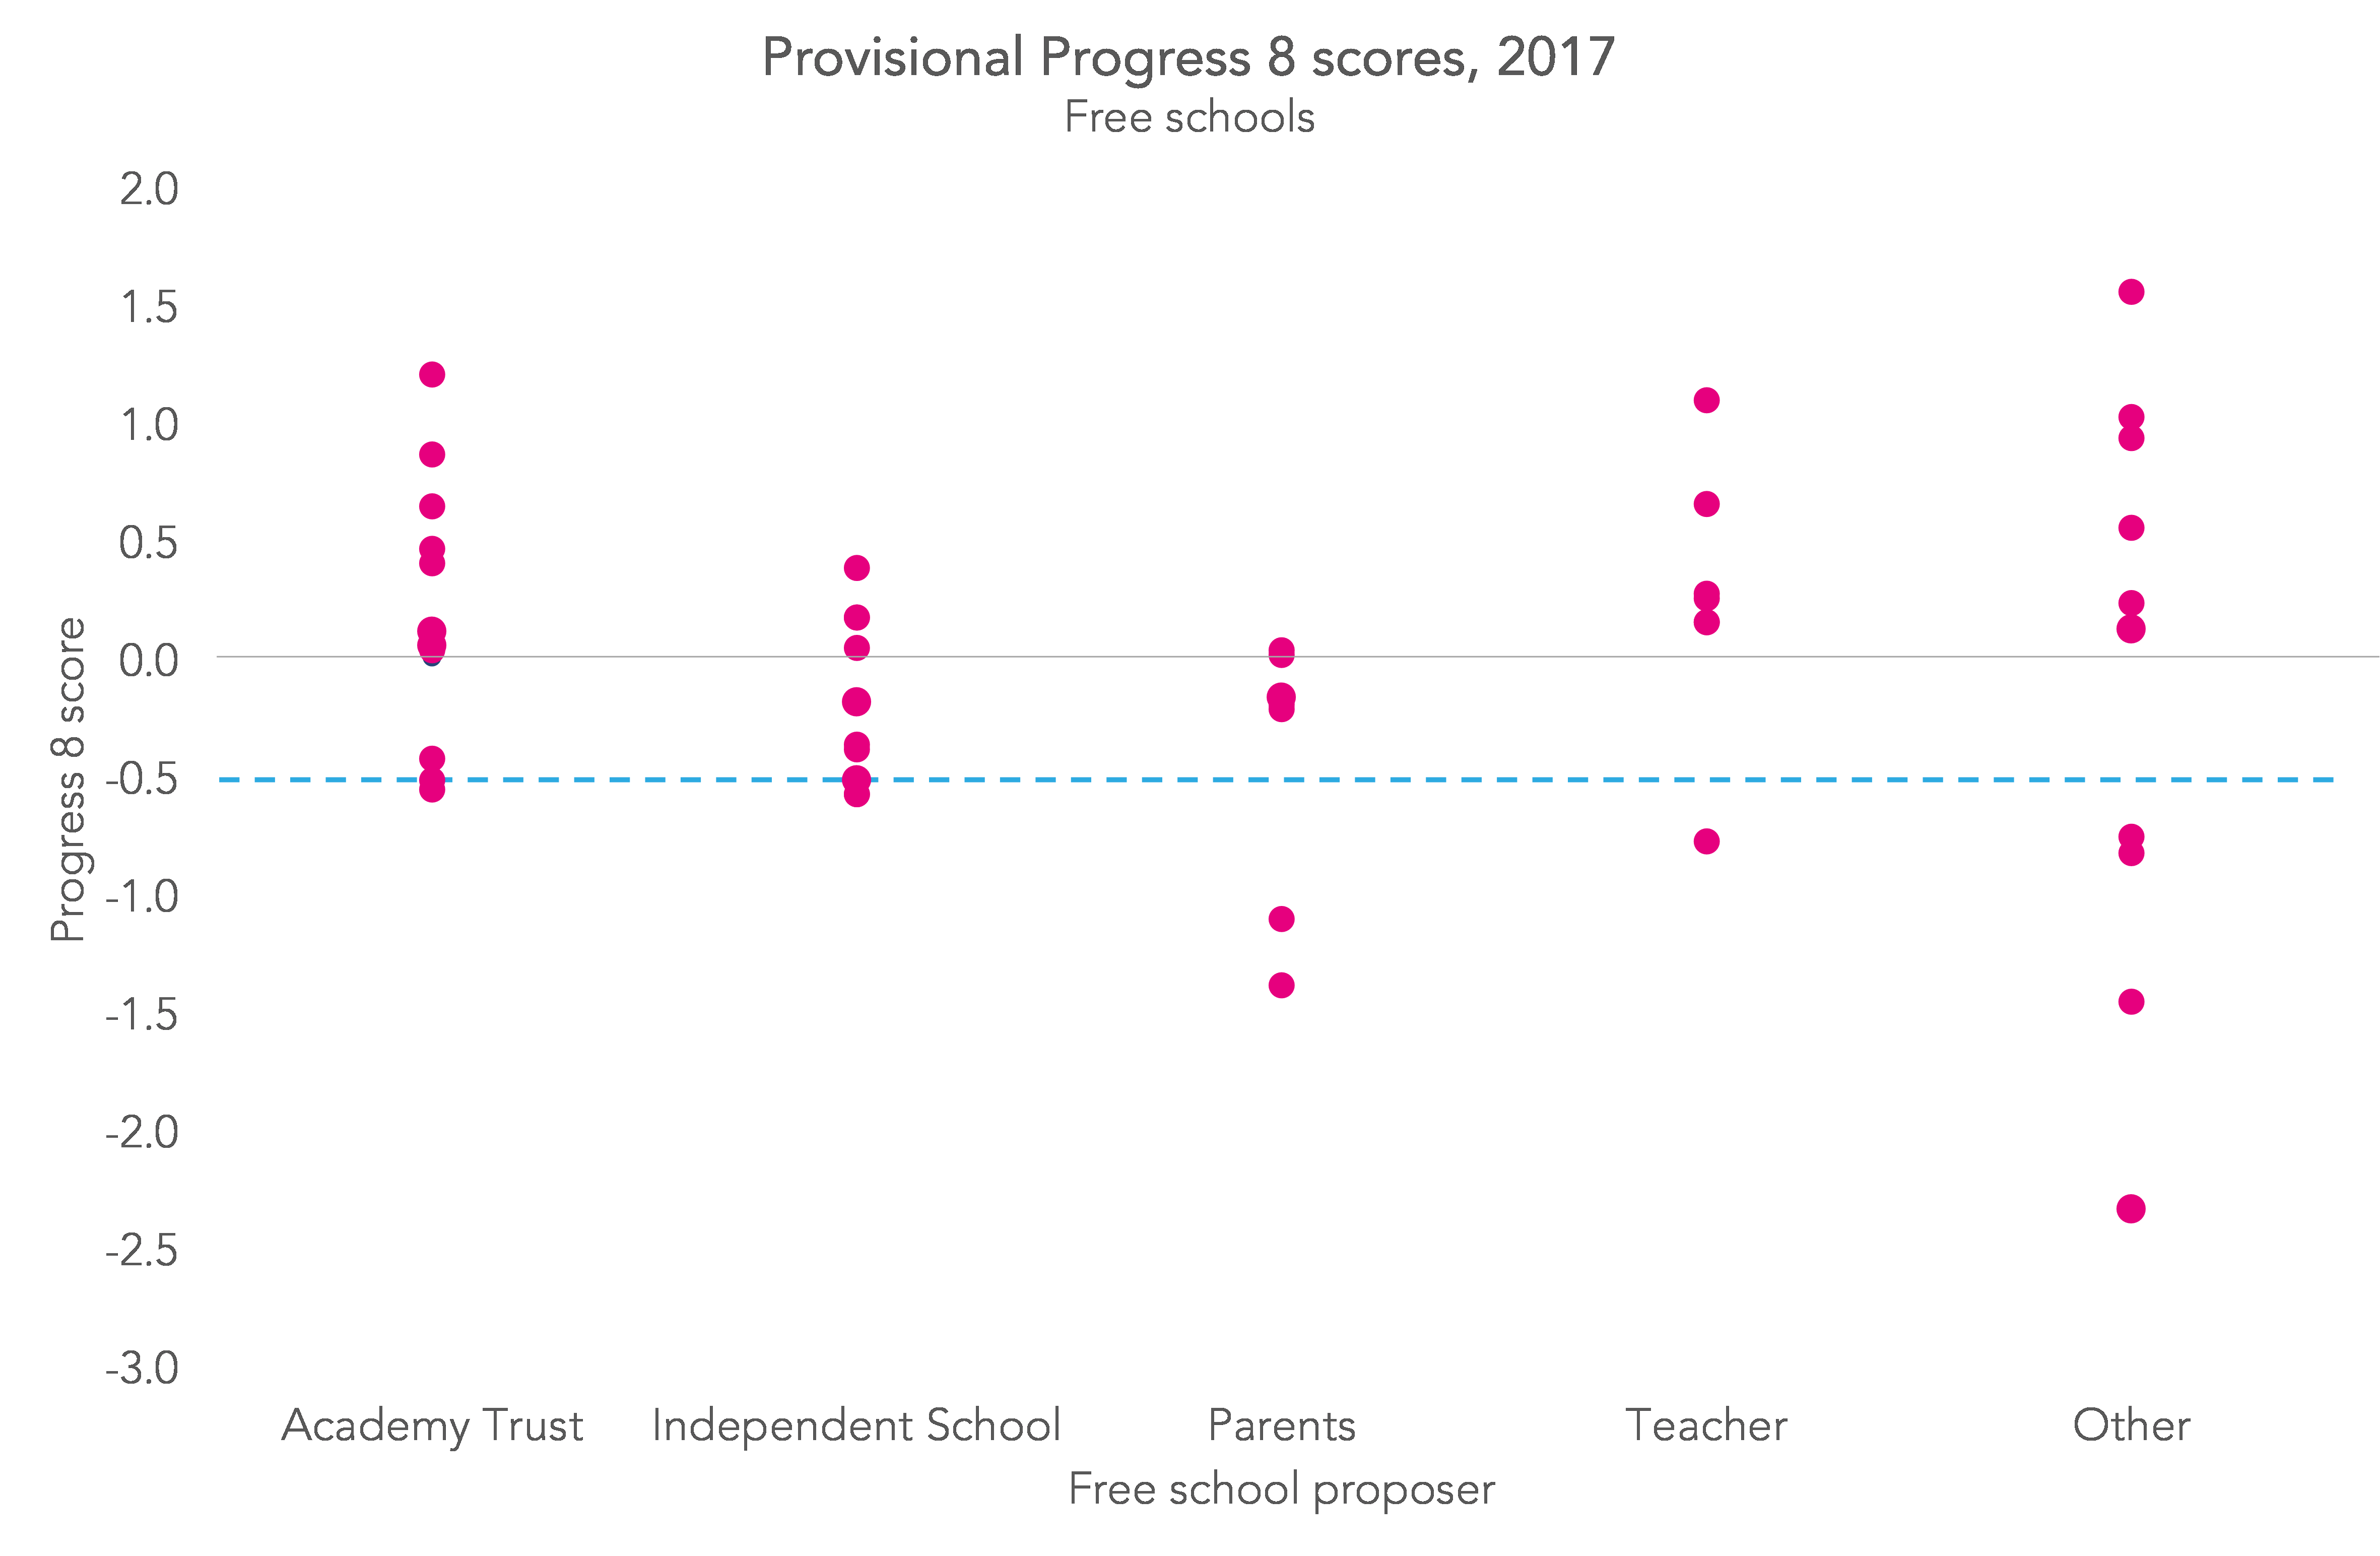
We can also look at results by free proposer group, applying an adapted version of a categorisation developed by Dr Rob Higham at UCL Institution of Education[1].
The chart below shows that, if results for free schools were variable, results for schools with proposers classified as ‘other’ – faith groups, charity and the FE/HE sector – seemed to have even more variable results.
Ofsted ratings
A total of 21 free schools that had their first set of KS4 results this year have already been inspected by Ofsted at least once.
The data shows that those judged outstanding tended to have higher Progress 8 scores than those judged good.
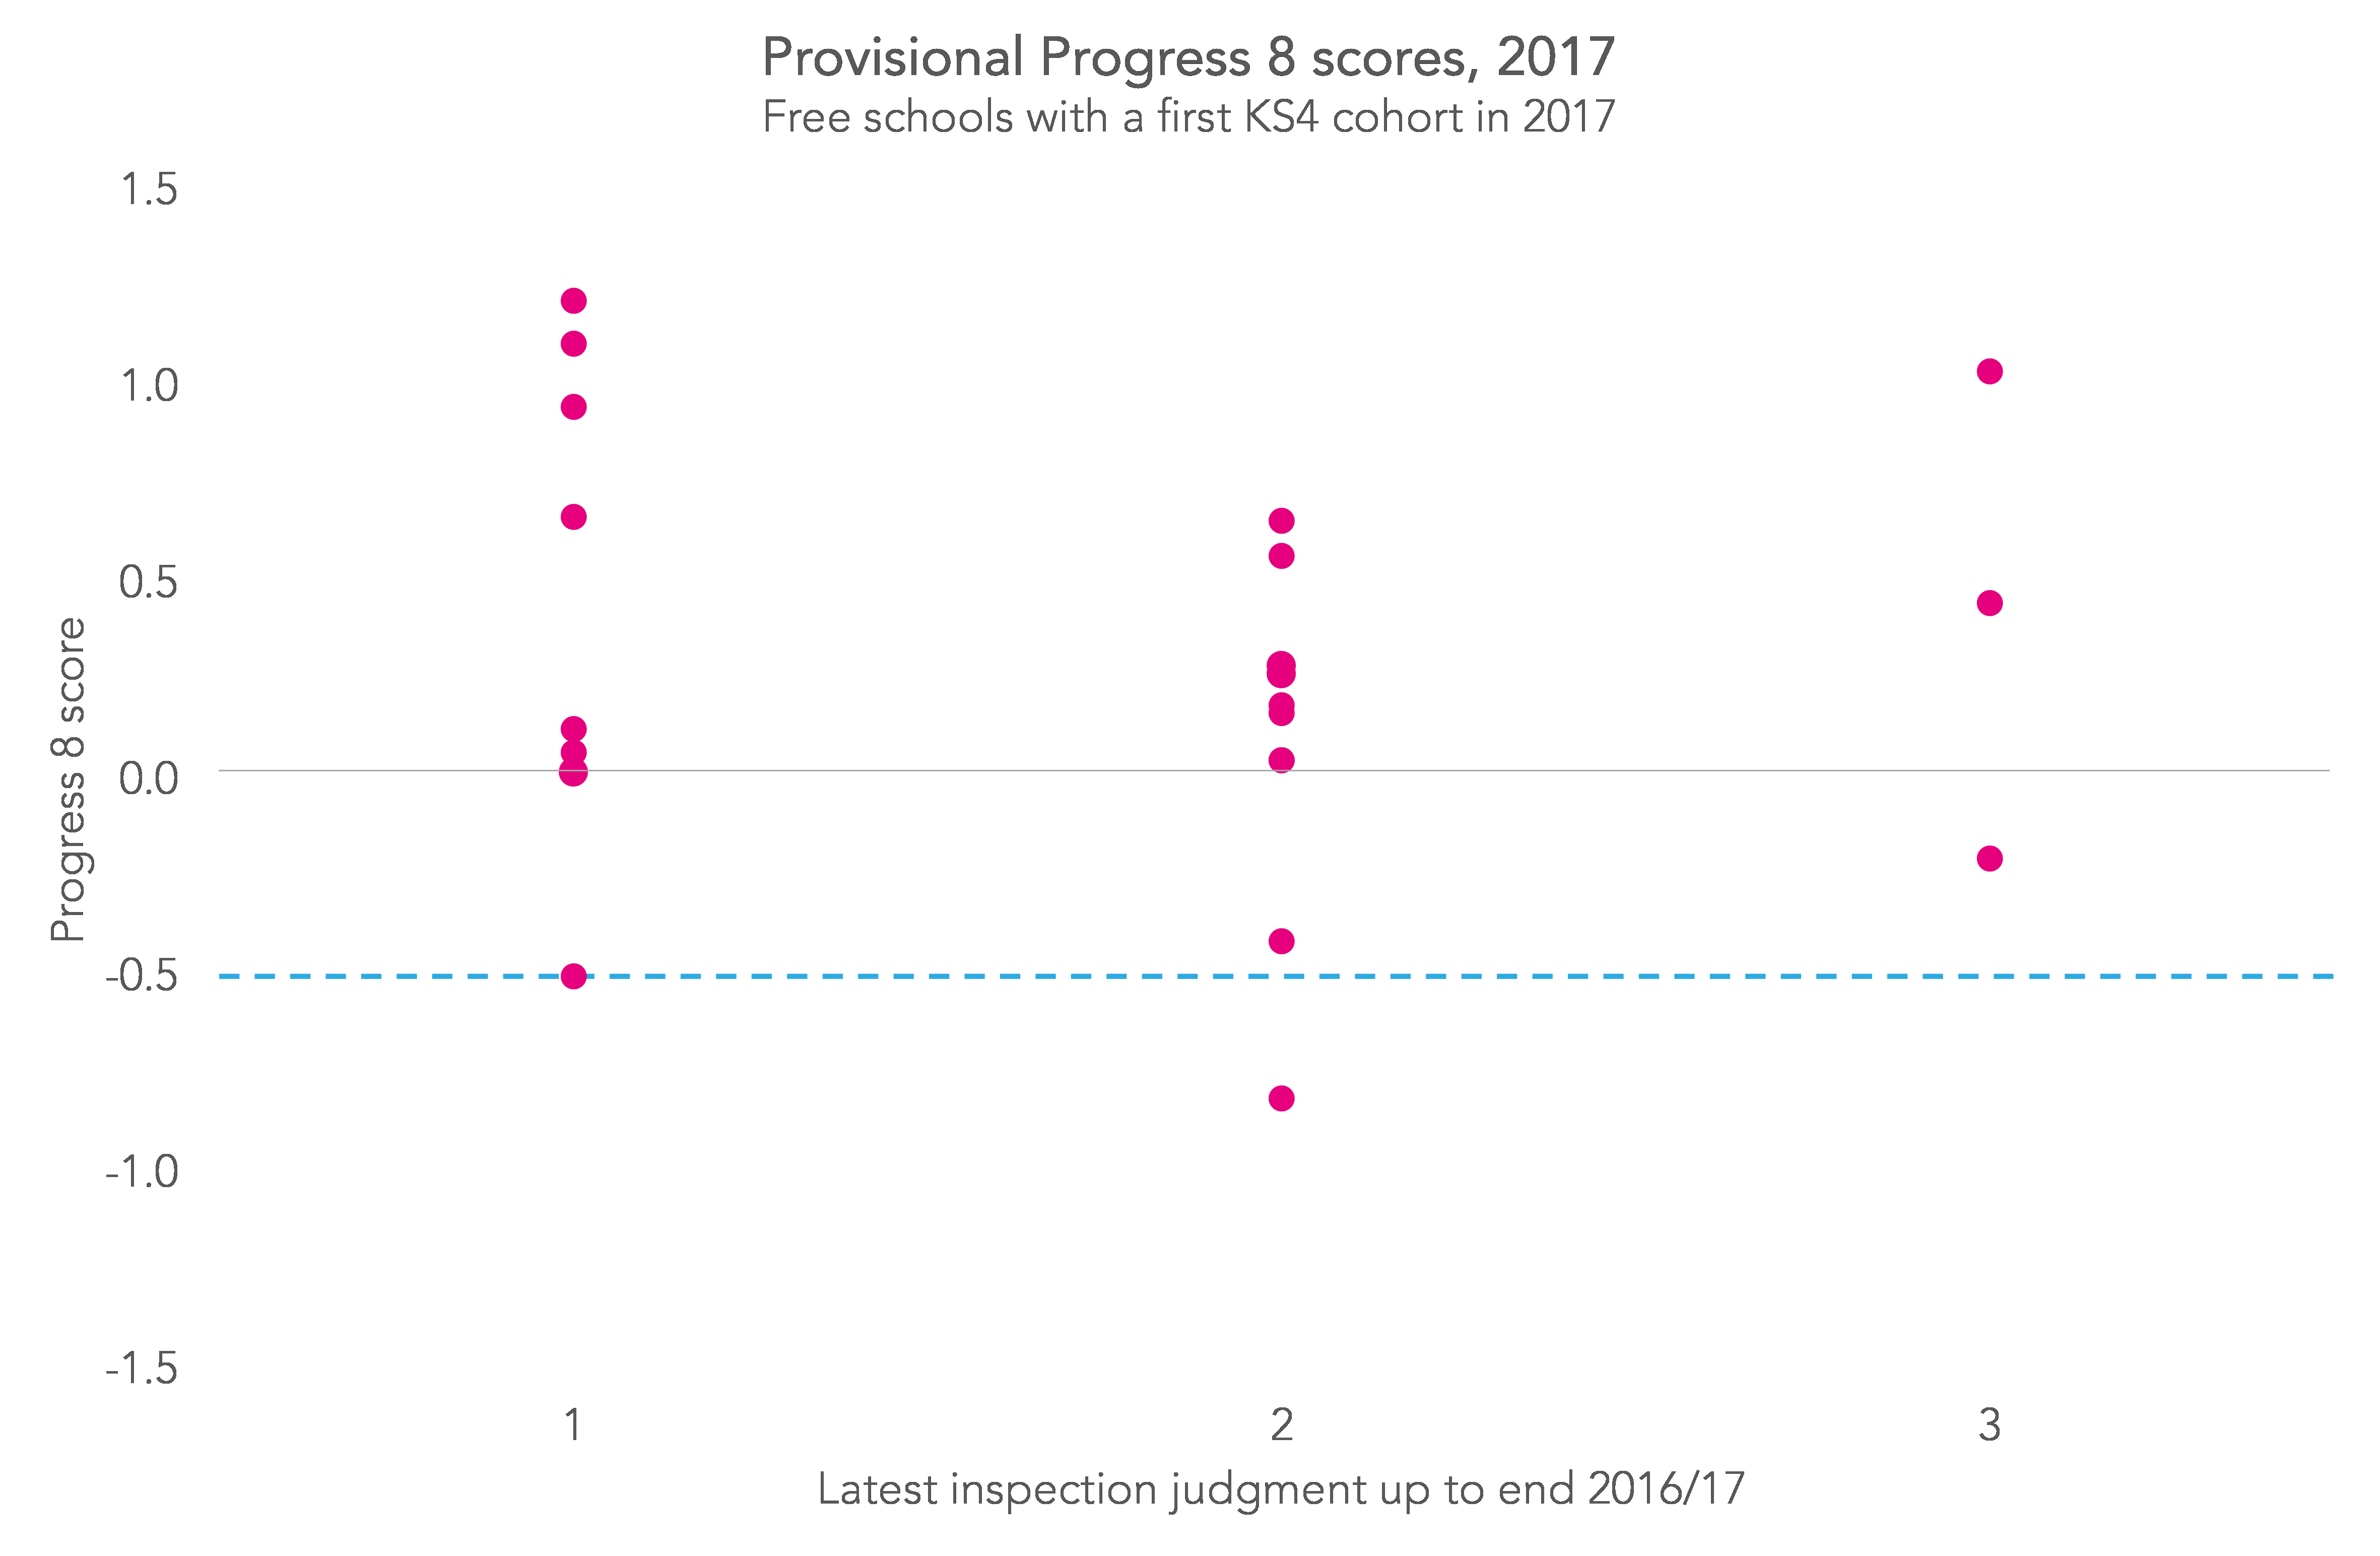
And three schools had received “requires improvement” judgements, of which Khalsa Secondary Academy achieved a P8 score of 1.04. Published Ofsted data, on which this analysis is based, runs to the end of June, but the school has subsequently been upgraded to good, when reinspected last month.
However, Ixworth Free School, which was inspected in June and received a “requires improvement” judgement, also recorded a positive P8 score. Leaders might beg to differ with Ofsted’s view that “leaders, including the trustees, have not ensured that pupils make good progress.”
(None of the free schools that feature in KS4 data for the first time today had been rated inadequate – though we need to bear in mind that some free schools rated inadequate have subsequently merged or closed.)
Want to stay up-to-date with the latest research from Education Datalab? Sign up to our mailing list to get notifications about new blogposts, or to receive our half-termly newsletter.
1. Proposer categories were developed by Dr Rob Higham at UCL Institution of Education for the paper ‘Who owns our schools?’. This post uses a revised version of a categorisation that will be published in Higham’s forthcoming paper (with Datalab’s Rebecca Allen) on free school admissions and social selection.


Please, please state which average you are using in future articles. I understand that your intention is to make the article accessible but it’s also important to educate. I imagine almost all readers who are able to access this article understand the difference between mean, median and mode. In the ideal world all statisitical reports should quote all three.
Putting the caveats at the beginning was very important, as you said it’s really too early to tell. Something to watch over time.
Hi Paul, that’s a fair comment re: stating which average is used – and something we can try and make sure we do in future. For the avoidance of doubt, the averages given here are means.
It would be interesting to have a study of how well all new schools – whether Free or not – perform/have performed against what is regarded as the key measure at the time? Probably too difficult to research easily. It has always been thought that new schools are easier to run in the sense that it is more likely that all the staff are buying in to the values of the school.
Thanks, Tim. Agree that that would be an interesting thing to look at for the reasons you say – perhaps one for us to explore at some point.