Schools’ provisional Progress 8 scores for 2017 were published today, having already been released to schools over a fortnight ago.
This would have been a chastening experience for those falling below the floor standard of -0.5.
On the surface, there are more of them this year than last. But is this fair?
Changes to GCSE points
This year’s scores are based on a mash-up of reformed GCSEs (graded 9-1) and legacy GCSEs (graded A*-G).
To bridge the divide, the Department for Education introduced an “interim” points scale for legacy grades, which we wrote about here.
Crucially, these scores are not directly comparable with last year’s published figures, hence a fair amount of head scratching in some schools wondering whether they have improved (or not) compared to last year.
This year’s P8 scores are more difficult to interpret than last year’s (as will be next year’s, for the same reason).
A score of 0.5 in 2016, for example, meant that pupils at a school achieved on average half a grade per subject (on the A*-G scale) more than pupils nationally with similar prior attainment.
This year it doesn’t have quite the same meaning.
Notionally, it still means half a grade per subject, but it’s now on the new 9-1 scale. However, this requires making a heroic assumption that A*-G grades have been adequately aligned with 9-1 grades using the new points scale.
The impact of these changes
In a previous blogpost, we warned that the interim scale would result in a) more schools falling below the floor, and b) a widening of the P8 gap between the most advantaged and least advantaged schools in terms of pupil intakes. And lo, it has come to pass.
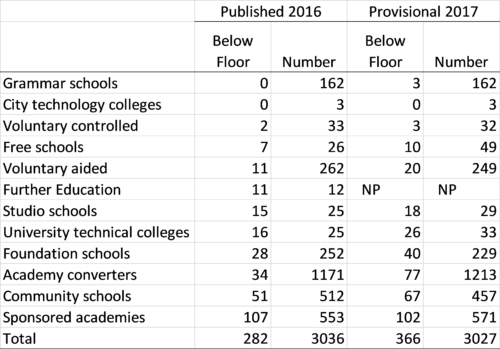
The number of schools officially below the floor standard is only announced when performance tables are published in January. Last year, there were 282. But based on this year’s provisional data there are 366 (not including those flagged as closed). One or two might avoid the floor as a result of data amendments (and indeed one or two might slip below the bar). In addition, data for around 20 FE colleges which admit pupils at age 14 does not appear to have been published for 2017 and most of these will be below the floor.
As was the case last year, university technical colleges and studio schools are over-represented among schools below the floor. There are more of them in this year’s data as well[1]. As we wrote here, we wonder whether Progress 8 really is a suitable metric for studio schools and FE colleges given that by design they offer a different curriculum to that explicitly encouraged (and rewarded) by Progress 8.
Number of schools with P8 scores below -0.5 (excluding closed schools)
It is not necessarily the case that there are more poorly-performing establishments this year. The change in points scale was always going to affect the number of schools below the floor.
We showed previously how applying the old and new points scales for A*-G GCSEs to exactly the same data led to more schools falling below the floor standard when the new scale was used. In other words, the new scale raises the bar (or, more accurately, raises the floor).
Meanwhile, the P8 scores of grammar schools have superficially “improved” but again, this is a consequence of applying a points scale that stretches out the scores of higher attainers while narrowing the range of scores for lower attainers. Surprisingly, three Grammar schools were below the provisional 2017 floor although it appears that none of their pupils achieved the basics (English and maths), which suggests there may be some missing data (or they entered pupils for IGCSE).
Average P8 score by school type (excluding closed schools)
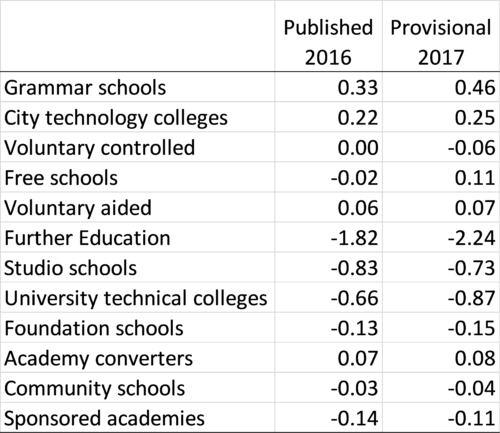
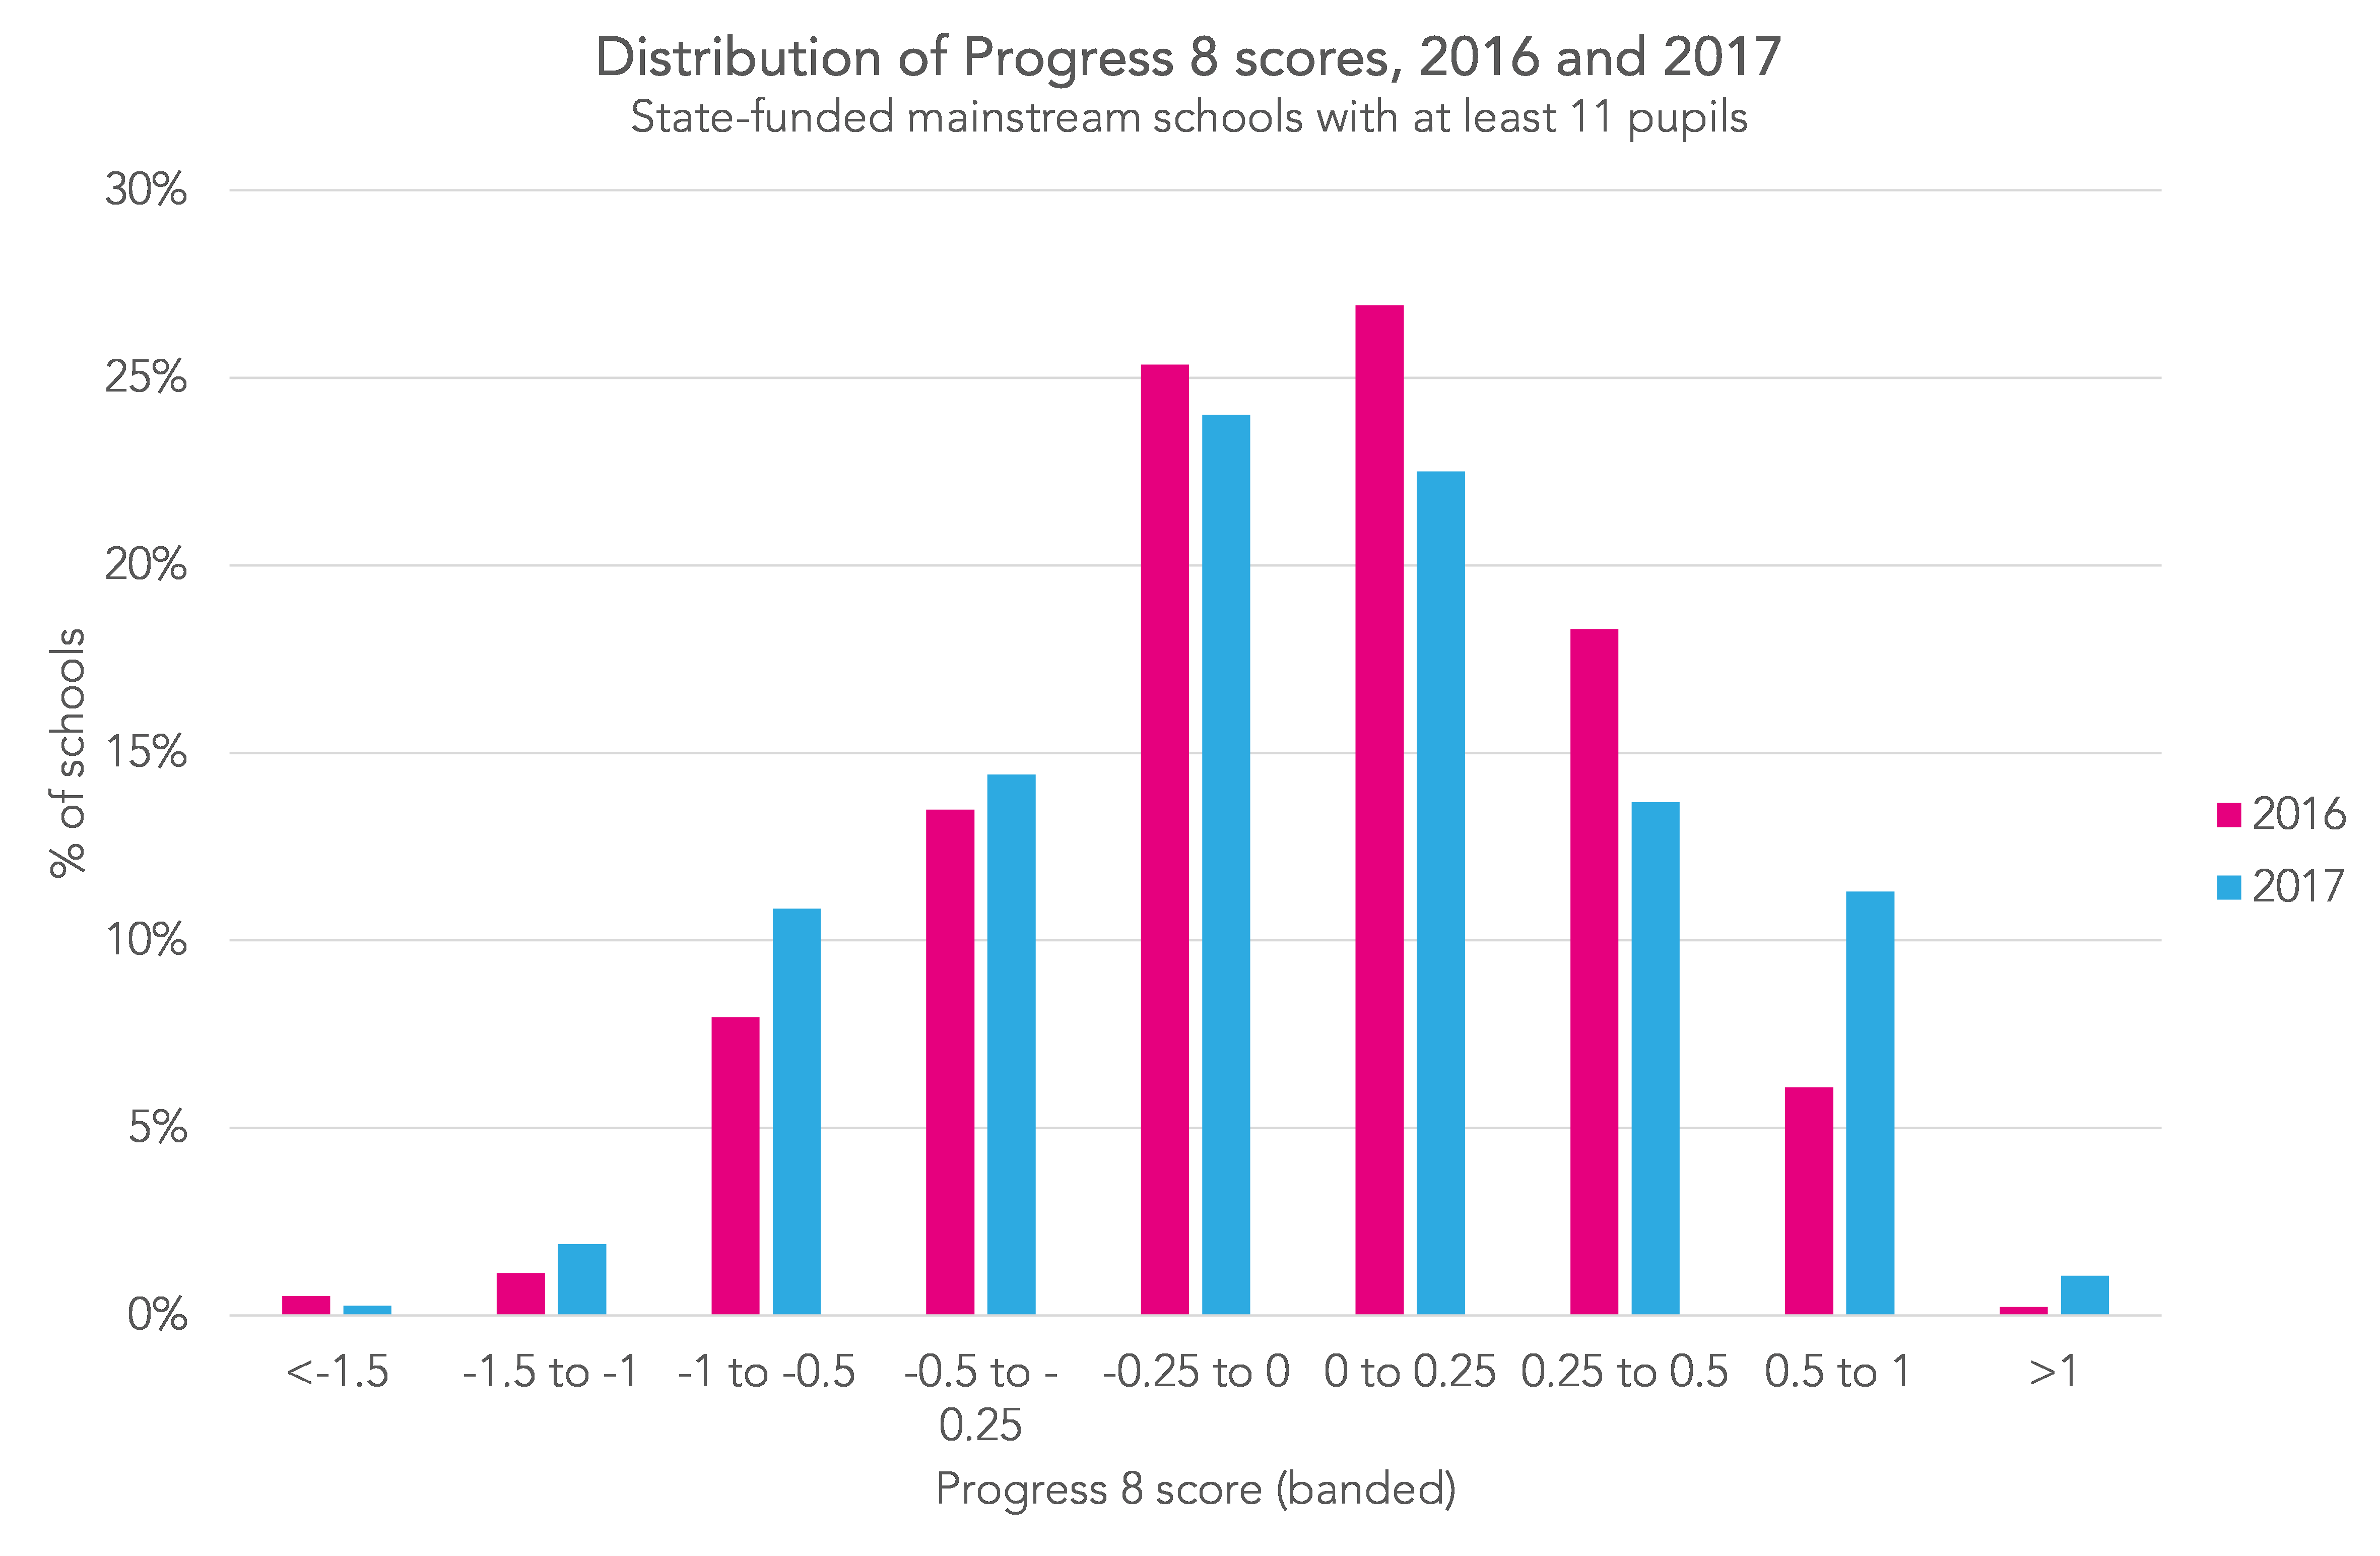
As a result of the new points scale, there is a wider spread of school P8 scores this year.
Given that the Department for Education provided schools with “shadow” data for 2016 that gave an indication of the impact of the changes in GCSE points awarded (as per our blogpost mentioned earlier), I can only assume that not only were the DfE aware that more schools would fall below the floor if it remained at -0.5, but also that they considered this justifiable. I suspect some will disagree.
Want to stay up-to-date with the latest research from Education Datalab? Sign up to our mailing list to get notifications about new blogposts, or to receive our half-termly newsletter.
1. The increase in number is due to the first intake completing Key Stage 4 at a number of recently established institutions.


Is a possible explanation for the grammar schools that cohort sat maths in 2016 and that, as unreformed qualifications aren’t included in attainment 8, they get a zero in the maths slot. Suspect this is the case with some other high attaining schools whose P8 score has fallen.
Hi David. Yes, that’s also a plausible explanation. We’ll find out in due course. Thanks very much.
I’m confused why there’s an average 2017 P8 Score for FE Colleges (-2.24) in the second data table when table 1 and text indicate that 2017 P8 scores haven’t (yet) been released for FE colleges with KS4 students….
Hi Mike. Me too. An average for the FE sector as a whole was published in the SFR https://www.gov.uk/government/uploads/system/uploads/attachment_data/file/651218/SFR57_2017_Main_Text.pdf but scores for individual colleges were not available in the data download from https://www.compare-school-performance.service.gov.uk/download-data. I guess they will appear at some point.
We are concerned at the high proportion of students with GCSE results who are not included in the data as they have no Key Stage 2 Data. In one of our schools it is 18% of the cohort. Has anyone looked at the overall proportion of students not included in P8 and if there is any relationship between students with no prior data and P8 outcomes?
Hi David. Certainly in the past there was hardly any relationship between coverage (% of pupils with KS2 data) and P8 at school-level. If you look at 2016 data you’ll see quite a spread of P8 scores among schools with <85% coverage.
Thank you. What proportion of schools have <85% coverage? I know I should probably know how to look this up!?
In 2016 it was 5% (excluding any schools with <50% coverage, which don't have P8 published at all).
bit puzzled by the 33 UTC’s included in the above table. I think 37 UTC’s published results this year.
Hi Roger. Closed schools are not included in that table.
So Daventry, Tottenham, Greater Manchester & Royal Greenwich??
Seems a shame – 30/37 failing is a higher % than 26/33 failing.
Presumably the government has now shut up shop on these – and those that are in place will quietly wither on the vine
Key question to ask is “how would pupils who attended UTCs have performed if they had stayed at their previous schools”? Can we be sure their performance would have been any different? As for which UTCs are in the 33 here’s the list:
Elutec
Heathrow Aviation Engineering UTC
Aston University Engineering Academy
WMG Academy for Young Engineers
Health Futures UTC
West Midlands Construction UTC
Liverpool Life Sciences UTC
Bolton UTC
UTC@MediacityUK
UTC Sheffield
Bristol Technology and Engineering Academy
Humber UTC
Buckinghamshire UTC
Derby Manufacturing UTC
UTC@harbourside
The JCB Academy
South Wiltshire UTC
UTC Reading
UTC Cambridge
South Devon UTC
UTC Plymouth
Sir Charles Kao Utc
The Leigh UTC
Medway UTC
UTC Lancashire
Energy Coast UTC
The Elstree UTC
The Watford UTC
Lincoln UTC
University Technical College Norfolk
Silverstone UTC
Daventry UTC
UTC Oxfordshire
Brilliant – thankyou. But IF that is the question to be asked – & you have much more experience than me – then really the UTC’s are becoming sort of “super PRU’s” – & there MAY be a need for these – but would they need to be called UTC’s.?? They seem a very expensive way of achieving not too much. And the demand for different assessment measures is equally bizarre: we run the risk of too much analysis & too little attainment & progress – to my mind. The joys of a debate about education!1
Indeed. What are UTCs for and who are they for are very valid questions. Perhaps they are occupying the finest minds in education at this very moment.
Wouldn’t hold your breath on that one!