Towards the end of last month, the Department for Education published ‘shadow’ Attainment 8 data for 2015/16 [PDF].
This shows the impact of moving from the familiar scoring of A*-G grades – one point for grade G, up to eight points for grade A* – to the interim scale that will be used in 2016/17 and 2017/18, when pupils will achieve a mix of reformed GCSEs – graded 9 to 1 – and legacy GCSEs.
Secondary schools were able to download additional data that shows how their 2015/16 Attainment 8 and Progress 8 scores would have been affected by using the interim points scores.
We wrote some time ago about the likely impact of the interim points scores for particular types of schools. With the shadow data now in schools’ hands it is worth returning to it. We should say that we do not have access to DfE’s shadow Attainment 8 data for individual pupils, but we have calculated our own version which matches the published summary data.
Gaps will widen
The published summary data shows that the national Attainment 8 average for state-funded schools would fall from 49.9 to 44.6 using the new points scores.
This drop is not evenly distributed across the prior attainment range, however.
The chart below shows average published and shadow Attainment 8 scores by prior attainment. The shadow points actually lead to higher Attainment 8 scores for pupils with high levels of prior attainment.
Attainment 8 by Key Stage 2 attainment
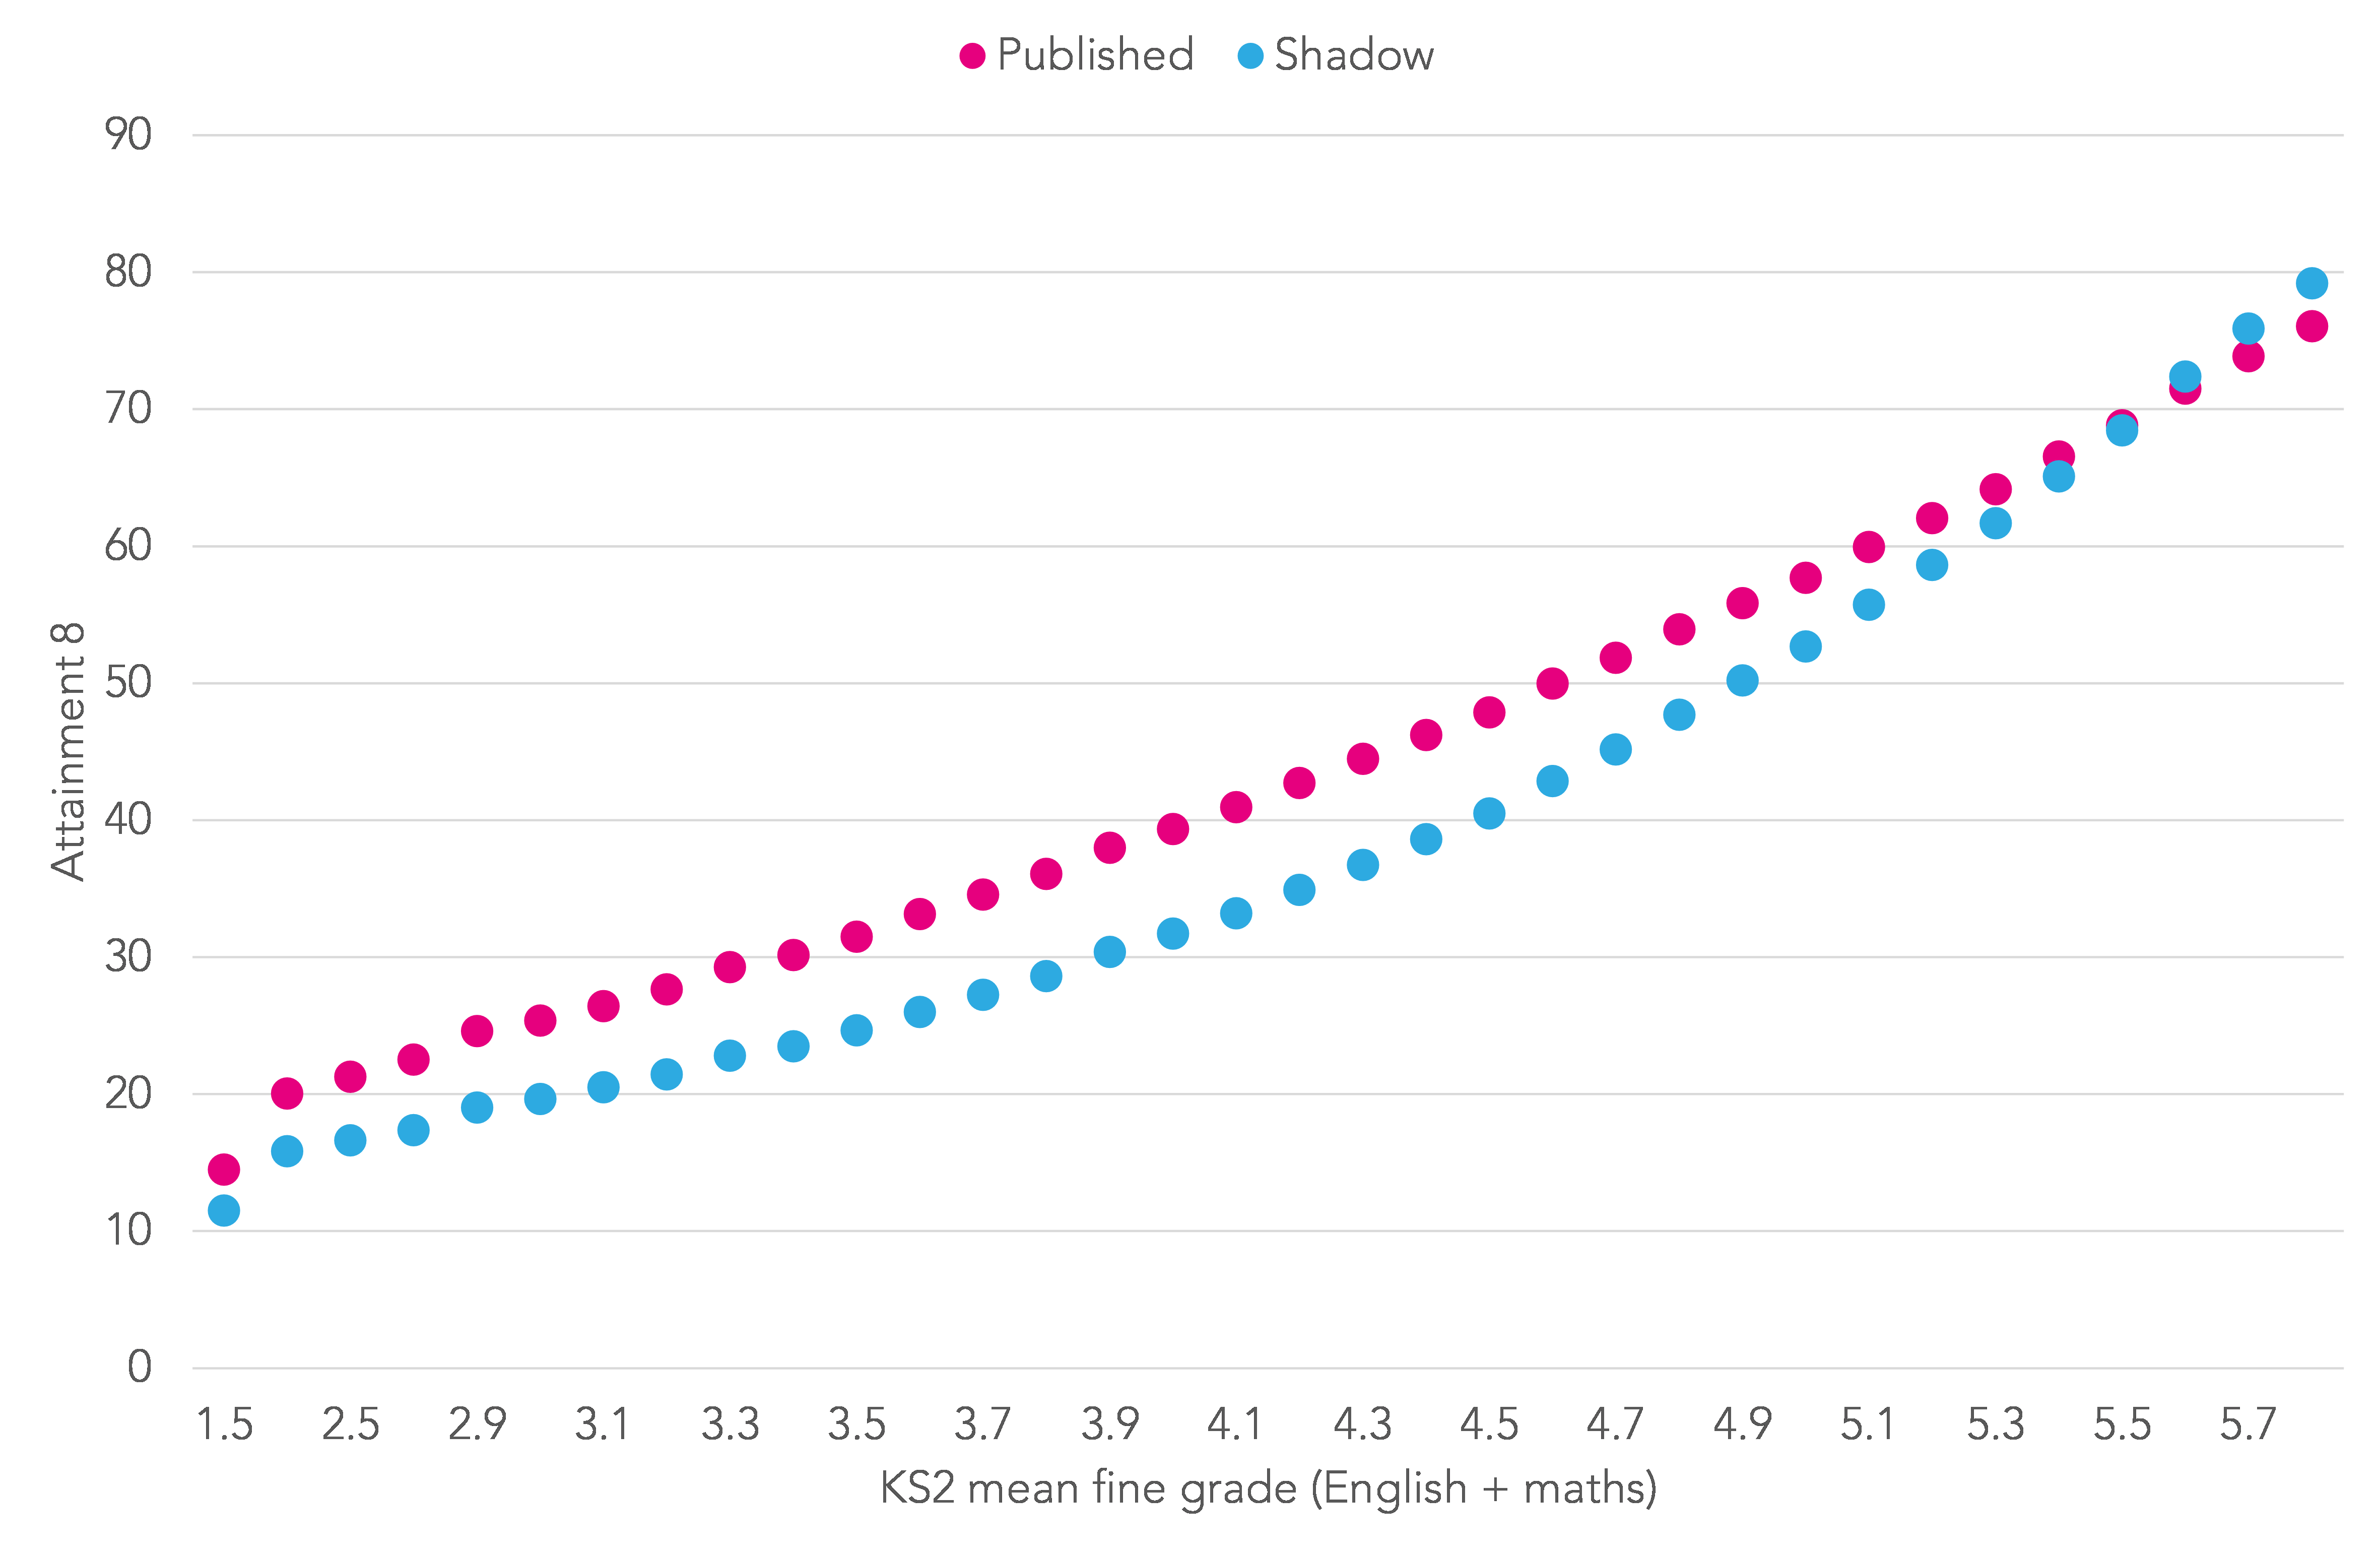
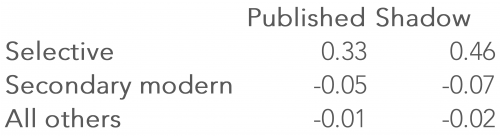
As would be expected from the chart above, the shadow scale widens the gap between selective (grammar) schools and the remainder. Remember the data are the same, it’s just the way that grades are scored that has changed. This underlines the fact that Attainment 8 and Progress 8 scores in 2017 will not be comparable with those from 2016.
Progress 8 by school type
Seven schools improved their P8 score by at least a third of a grade per subject (0.33 points) under the shadow method. As well as three grammar schools, these include two FE colleges and a studio school that were some way below the published floor standard.
By contrast, there were no schools whose P8 score fell by more than a third of a grade per subject, although there were eight that fell by a fifth of a grade per subject (0.2 points).
Impact on floor standards
It remains to be seen whether the floor standard will continue to be defined as a Progress 8 score of -0.5 in 2017.
Based on the interim points scores, the number of schools below the floor in 2015/16 increases from 282 to 358. Numbers of schools deemed to be coasting will similarly increase.
One difference between results in 2017 and these shadow results will be the inclusion of 9-1 grades for those subjects that will have moved over to the new grading system – English language, English literature and maths GCSEs.
This may well reduce the number of schools that would otherwise be judged to be below the floor standard, but nonetheless it is possible that more schools overall will be deemed to be below the floor standard.
The chart below shows how many schools fell below the published and shadow floor standards. We have divided schools into ten evenly sized groups based on the mean KS2 prior attainment of each cohort – higher numbers correspond to lower average prior attainment.
Number of schools below the KS4 floor standard by decile of mean KS2 prior attainment, 2016
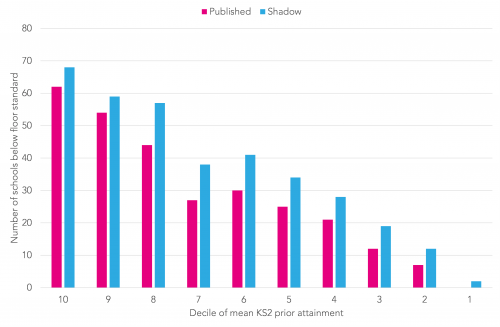
Note: Deciles are ordered from lowest average prior attainment (decile 10) to highest average prior attainment (decile 1)
Schools with lower-attaining intakes remain more likely to fall below the floor under the shadow method, although the greatest increase in the numbers below the floor standard happens to schools with slightly higher prior attainment.
The good thing about the interim points scale
The principal objection to the interim points scale so far has been the unequal intervals between grades – the interval between grade A and grade B is three times the size of the interval between grade E and grade F, for example. Perhaps this will encourage greater focus on higher attainers at the expense of lower attainers – something that DataEducator has written about.
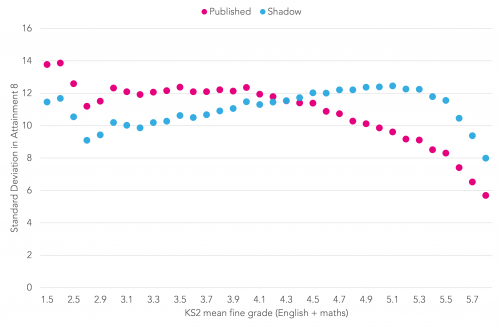
Nonetheless the interim points scale does have at least one attractive statistical property – though this will be cold comfort to schools falling below the floor standard. The spread of P8 scores is more evenly balanced across the prior attainment groups.
The chart below shows show the standard deviation in P8 scores. The very top end of the prior attainment distribution notwithstanding, the standard deviations of the shadow P8 scores are much more consistent between the prior attainment bands.
Standard deviation in Progress 8 scores by KS2 prior attainment band, 2016
New dawn fades
Changing the points scale used in Attainment 8 calculations matters.
Based on data for 2015/16 it seems that we might end up widening attainment gaps and increasing the number of schools below the floor standard merely as a consequence of the numbers that get attached to GCSE grades.
As we wrote over two years ago, it may be that the proposed 2017 points more accurately reflect the degree of difficulty between grades at GCSE.
But what is perhaps unfair is the lack of consistency between 2016 and 2017, and the additional volatility that the change may introduce, particularly for schools with lower ability intakes.
Want to stay up-to-date with the latest research from Education Datalab? Sign up to our mailing list to get notifications about new blogposts, or to receive our half-termly newsletter.


Good analysis, extra points for Joy Division track titles as headings.