KS2 performance tables 2018: Why aren’t floor standards based on three-year averages?
Analysis of the latest primary league tables.
Analysis of the latest primary league tables.
The first table in this post was updated at 17.42 on 25 January 2018 after we noticed – of all things – that percentages in the table did not add up to 100. We very much regret the error. Key Stage 4 league tables – performance tables, to use their proper name – have been published this [...]
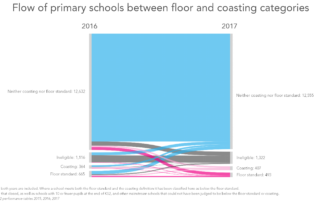
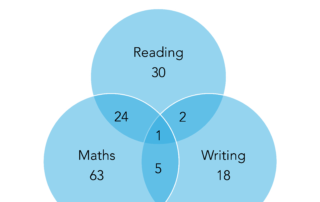
We’ve already looked at the number of schools judged to be below the floor standard, and to be coasting, based on the Key Stage 2 performance tables data published this morning. But, looking a little deeper, how stable are these classifications – how many schools that ended up in one of these groups last year [...]
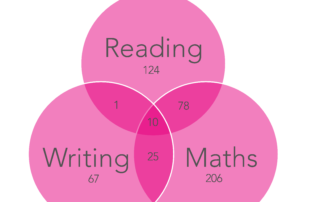
Key Stage 2 league tables – performance tables, to use their proper name – have been published this morning, identifying those schools below the government’s floor standard, and those judged to be coasting. So what can we say about the schools in these two groups? And are junior schools still more likely to fall into [...]
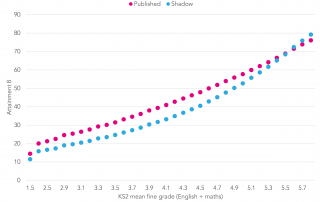
Towards the end of last month, the Department for Education published ‘shadow’ Attainment 8 data for 2015/16 [PDF]. This shows the impact of moving from the familiar scoring of A*-G grades – one point for grade G, up to eight points for grade A* – to the interim scale that will be used in 2016/17 [...]
The question of how floor standards are defined is one that – to all heads, but particularly those who might be at risk of not meeting them – is obviously of great importance. And there are clearly numerous ways in which a floor standard could be defined. (We leave to one side the question of [...]