This is the third year that results in the new Key Stage 2 tests and teacher assessments have been published.
The Department for Education has marked the occasion by re-introducing three-year averages for some attainment indicators, a sensible idea given that almost half of published schools’ results in any given year are based on 30 pupils or fewer.
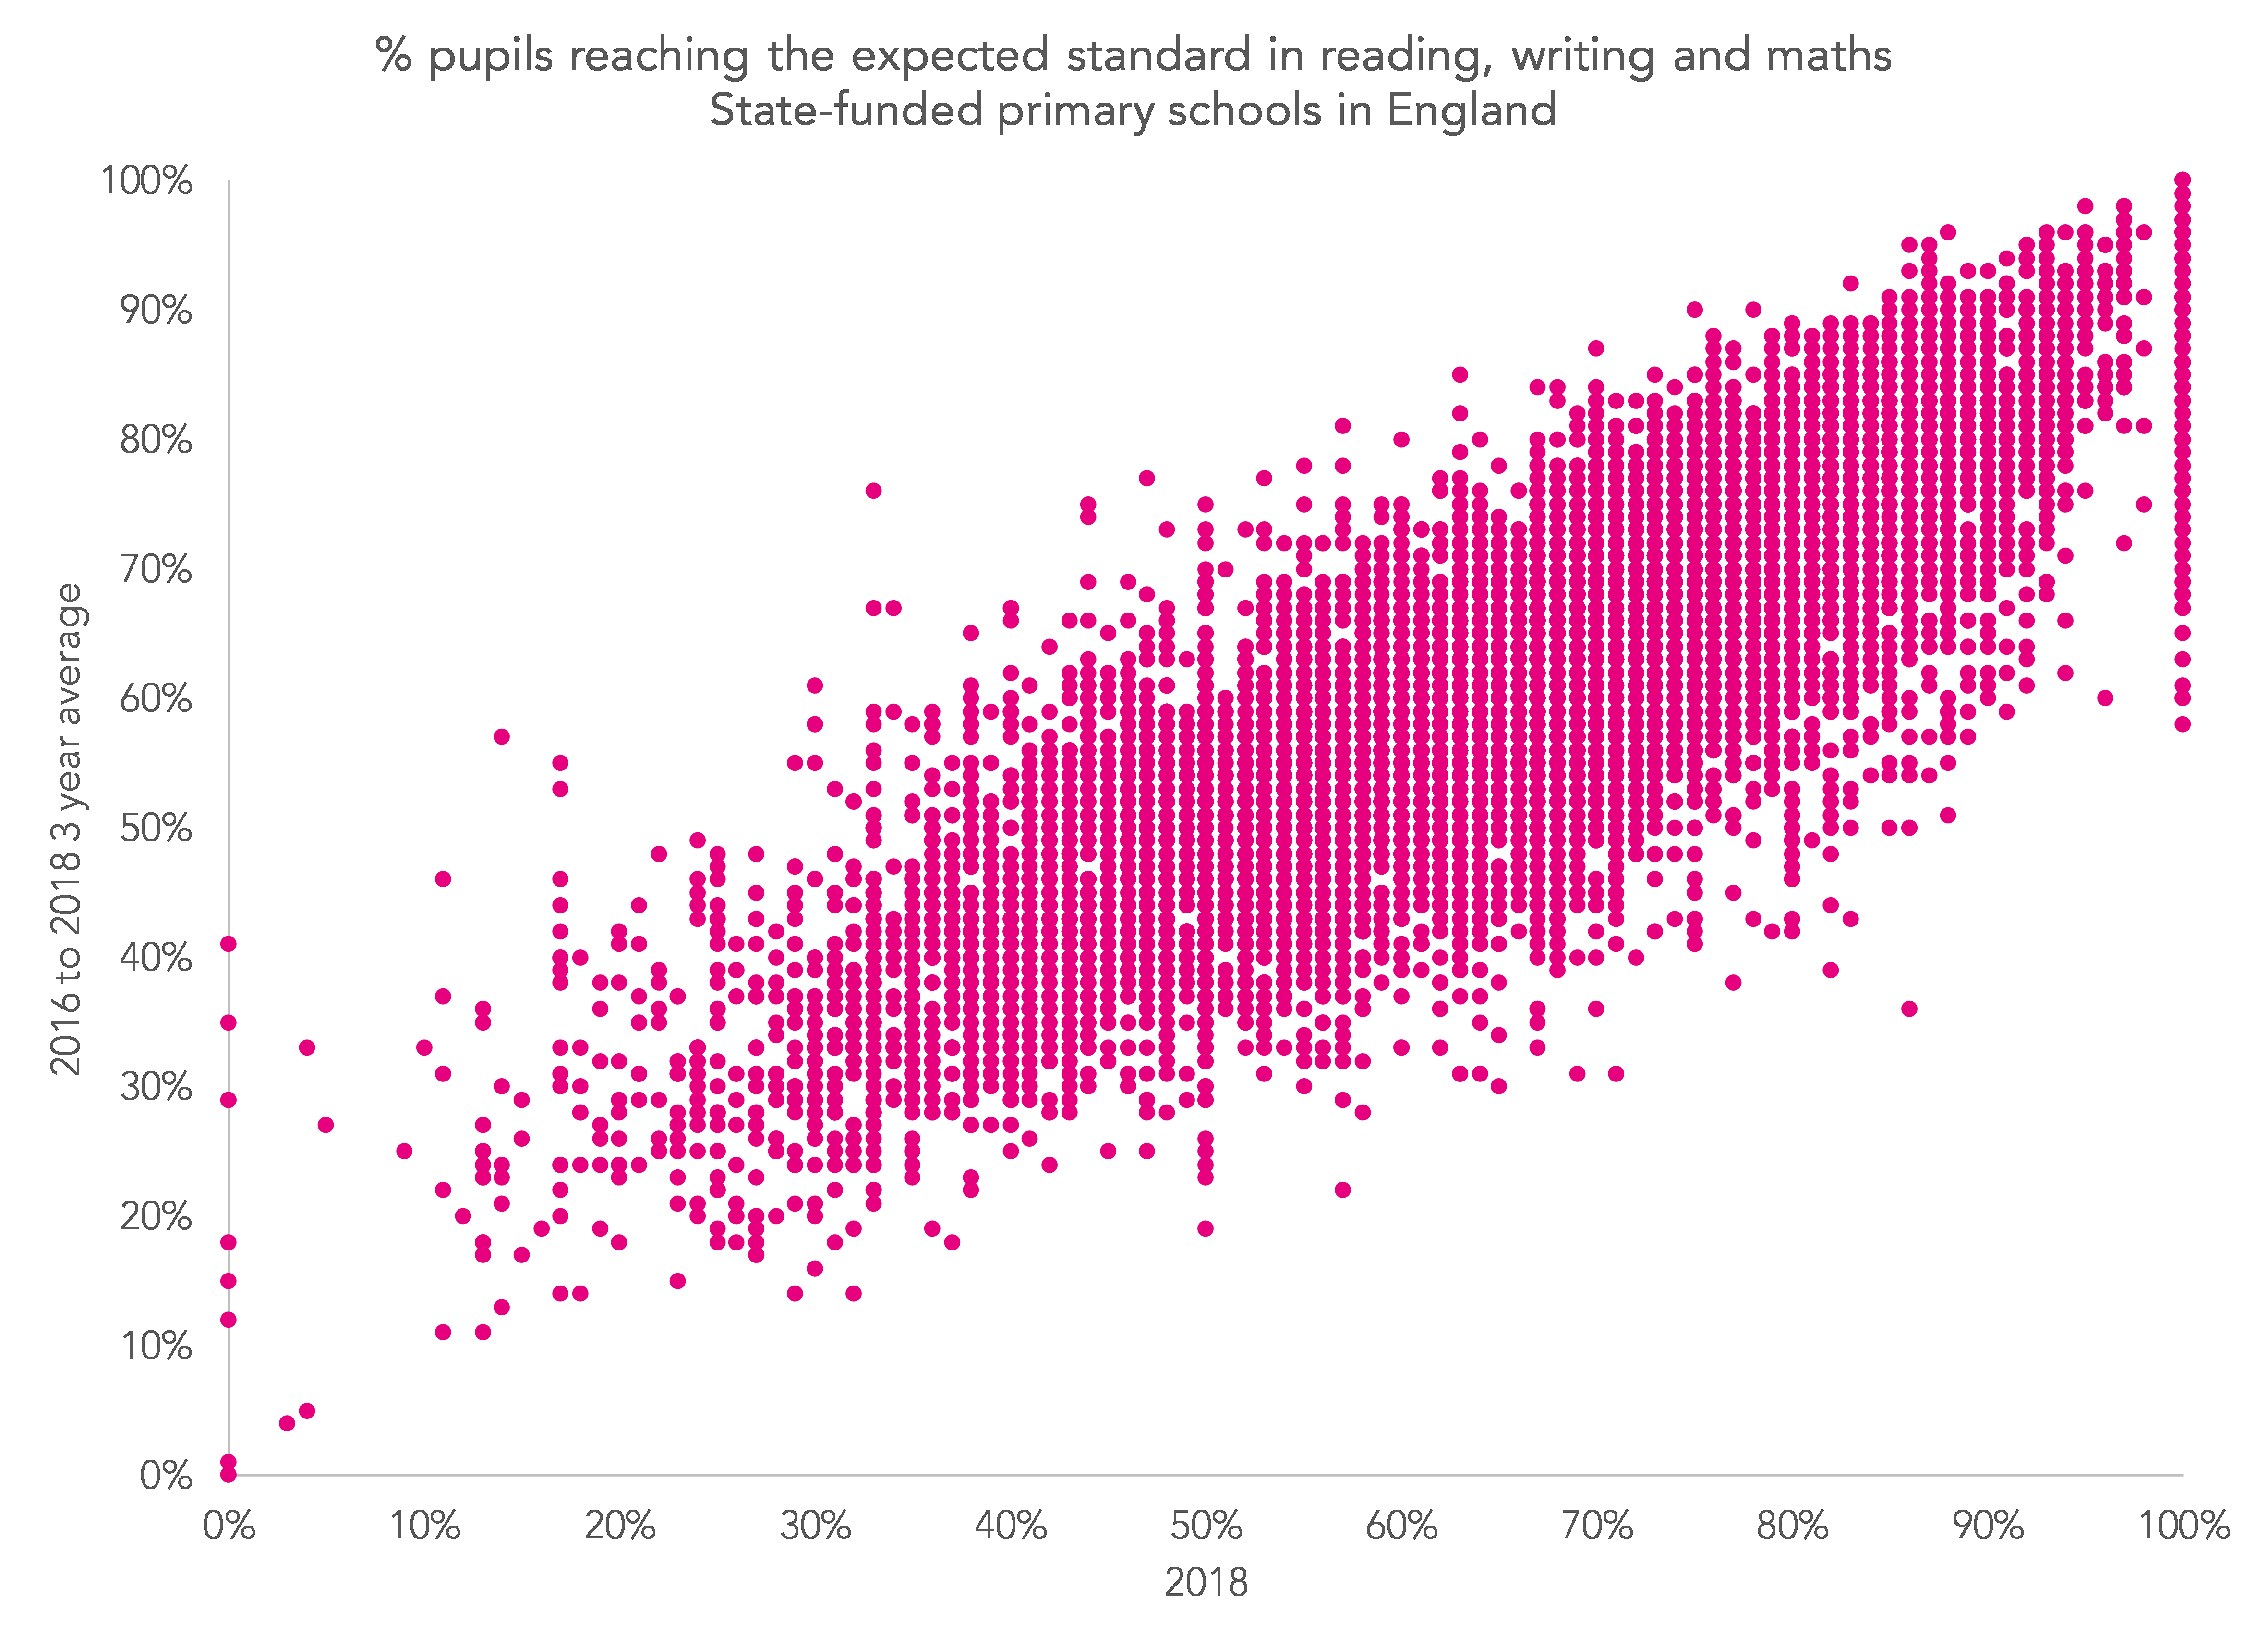
As the chart below shows for the percentage of pupils achieving the expected standard in reading, writing and maths, there are substantial differences between the three-year average and the 2018 average for some schools (the overall correlation is 0.83).
However, three-year averages for value added indicators have not been published. This is curious because value added measures tend to change more from year to year than attainment indicators. The reason for this is that a large proportion of schools’ attainment measures are due to prior attainment. Once it is removed, statistical noise accounts for a greater proportion of what is left.
In addition, the DfE has also toned down the message around its floor standards, which value added measures feature heavily in. This was signalled by Education Secretary Damien Hinds in May – with the emphasis expected to shift to providing support for poorly performing schools, rather than more punitive action.
So let’s have a look at the impact on floor standards of switching to three-year average for value added indicators.
Floor standards in 2018
A total of 386 schools were below the floor standard in 2018, including schools which have subsequently closed. These are schools where fewer than 65% of pupils achieved the expected standard in each of reading, writing and maths, and which fell below at least one minimum threshold[1] for value added in reading, writing or maths.
This would have been 434 schools if the method of capping extremely negative value added scores had not been introduced.
The chart below shows the subjects in which schools have fallen below the threshold.
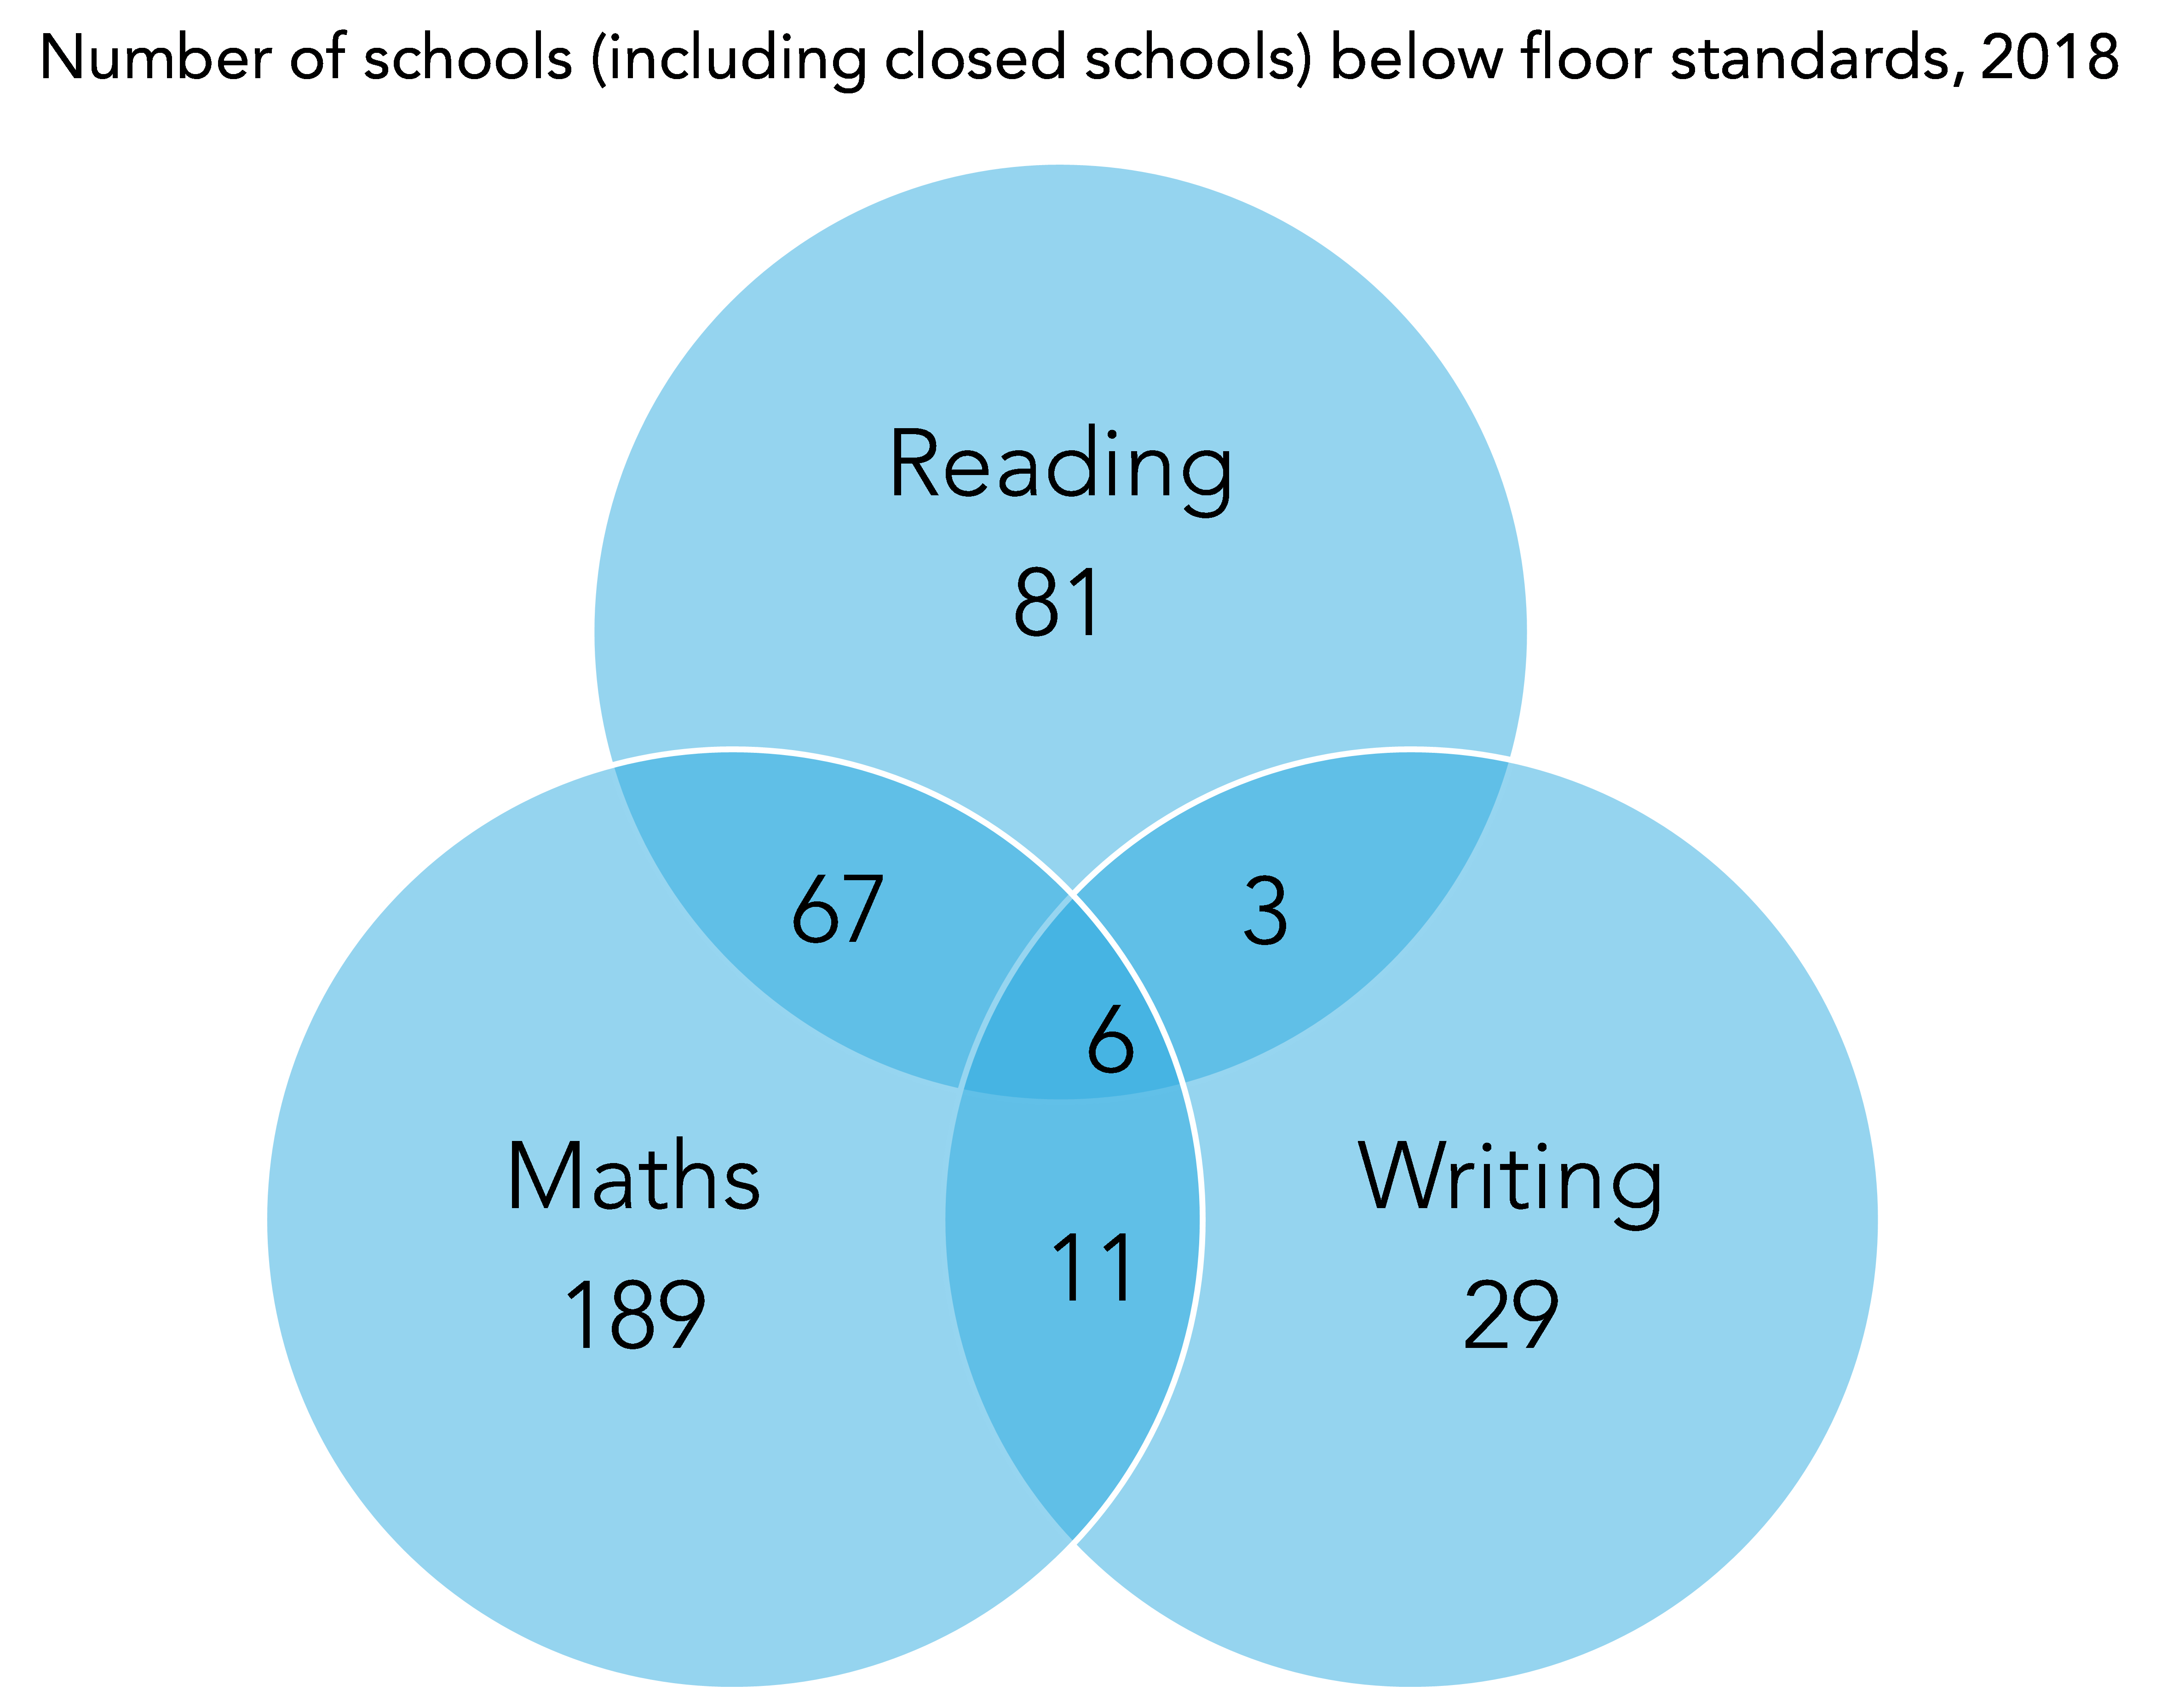
Looking at the 386 schools below the floor, for the most part they fell below the minimum value added threshold in just one subject, often maths.
Where possible, we’ve calculated three-year averages for the value added measures. For 353 of the 386 schools below the floor there was a full set of data published in each of the three years.
Just 75 of the 353 would have fallen below the floor if it was based on three years’ data. In addition, a further 68 schools above the floor in 2018 would be below it if based on three years’ data.

So what this shows is that value added indicators for primary schools tend not to be that extreme when calculated over a number of years. This is particularly so for small schools. A total of 56 of the 353 schools below the 2018 floor with three years of data had fewer than 15 Year 6 pupils in 2018. Just eight would have been below the floor based on three years of data.
Want to stay up-to-date with the latest research from FFT Education Datalab? Follow us on Twitter to get all of our research as it comes out.
1. These minimum thresholds for value added are -5 for reading and maths, -7 for writing.


Leave A Comment