Update 14 December 2018, 09.45: The first three charts in the post have been updated. An earlier version had the axes labels reversed.
Primary school league tables have been published this morning. We’ve already looked at the new three-year average attainment measures that feature in this year’s data, and here we’ll round up some of the other main points of interest.
Unadjusted v adjusted progress scores
For the first time, reading, writing and maths progress scores have been adjusted to strip out the impact of extreme negative scores – the calculation is based on the performance of the bottom 1% of pupils in each of the subjects [PDF]. In many cases, scores such as these will have arisen where a pupil has been a serial non-attender, or has had serious medical issues.
What impact does this have? The three charts below plot the adjusted scores against the unadjusted scores, for reading, writing and maths respectively.
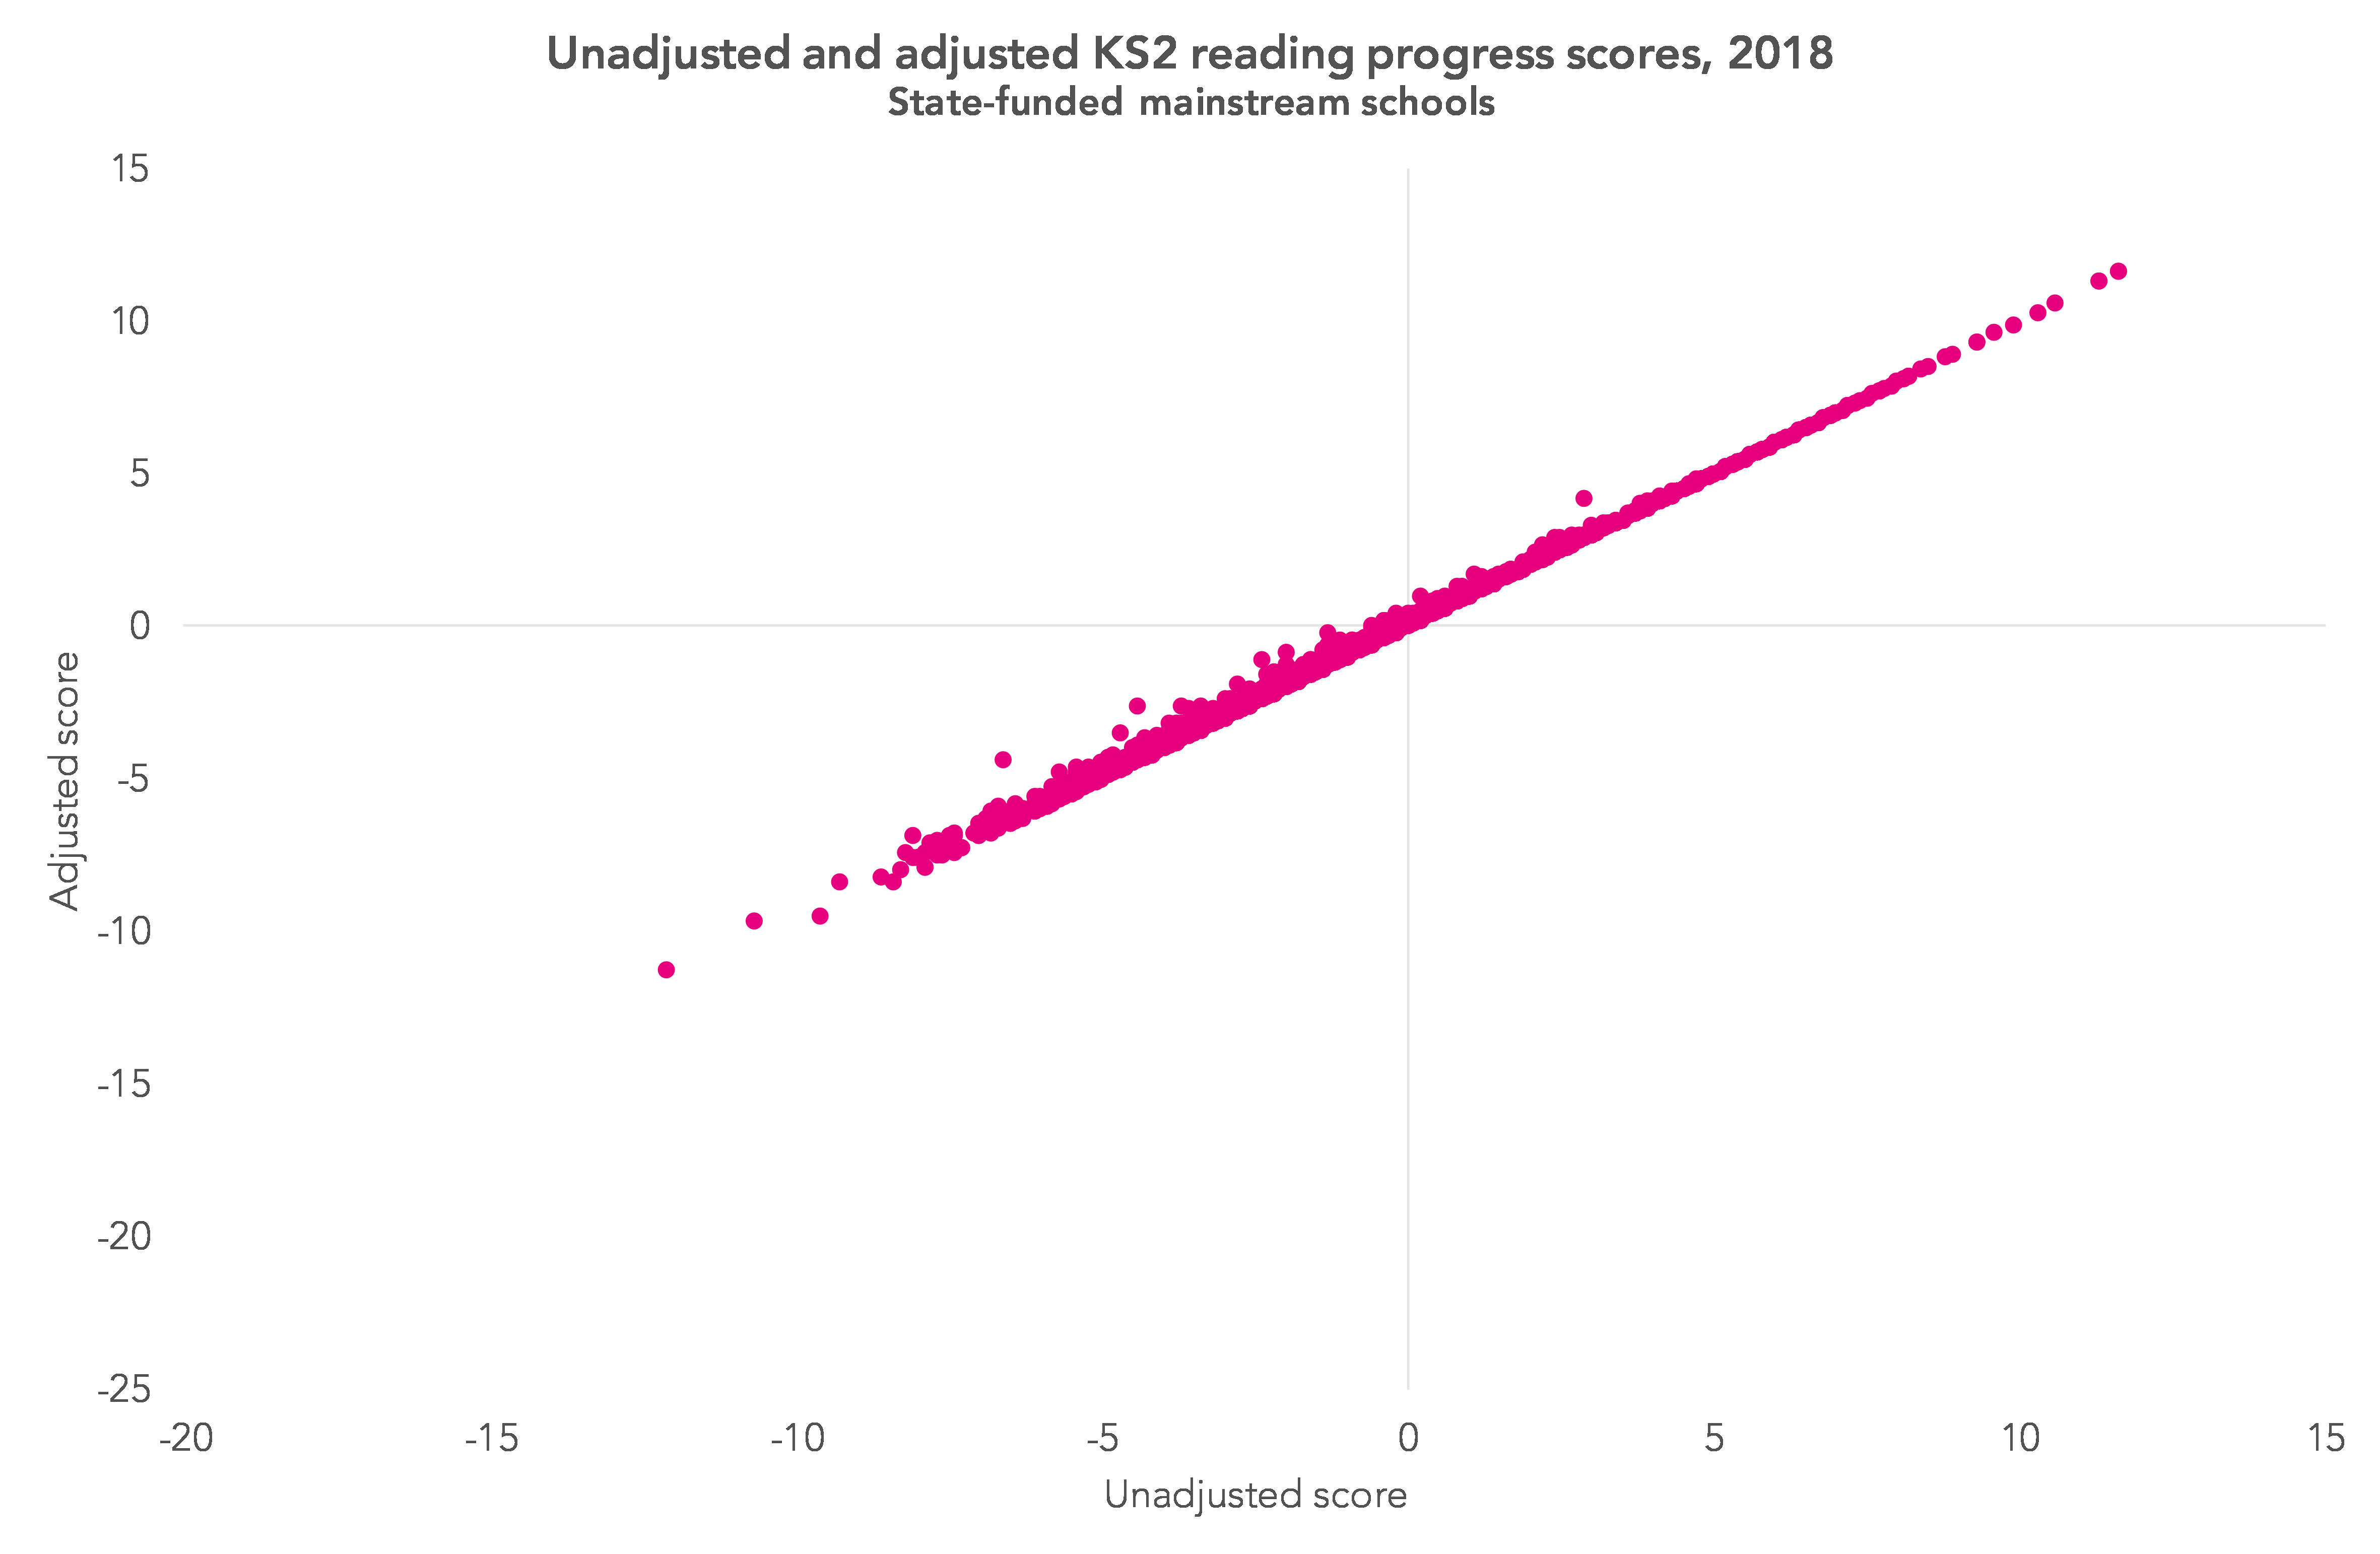
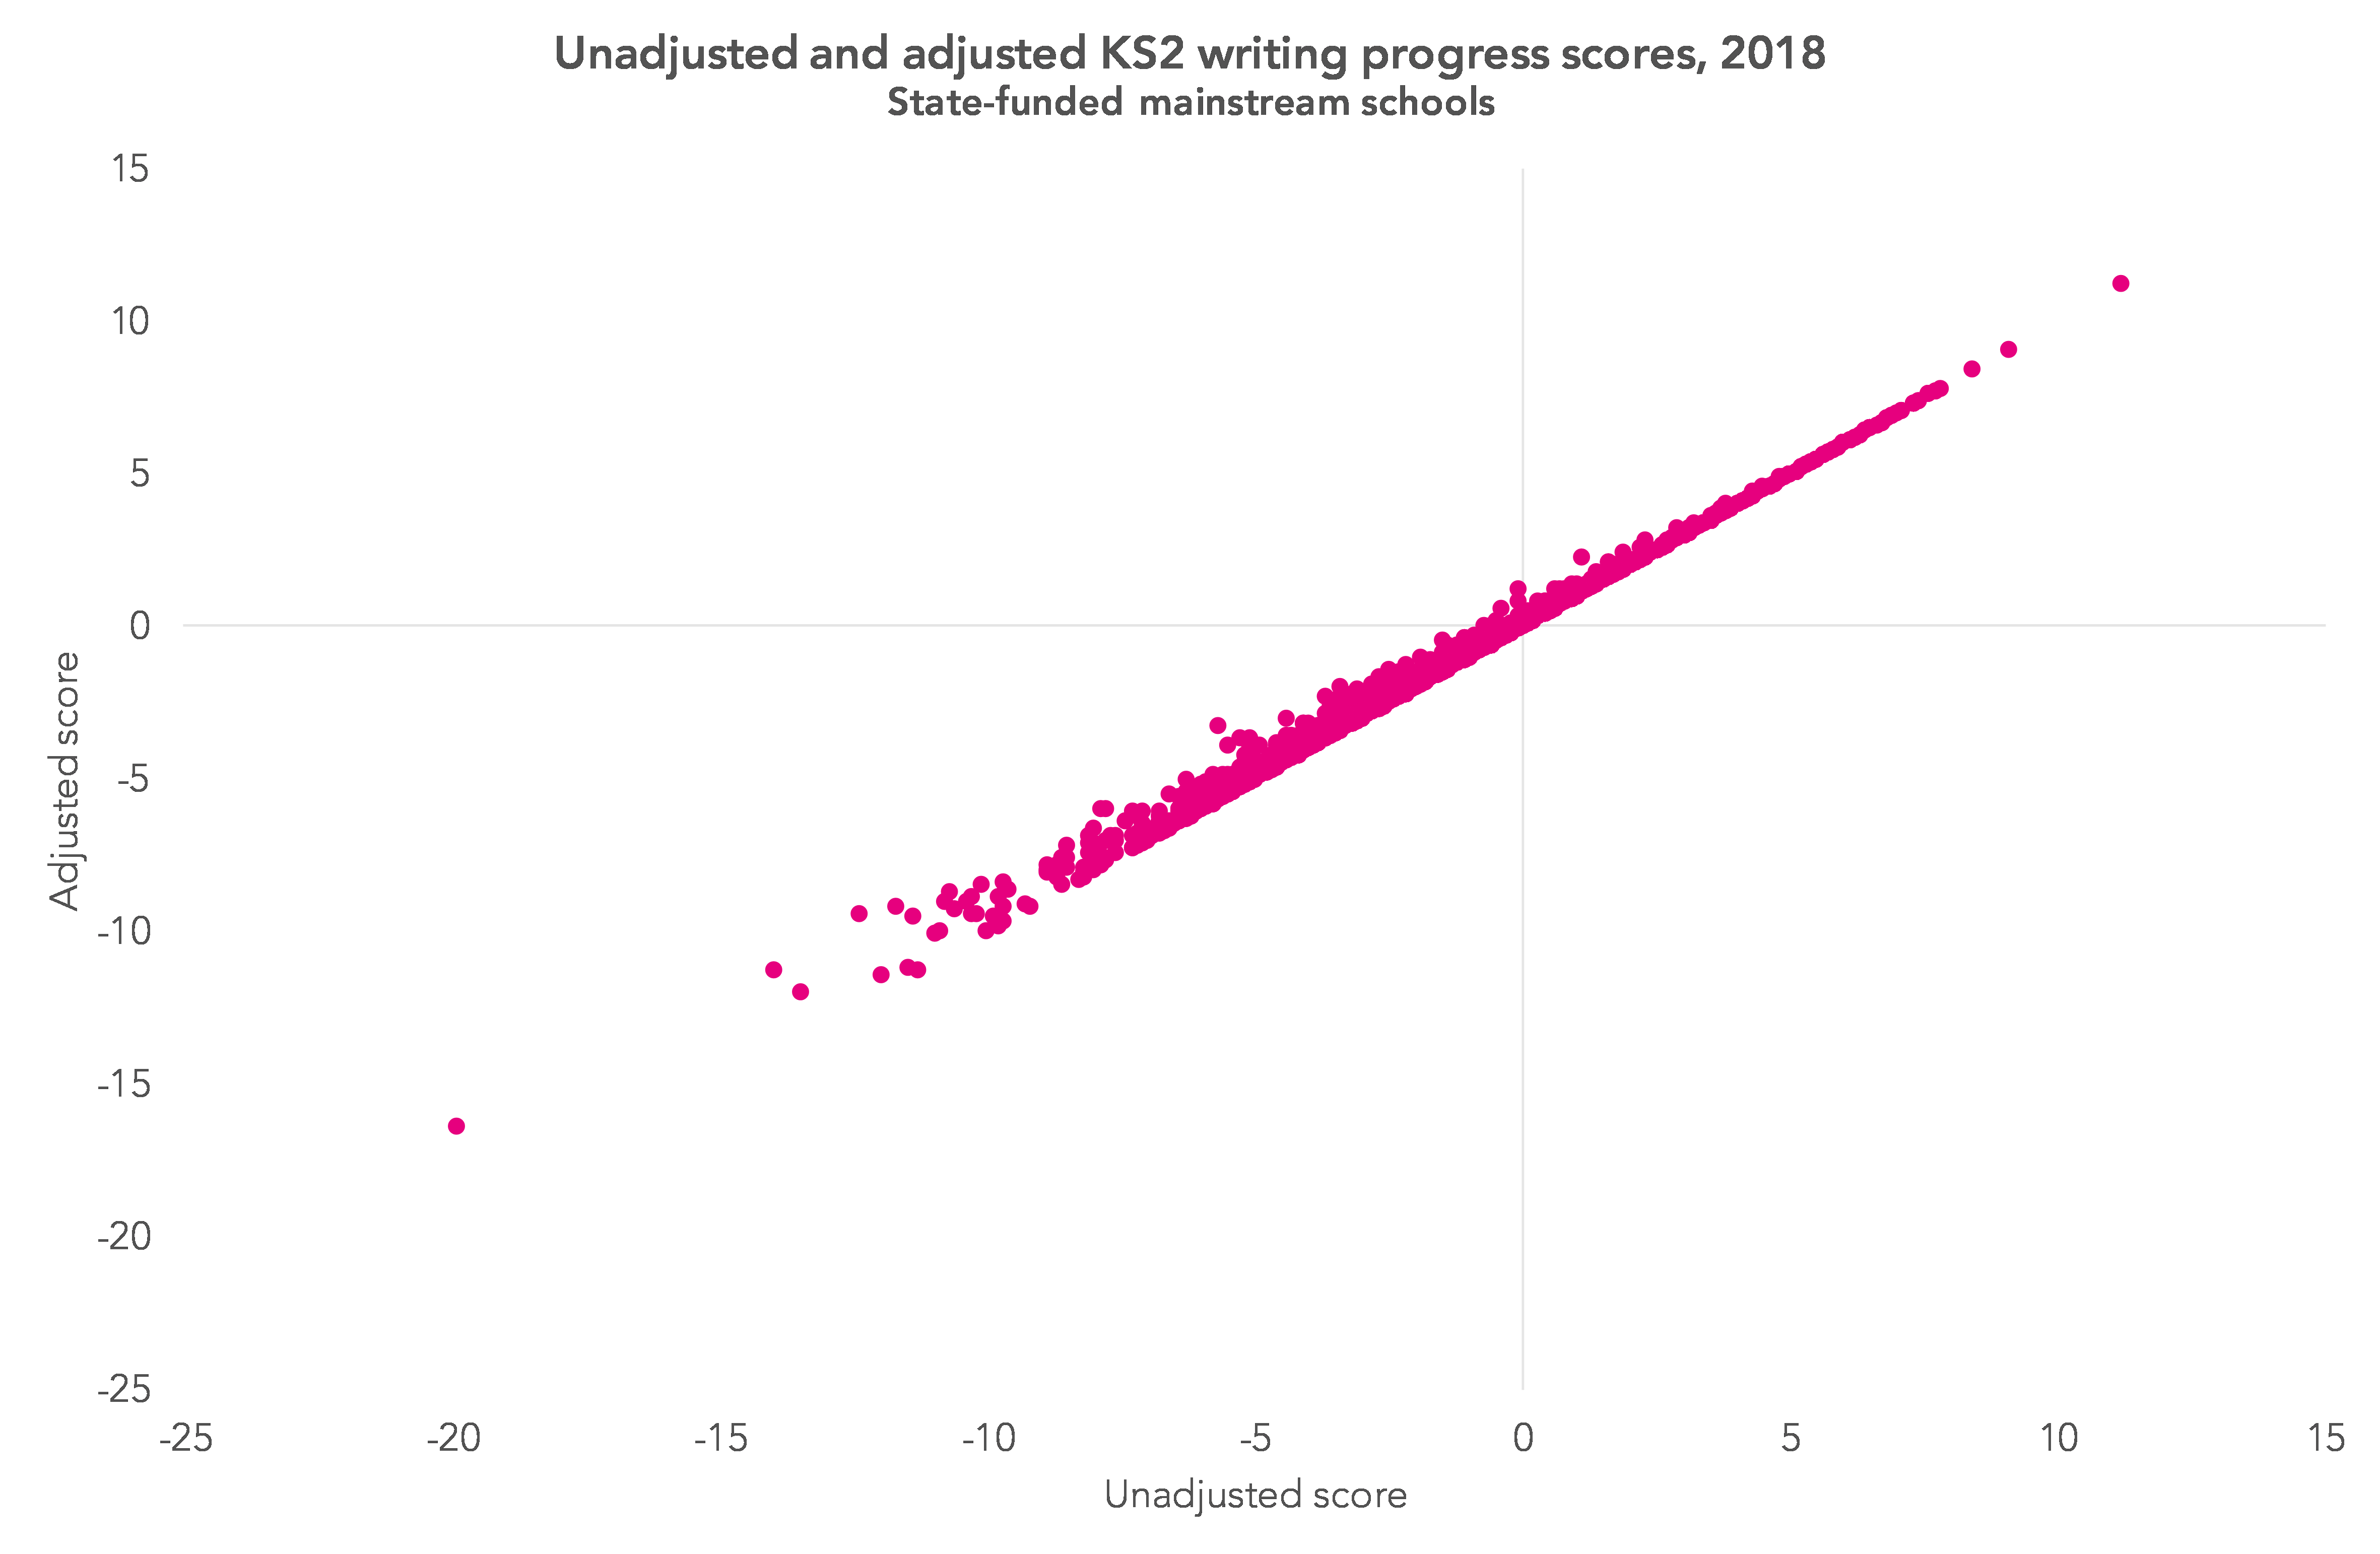

Overall, as we found with similar capping introduced at Key Stage 4, the impact is pretty small.
The vast majority of schools – in the region of 13,000 out of more than 14,500 state-funded mainstream schools, for each of the three subjects we’re talking of – see no impact at all.
And of those that do see an impact, the impact is generally not large.
In reading, 49 schools see their progress score shift by more than 0.5; in writing the number is a little greater, at 150 schools; while in maths 67 schools benefit from the cap.
Though while relatively small in impact, the cap is likely to be welcomed by those schools that benefit from it.
The high attainment disadvantage gap is increasing
On the Department for Education’s preferred measure – the ‘disadvantage attainment gap index’ – the gap in attainment between disadvantaged pupils and their peers has decreased again [PDF], continuing a trend since at least 2011.
Continuing something that we picked up on last year, however, the attainment gap in meeting the higher standard in reading, writing and maths has grown – up from 5 percentage points in 2016, to 7 percentage points last year and 8 percentage points this year.
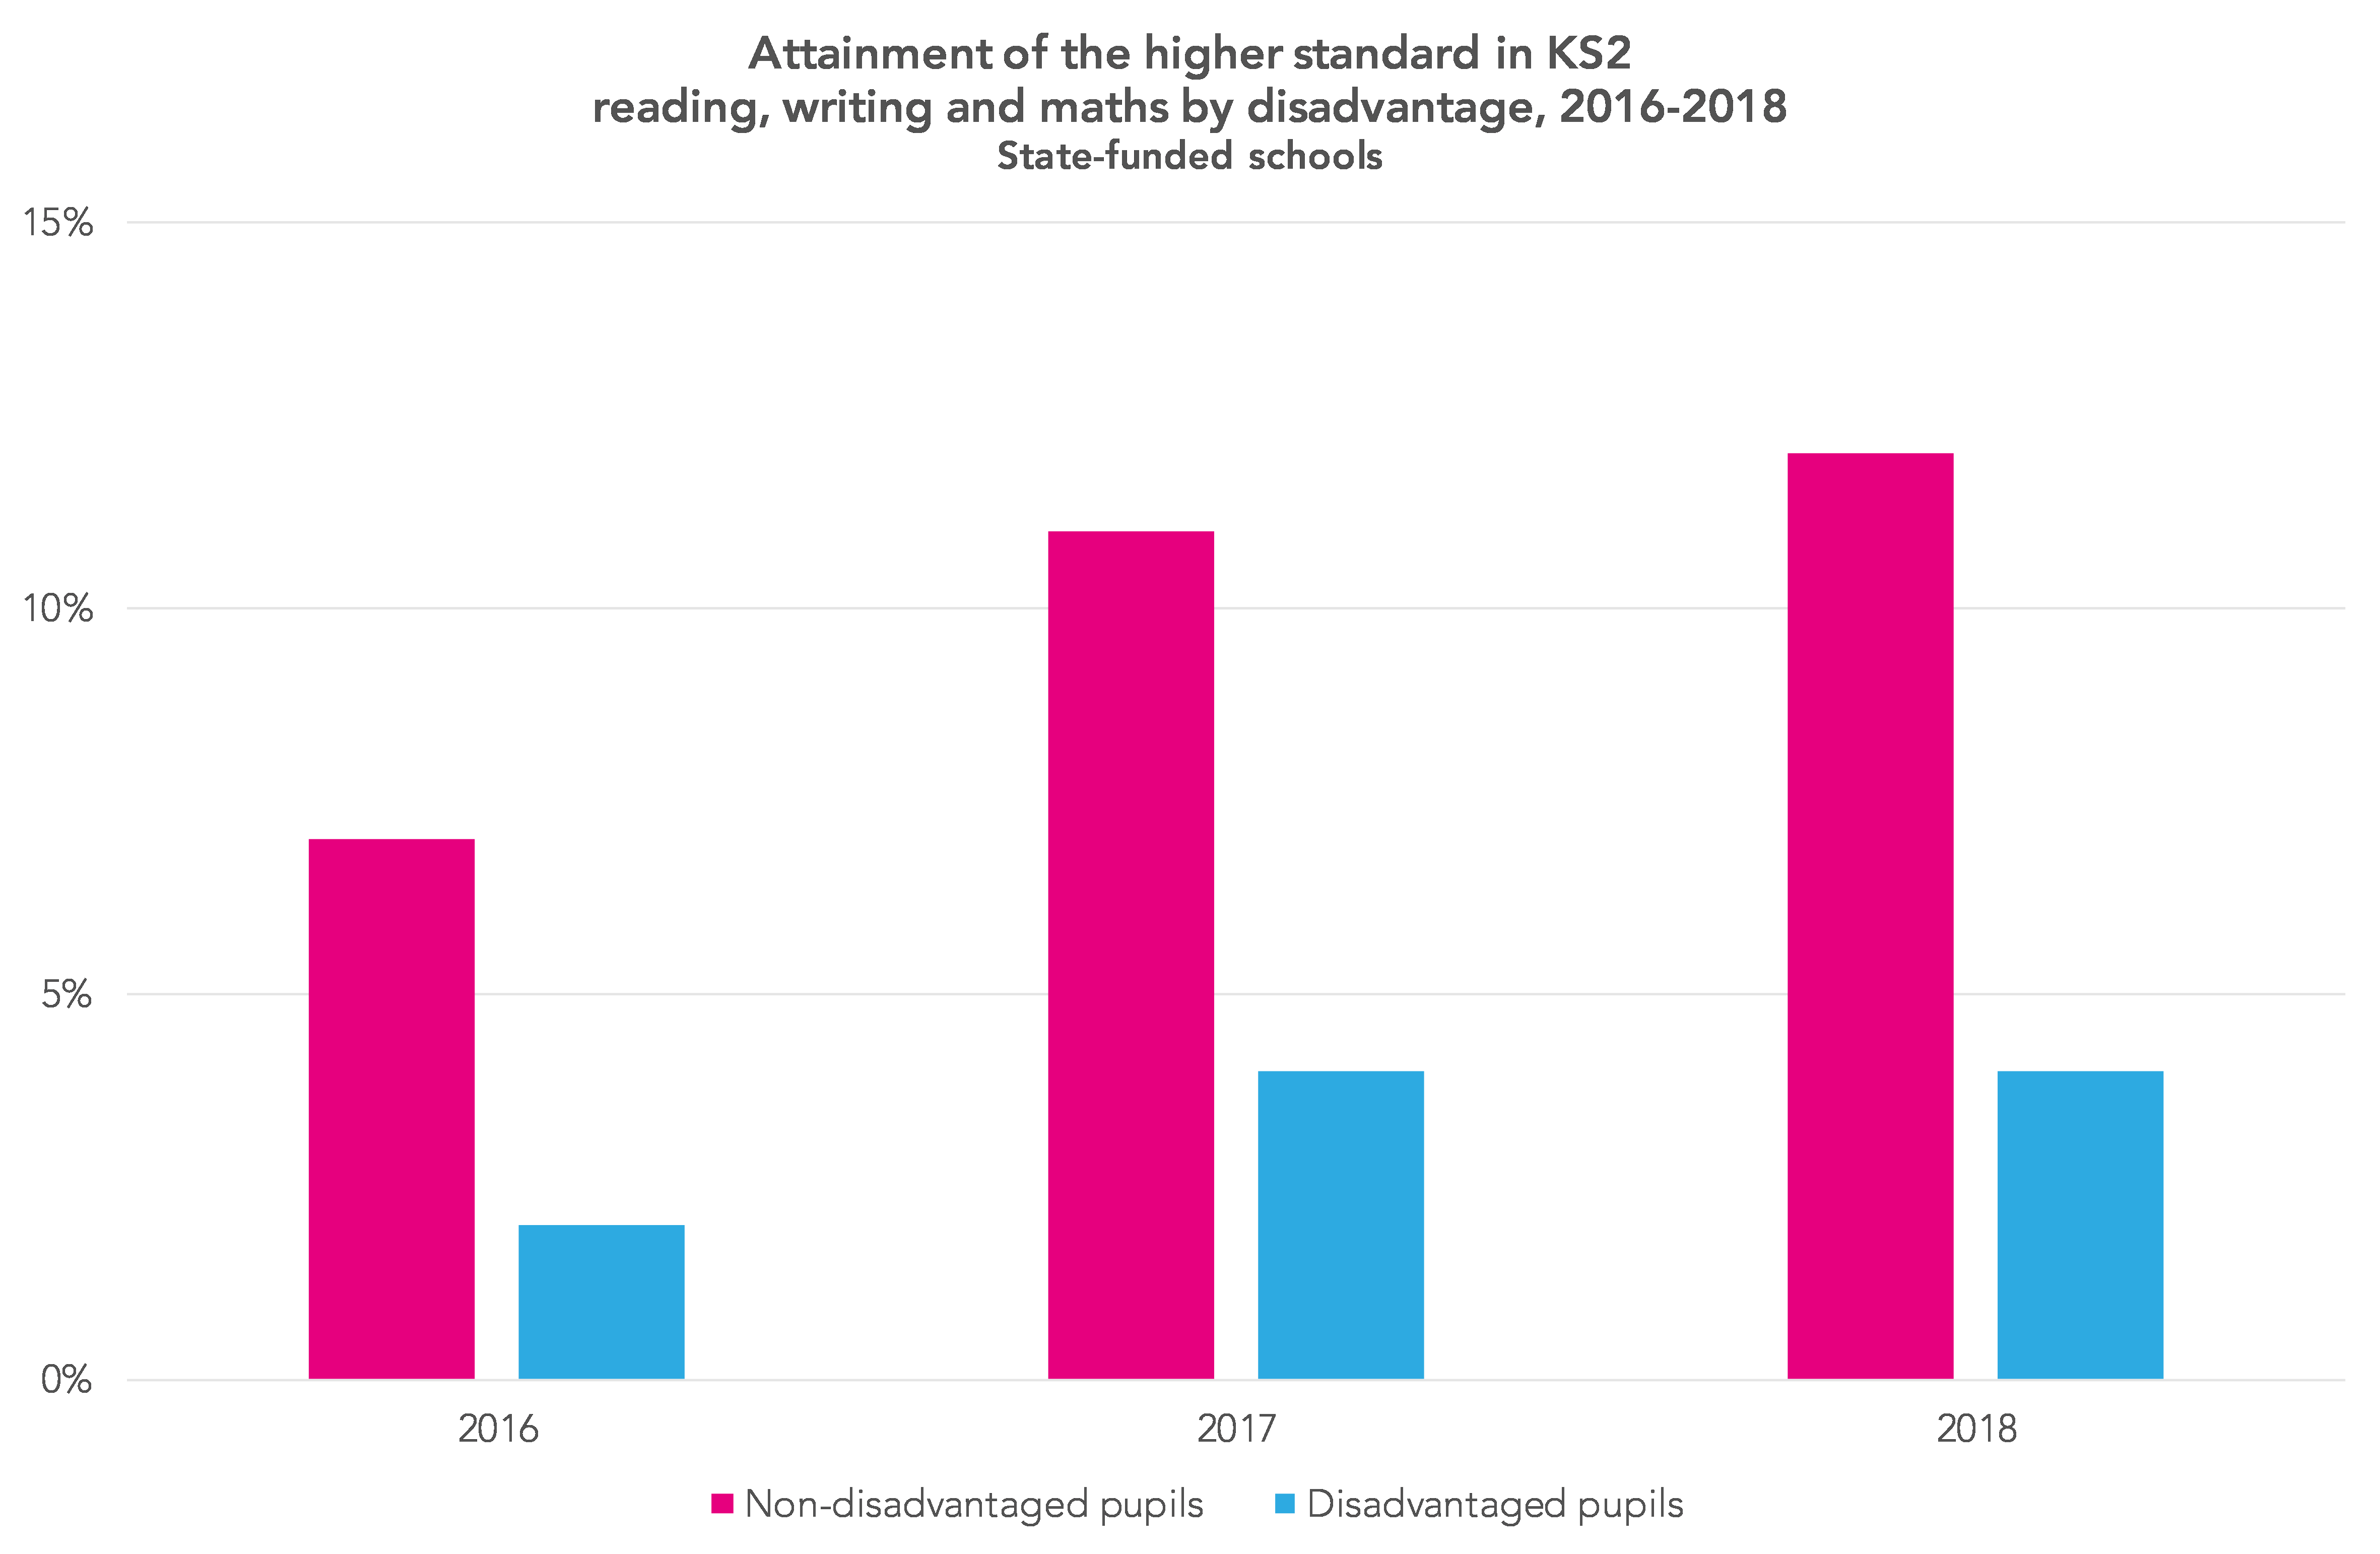
Given that disadvantaged pupils are more likely to be found at the lower end of the attainment distribution, these apparently contradictory findings would suggest that the gap has closed for lower attainers.
Trends by ethnicity
It’s worth also looking briefly at attainment by ethnicity.
Attainment is increasing for each of the main ethnic groups, but the greatest increase between 2016 and 2018 has been for black and Asian pupils. For both of these groups, attainment of the expected standard in reading, writing and maths has increased by 13 percentage points (from 50% to 63% for black pupils, and from 55% to 68% for Asian pupils), as the chart below shows.

We need to be a little careful when working with threshold measures such as these, which measure the proportion of students hitting a certain level. As we’ve written before, they effectively give great focus to the group who’ve been slightly below the threshold in previous years.
If in previous years there have been lots of pupils just below the threshold, there’s greater potential for big increases in future years.
So, while worth recognising, this phenomenon is likely to have played a part in the scale of the increase seen for black pupils between 2016 and 2018 (less so for Asian pupils).
Want to stay up-to-date with the latest research from FFT Education Datalab? Follow us on Twitter to get all of our research as it comes out.


Leave A Comment