Key Stage 2 league tables – performance tables, to use their proper name – have been published this morning, identifying those schools below the government’s floor standard, and those judged to be coasting.
So what can we say about the schools in these two groups? And are junior schools still more likely to fall into one of the two groups?
Schools below the floor standard
The floor standard has the same definition this year as in 2016. Namely, that a school is considered to be below the floor standard if two criteria are met:
- the percentage of pupils reaching the expected standard in reading, writing and maths was below 65%; and
- any one of three progress measures was below a certain standard:
- reading progress was below -5; or
- writing progress was below -7; or
- maths progress was below -5.
This year, 511 out of 13,633 primary schools[1] have fallen below the government’s floor standard this year – some way lower than the 665 below the floor standard last year.
Last year we looked at the reasons why schools fell below the floor standard.
Unlike last year, this year there were nine schools that had 65% or more of pupils at the expected standard in reading, writing and maths, and yet progress below the required standard in either reading, writing or maths – so the 65% part of the definition did play a role this year.
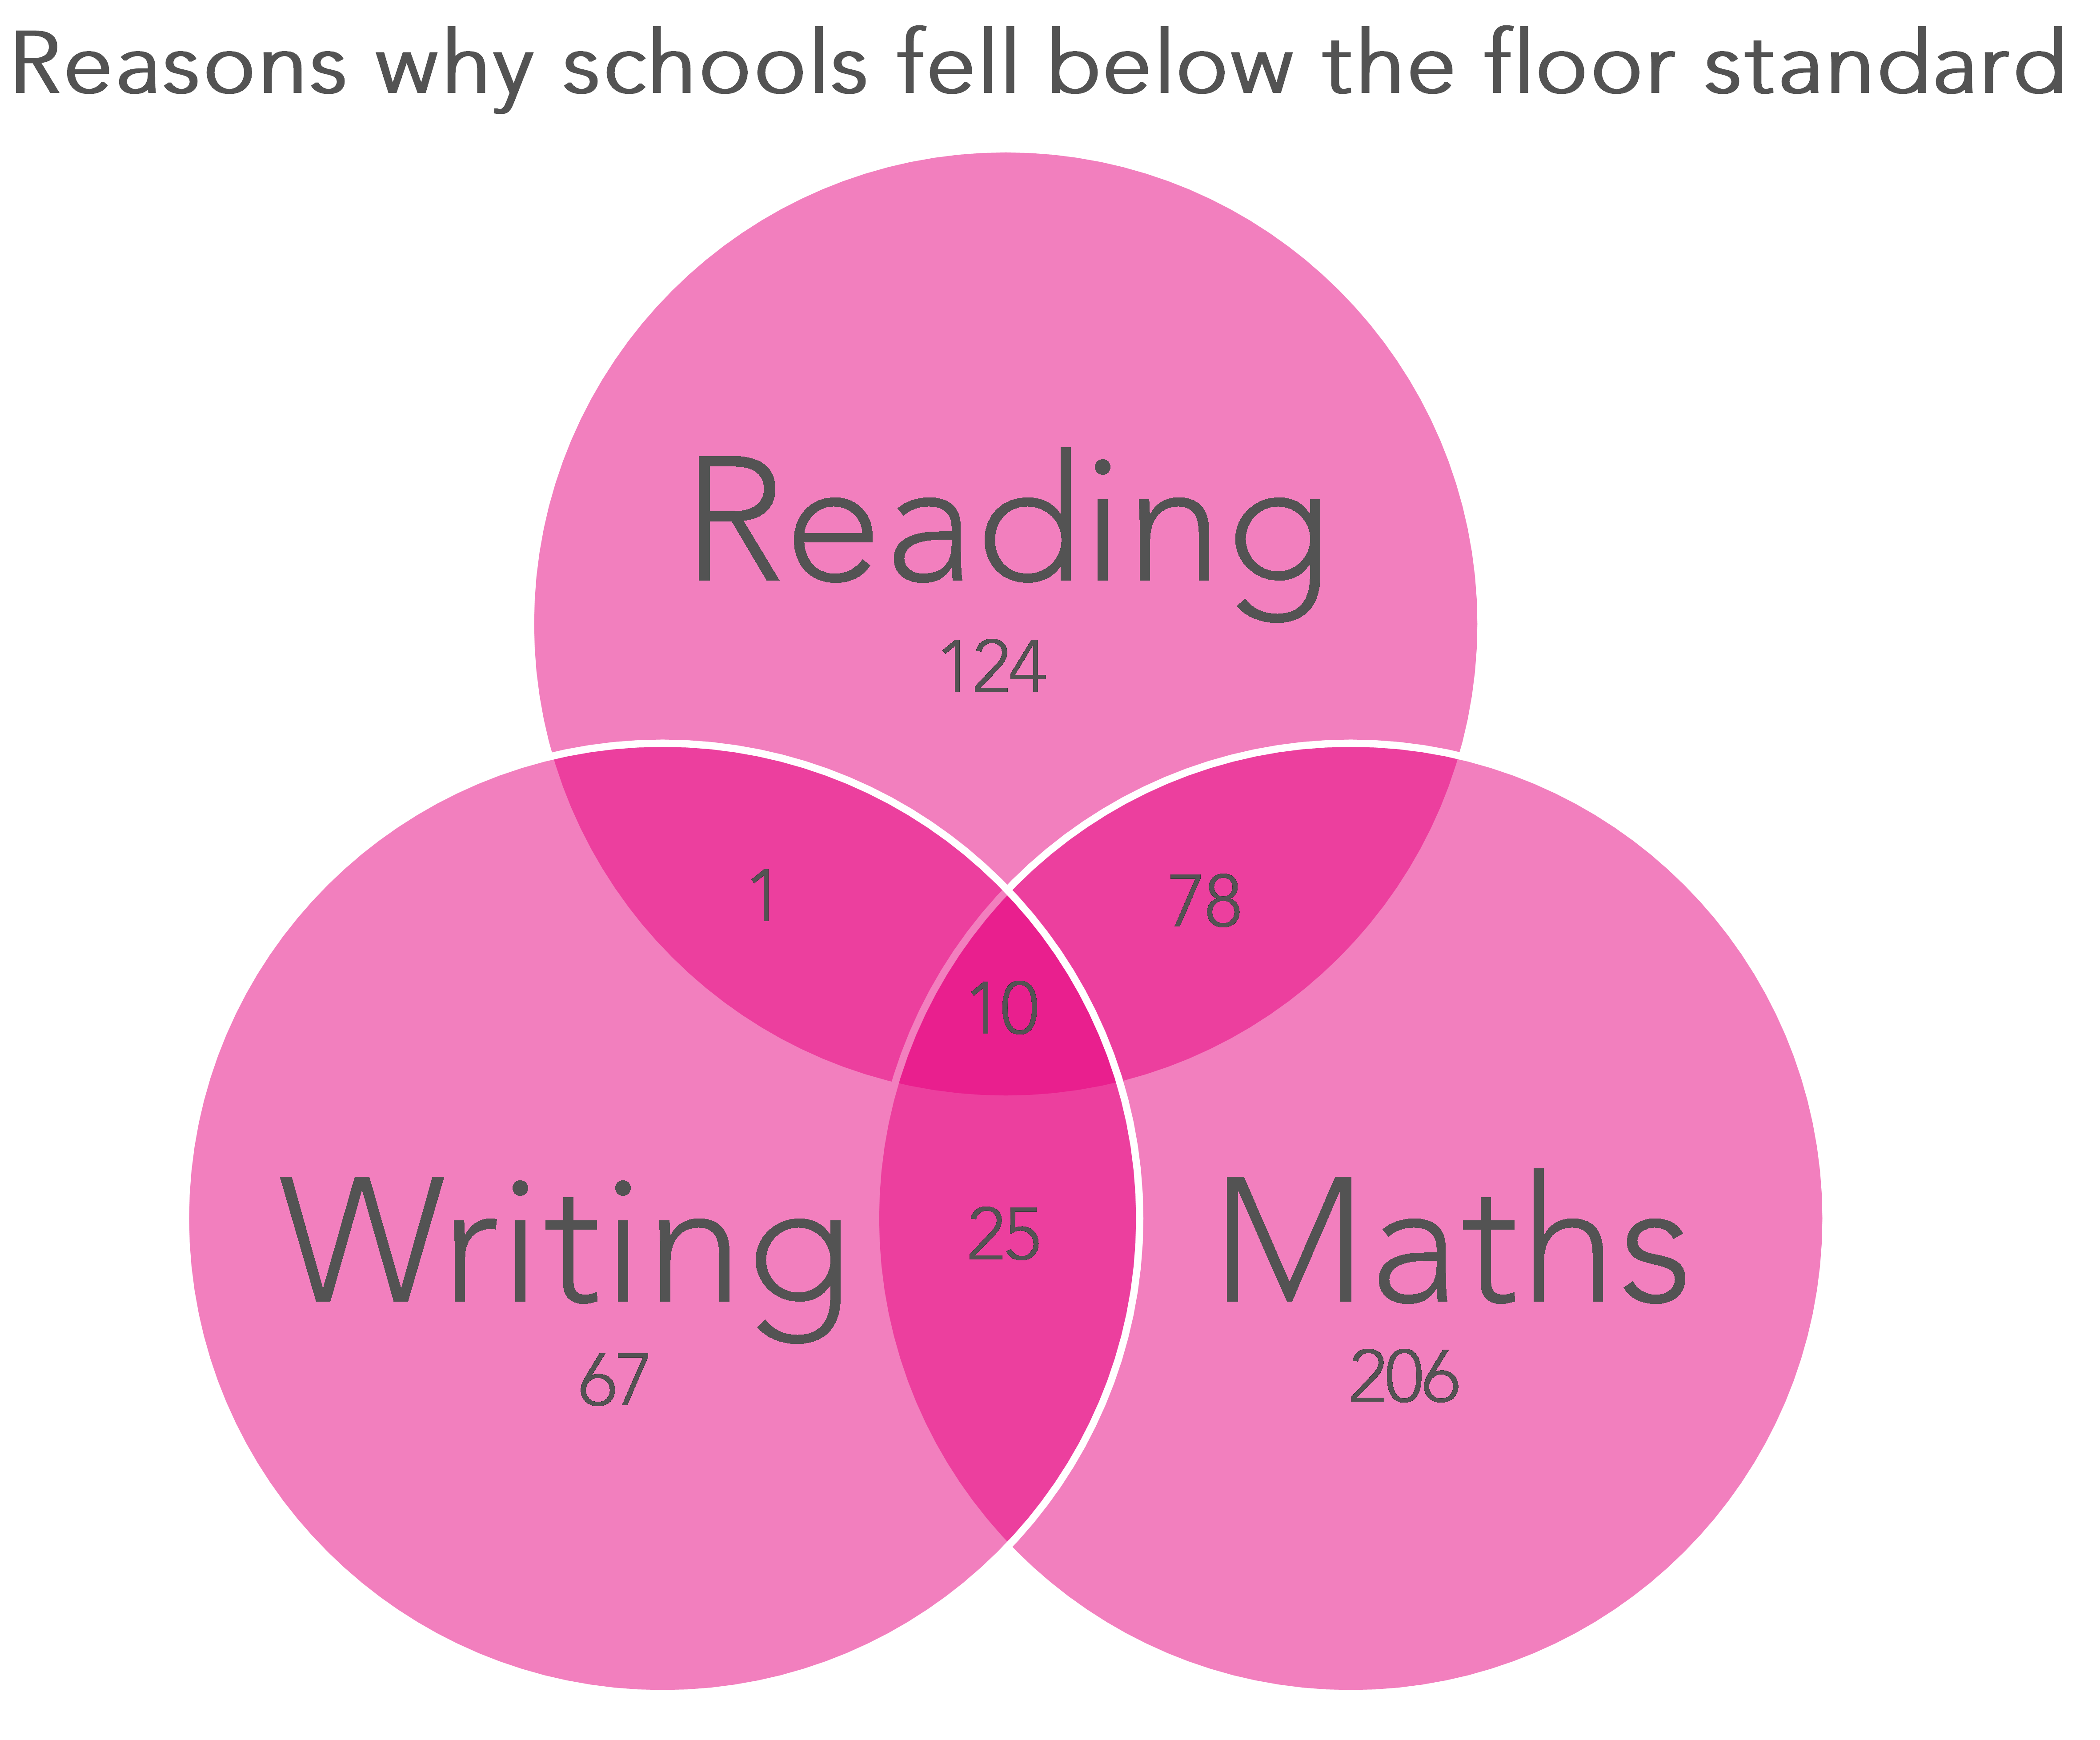
And this year, maths was by some margin the reason why schools were more likely to end up below the floor standard – a total of 319 did not meet the required standard in maths, versus 213 for reading and 103 for writing. The Venn diagram below shows the full breakdown of reasons why schools fell below the floor standard.
One point to note: given concerns about the accuracy of writing teacher assessment, where a school is below the floor standard or judged to be coasting based on its performance in writing alone the Department for Education has advised that “the local authority or RSC should not intervene or issue a warning notice, except where the extent of the change in performance cannot be explained by the impact of the changes to primary assessment arrangements in these transitional years” [PDF].
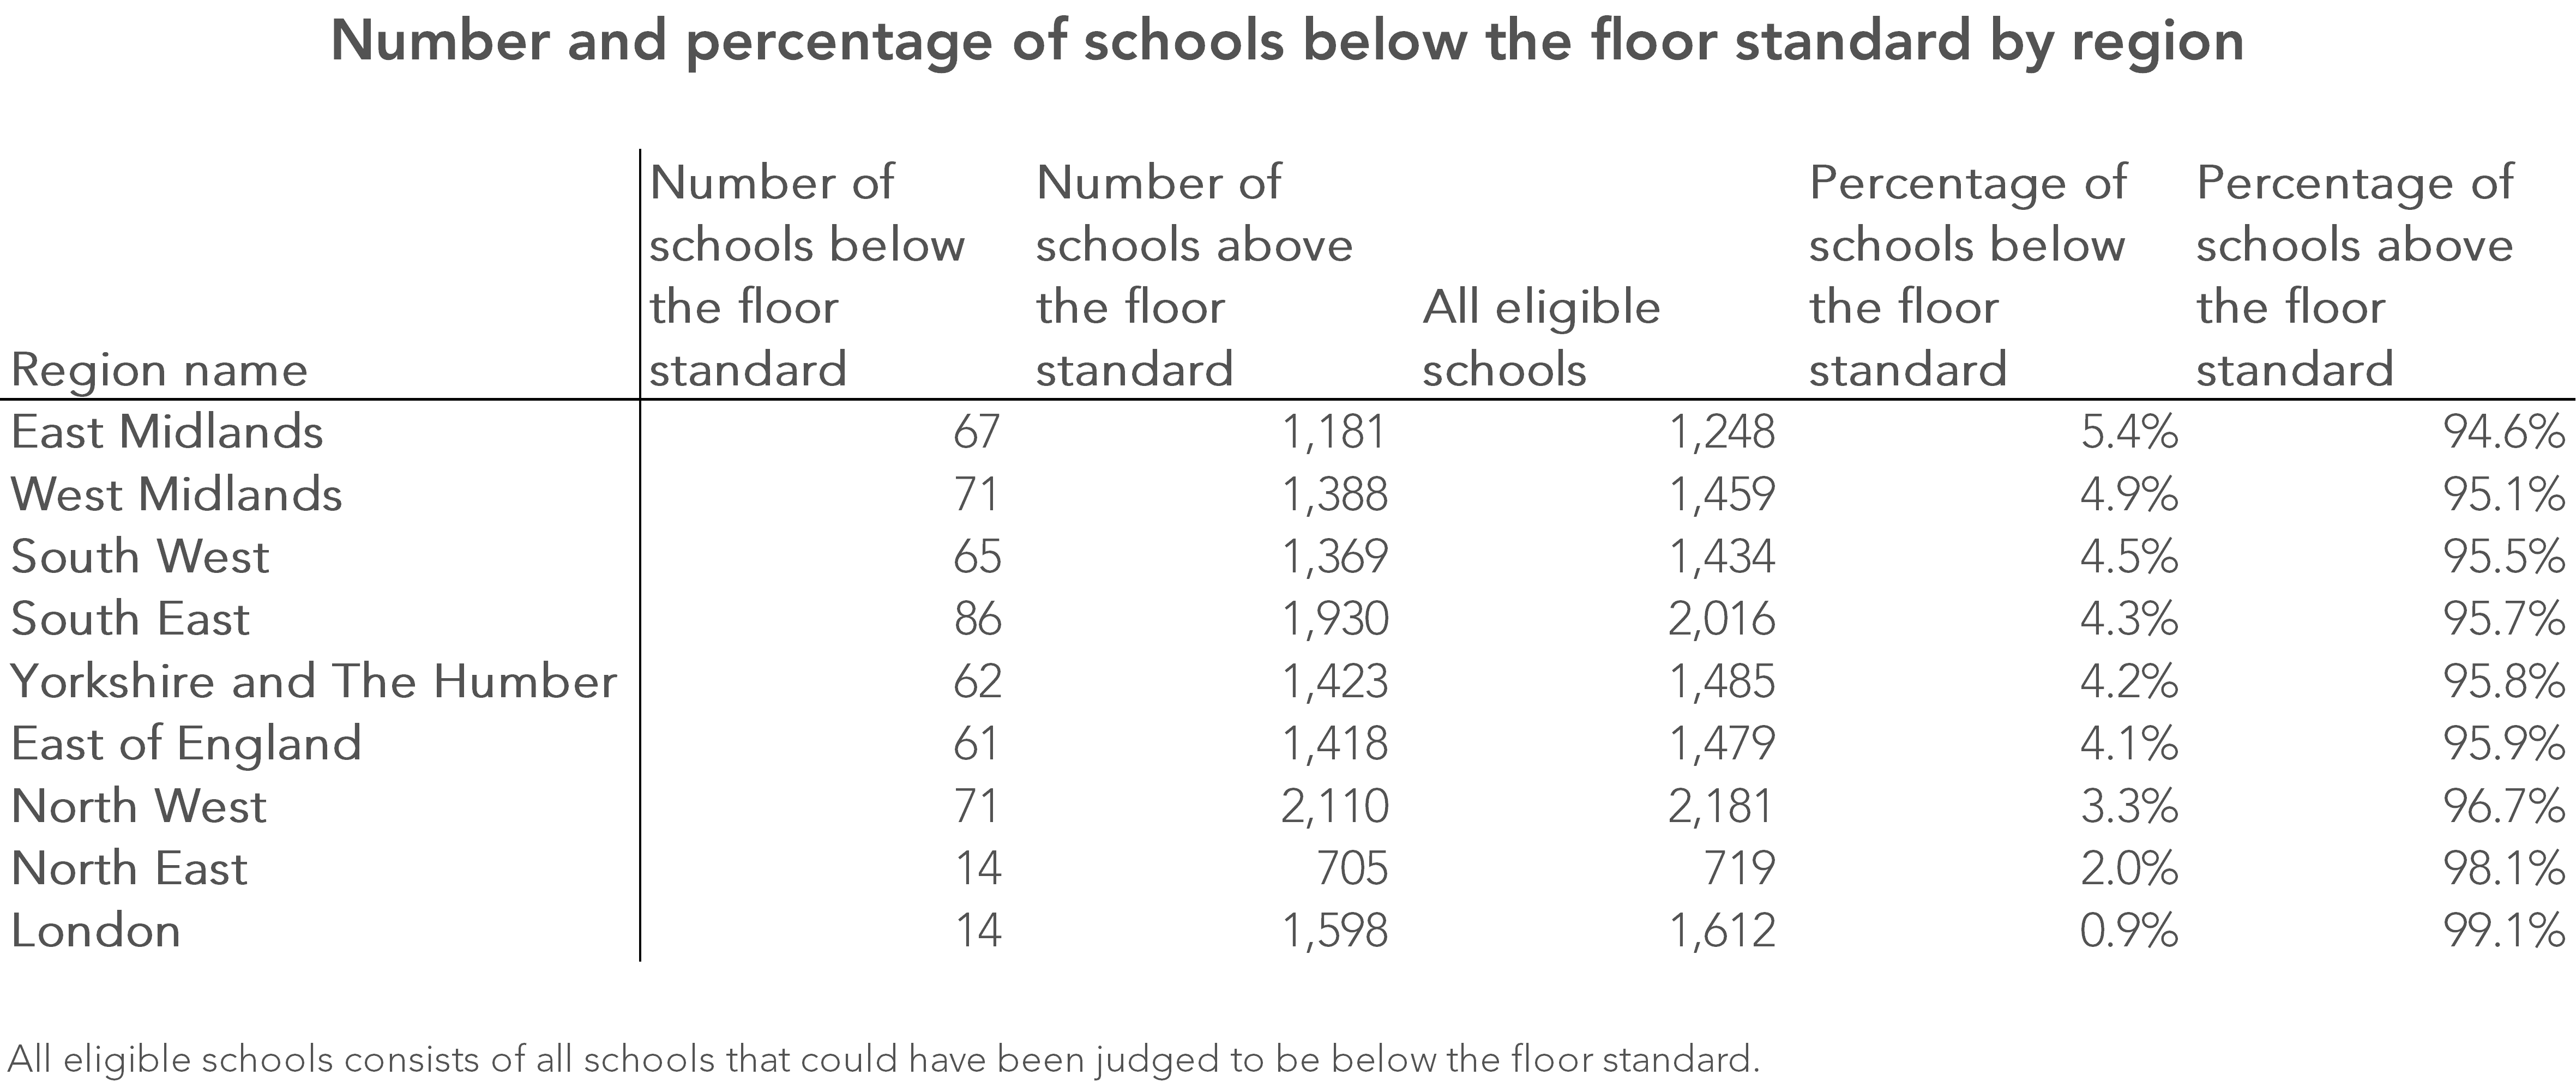
Looked at geographically, the East Midlands is the region with the greatest share of schools below the floor standard – 5.4% of primary schools are in this group. At the other end of the scale are the North East and London.
Coasting schools
Sitting one rung above schools judged to be below the floor standard are schools which the DfE considers to be coasting.
FFT Aspire users
You can analyse all your school’s results in more detail using FFT Aspire’s interactive self-evaluation dashboard.
Not an FFT Aspire user?
Schools judged to be coasting are all at risk of action from central government, although, as the TES uncovered, no school judged to be coasting in 2016 has been forcibly converted to academy status. And in more than half of cases relating to primary schools, no action was taken at all, and in the remaining cases the school was told that it needed some additional support and challenge.
The coasting definition takes in performance over the last three years[2], and this year 524 are considered by the DfE to be coasting, versus 477 last year [PDF]. (Due to the way the definitions work, school can actually be classified as being both below the floor standard, and coasting – 117 schools fell into this camp this year [PDF].)
The number of coasting schools also varies considerably by region – with London and the North East having the fewest schools falling into this classification.

Junior schools
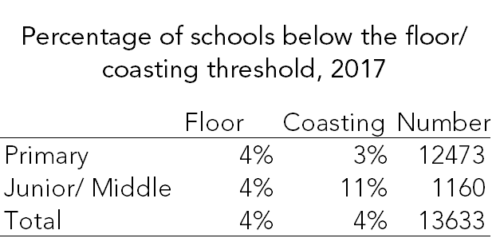
Last year we reported that 6% of junior schools fell below the floor standard amid wider concerns that the current way of measuring progress systematically disadvantages junior schools.
This year there has been some good news. Just 4% of junior/middle schools fell below the floor, the same percentage (allowing for rounding) as primary schools. That said, they were almost four times as likely as primary schools to be classified as coasting.
Want to stay up-to-date with the latest research from Education Datalab? Sign up to our mailing list to get notifications about new blogposts, or to receive our half-termly newsletter.
1. Only schools that could have been below the floor standard are counted here: state-funded, mainstream school, which had more than 10 pupils at the end of KS2 that have not subsequently closed, along with some requirements on the number of pupils who have Key Stage 1 assessments and on the number who took individual subjects at KS2 [PDF].
2. To be judged to be coasting, the following criteria would need to be met:
- 2015
- fewer than 85% of pupils achieving Level 4 in reading, writing and maths; and
- below the national median percentage of pupils making expected progress in all of reading, writing and maths [PDF]; and
- 2016
- fewer than 85% of children achieve the expected standard; and
- average progress made by pupils is below
- -2.5 in reading; or
- -2.5 in mathematics; or
- -3.5 in writing
- 2017
- fewer than 85% of children achieve the expected standard; and
- average progress made by pupils is below
- -2.5 in reading; or
- -2.5 in mathematics; or
- -3.5 in writing


It’s worth saying that many of the all through primary schools falling into the coasting measure are ones that have converted from separate infant and junior schools and therefore are still working from a key stage baseline coming from the infant school prior to merging. Therefore I believe the problem/weighting is even greater/unfairer against junior schools. Just a thought.