We’ve already looked at the number of schools judged to be below the floor standard, and to be coasting, based on the Key Stage 2 performance tables data published this morning.
But, looking a little deeper, how stable are these classifications – how many schools that ended up in one of these groups last year did so again this year?
And what’s the relationship between these classifications and the other side of accountability system – Ofsted?
How many schools stayed in one of the DfE’s groups of concern?
FFT Aspire users
You can analyse all your school’s results in more detail using FFT Aspire’s interactive self-evaluation dashboard.
Not an FFT Aspire user?
Last year 477 schools were judged to be coasting and 665 fell below the government’s floor standard – with 113 meeting both definitions.
This year, 524 schools were judged to be coasting and 511 fell below the floor standard, with 117 in both groups.
But what can we say about how schools changed groups between 2016 and 2017?
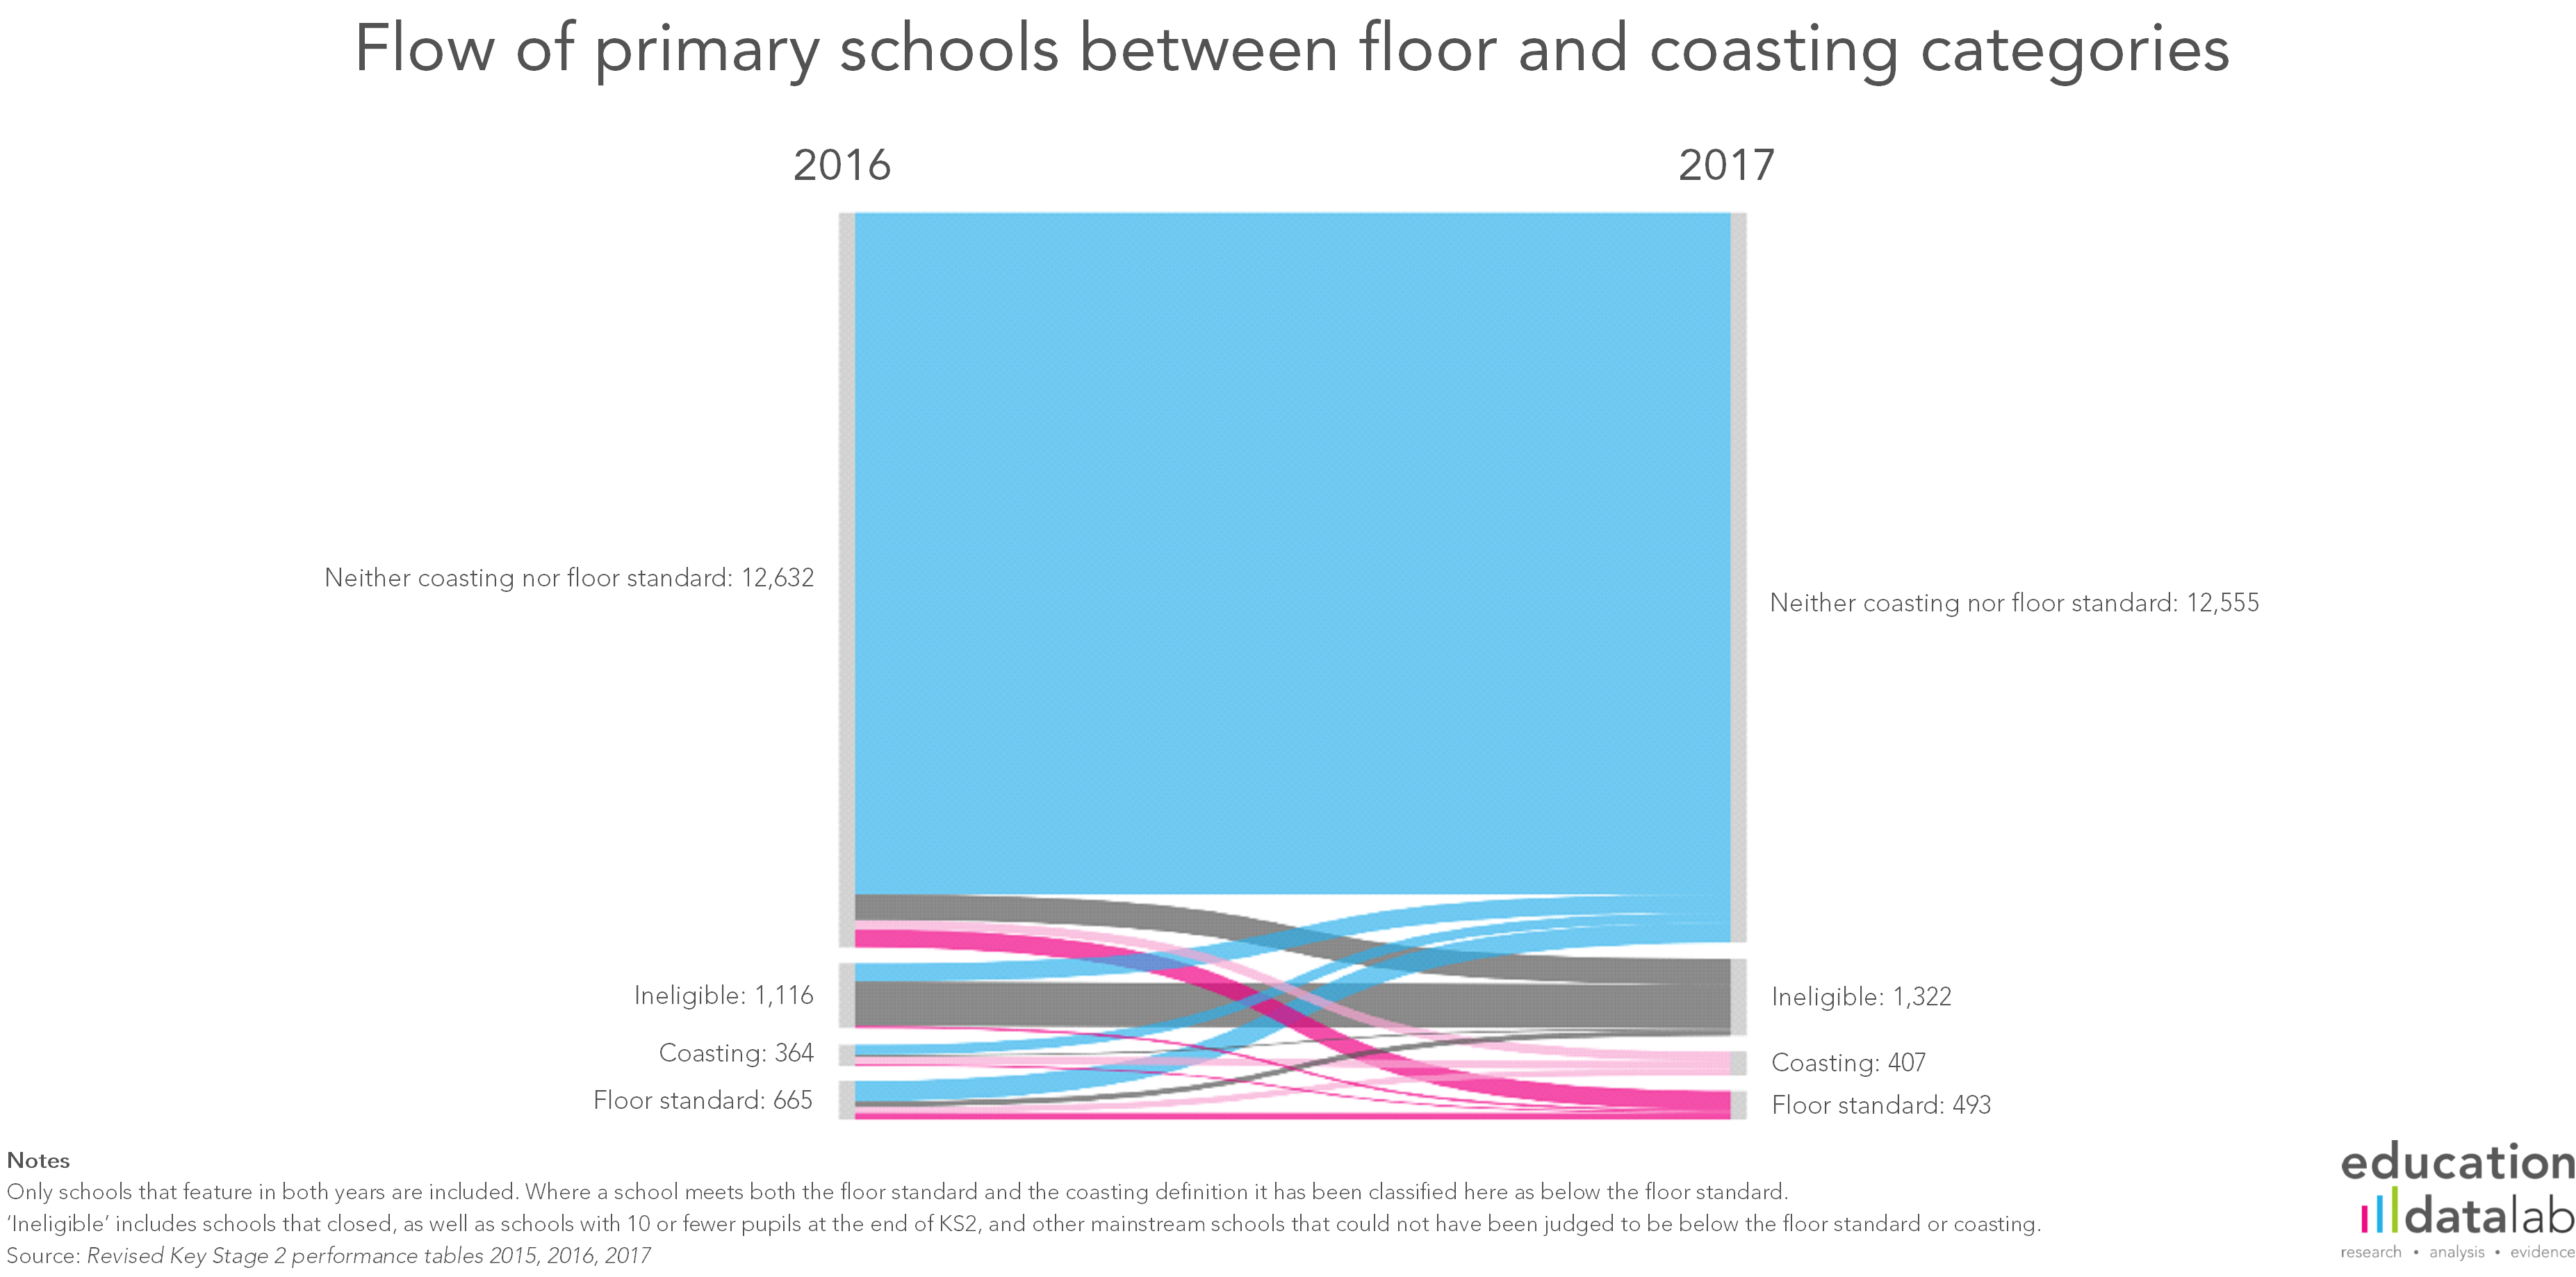
Looking first at those schools that ended up below the floor standard this year, most schools had been neither coasting nor below the floor standard last year, despite having been eligible to be rated as such – 64% of all of those that ended up below the floor standard this year.
But on a more positive note, around half of those judged to be coasting or below the floor standard ended up in neither category this year (despite having been eligible to be rated as such).
In total, 173 out of the 364 schools judged to be coasting (but above the floor) ended up in neither category this year – 48%.
And of the 665 schools below the floor standard last year, the largest group – 349 schools, or 52% – did not end up in either category.
What this does mean though is that over 1,500 schools (about one-in-ten) have featured in a category in either year.
The chart below shows the full flow of schools from one group to another. (The 2017 floor standard figure is shown as 493, rather than the 511 mentioned above, as the chart only shows schools that featured in both 2016 and 2017 performance tables – the remaining 18 schools that ended up below the floor standard in 2017 did not have results in 2016.)
As the TES uncovered, in more than half of cases of primary schools falling below the coasting threshold last year, no action was taken at all, and in the remaining cases the school was told that it needed some additional support and challenge. It would seem (based solely on this year’s data) that plenty of schools are capable of extracting themselves from the category without any heavy-handed intervention.
Of particular note are six coasting schools from 2016 that managed to achieve significantly above average value added scores in all each of reading, writing and maths in 2017. And the 13 schools below the floor in 2016 at which at least 85% of pupils achieved the expected standard in all three subjects in 2017.
Ofsted ratings
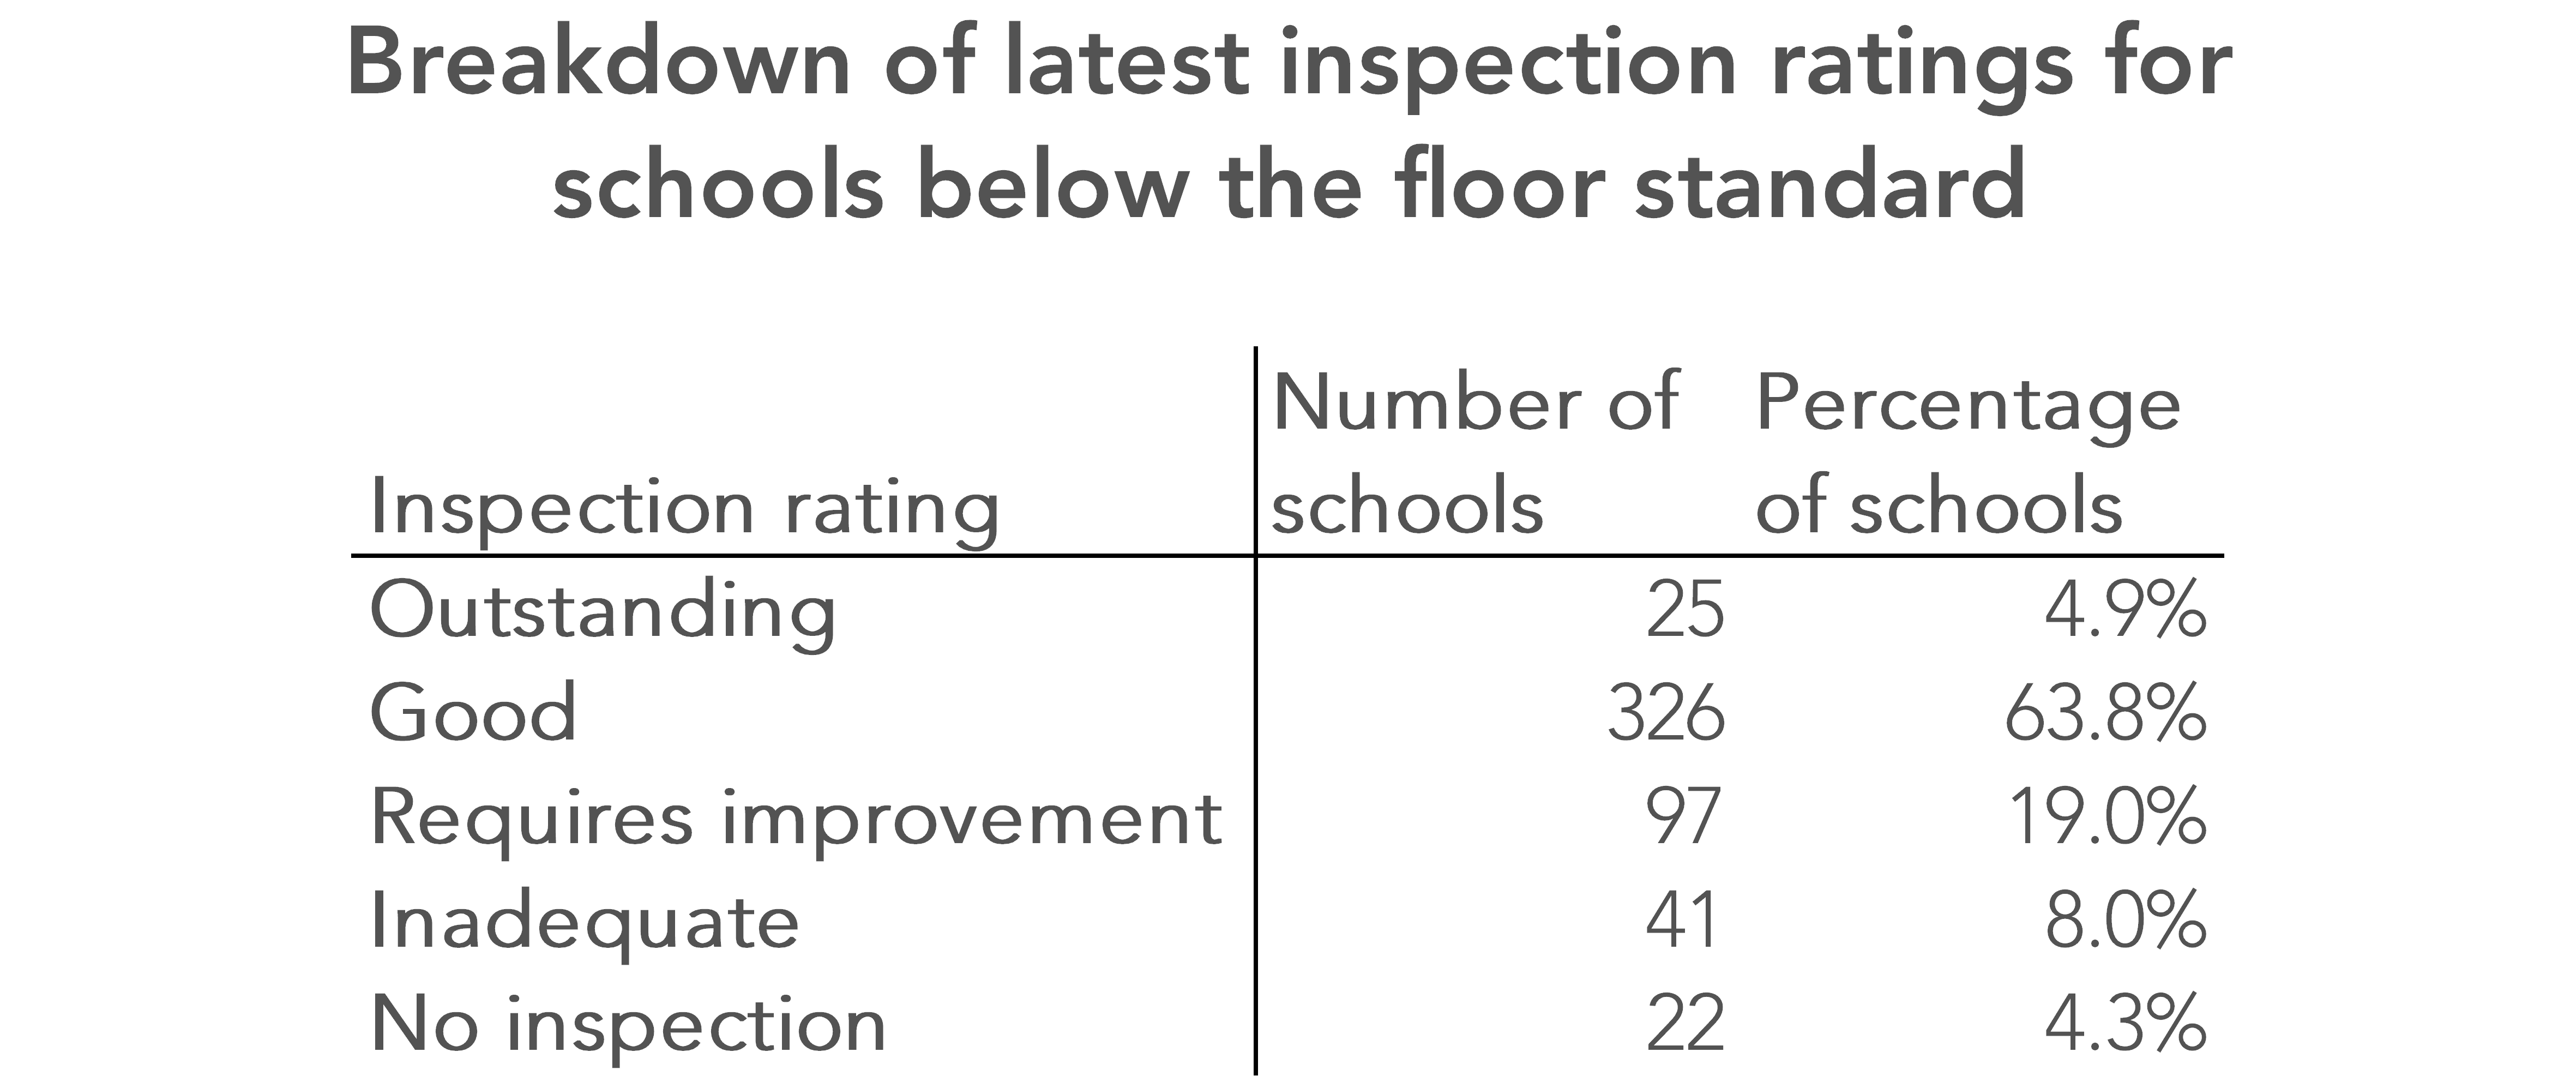
Of the schools below the floor standard this year, what Ofsted rating did they achieve at their most recent inspection?
More than two-thirds – 69% – had good or outstanding ratings as at 30 November. The full breakdown can be seen in the table below.
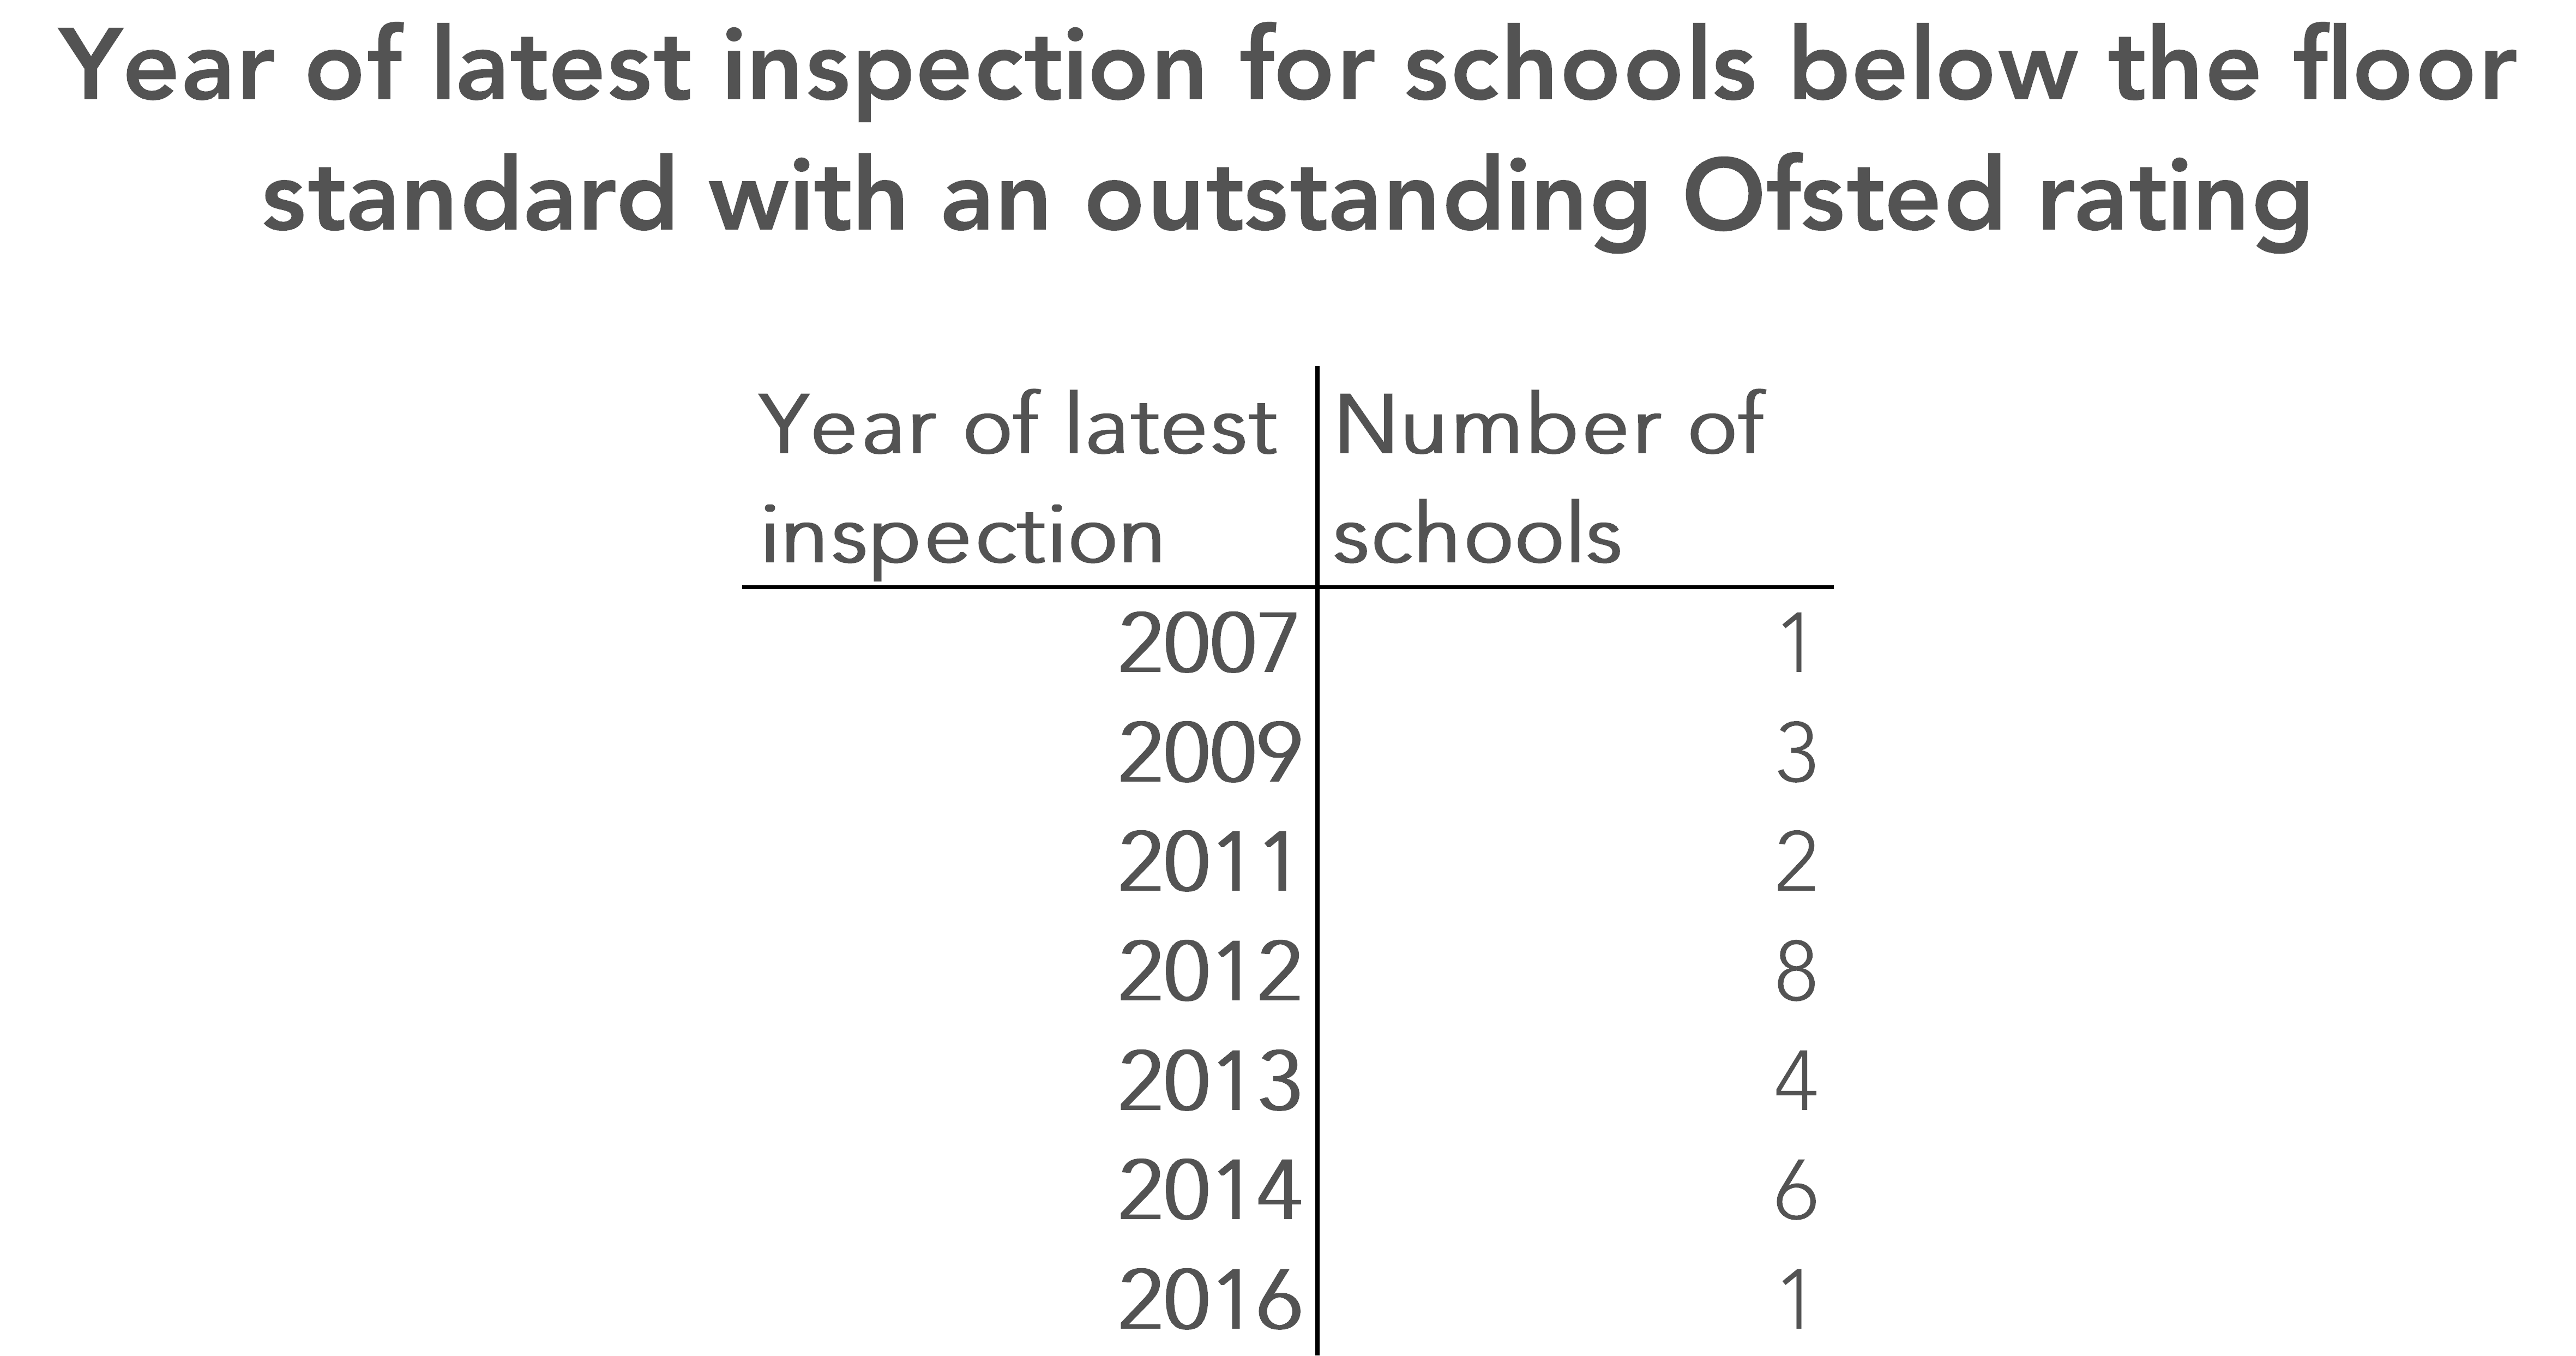
Of those with an outstanding rating, several have not been inspected in the last five years, with one school not having been inspected since 2007.
Want to stay up-to-date with the latest research from Education Datalab? Sign up to our mailing list to get notifications about new blogposts, or to receive our half-termly newsletter.


Leave A Comment