Minimum performance standards for 16-18 Level 3 (A-Level and equivalent) attainment were first introduced in 2016. Separate standards were defined for academic qualifications (primarily A-Levels) and applied general qualifications (primarily BTECs)[1].
The standards are based on value added measures that control for pupil attainment at Key Stage 4. For academic qualifications, the minimum standard in 2017 was set at -0.52 and for applied general qualifications at -0.65. Notionally, 1 point on this scale is equivalent to one grade in one A-Level. Value added calculations are performed separately for different subjects to take account of variation in severity of grading between subjects.
The 2017 Key Stage 5 performance tables published this morning show that 105 schools and colleges fell below the academic standard and 82 below the applied general standard. A total of 7 fell below both. University technical colleges were among the 105 below the academic minimum standard.
Institutions below the minimum standard for academic qualifications, 2017
| Number below academic minimum standard | % below academic minimum standard | Total number | |
| University technical college | 11 | 35% | 31 |
| Studio schools | 2 | 14% | 14 |
| General and other colleges | 16 | 12% | 137 |
| Free schools | 3 | 10% | 30 |
| Sponsored academy | 29 | 9% | 328 |
| Community schools | 15 | 7% | 229 |
| Foundation schools | 5 | 4% | 126 |
| Voluntary controlled | 1 | 4% | 26 |
| Academy converter | 20 | 2% | 998 |
| Voluntary aided | 2 | 1% | 142 |
| Sixth-form college | 1 | 1% | 85 |
Some of these institutions would be justified at being aggrieved at being deemed to be below the minimum academic standard. In the case of 16 of them, this judgment was based on the results of 20 or fewer students.
Three FE colleges were classified below the minimum academic standard on the basis of fewer than 15 students taking academic qualifications. And yet each had over 350 taking applied general qualifications.
Particularly for institutions with small cohorts, value added scores can be rather noisy and vary markedly from year to year. This is still the case when removing any institutions with fewer than 10 students, as shown in the chart below.
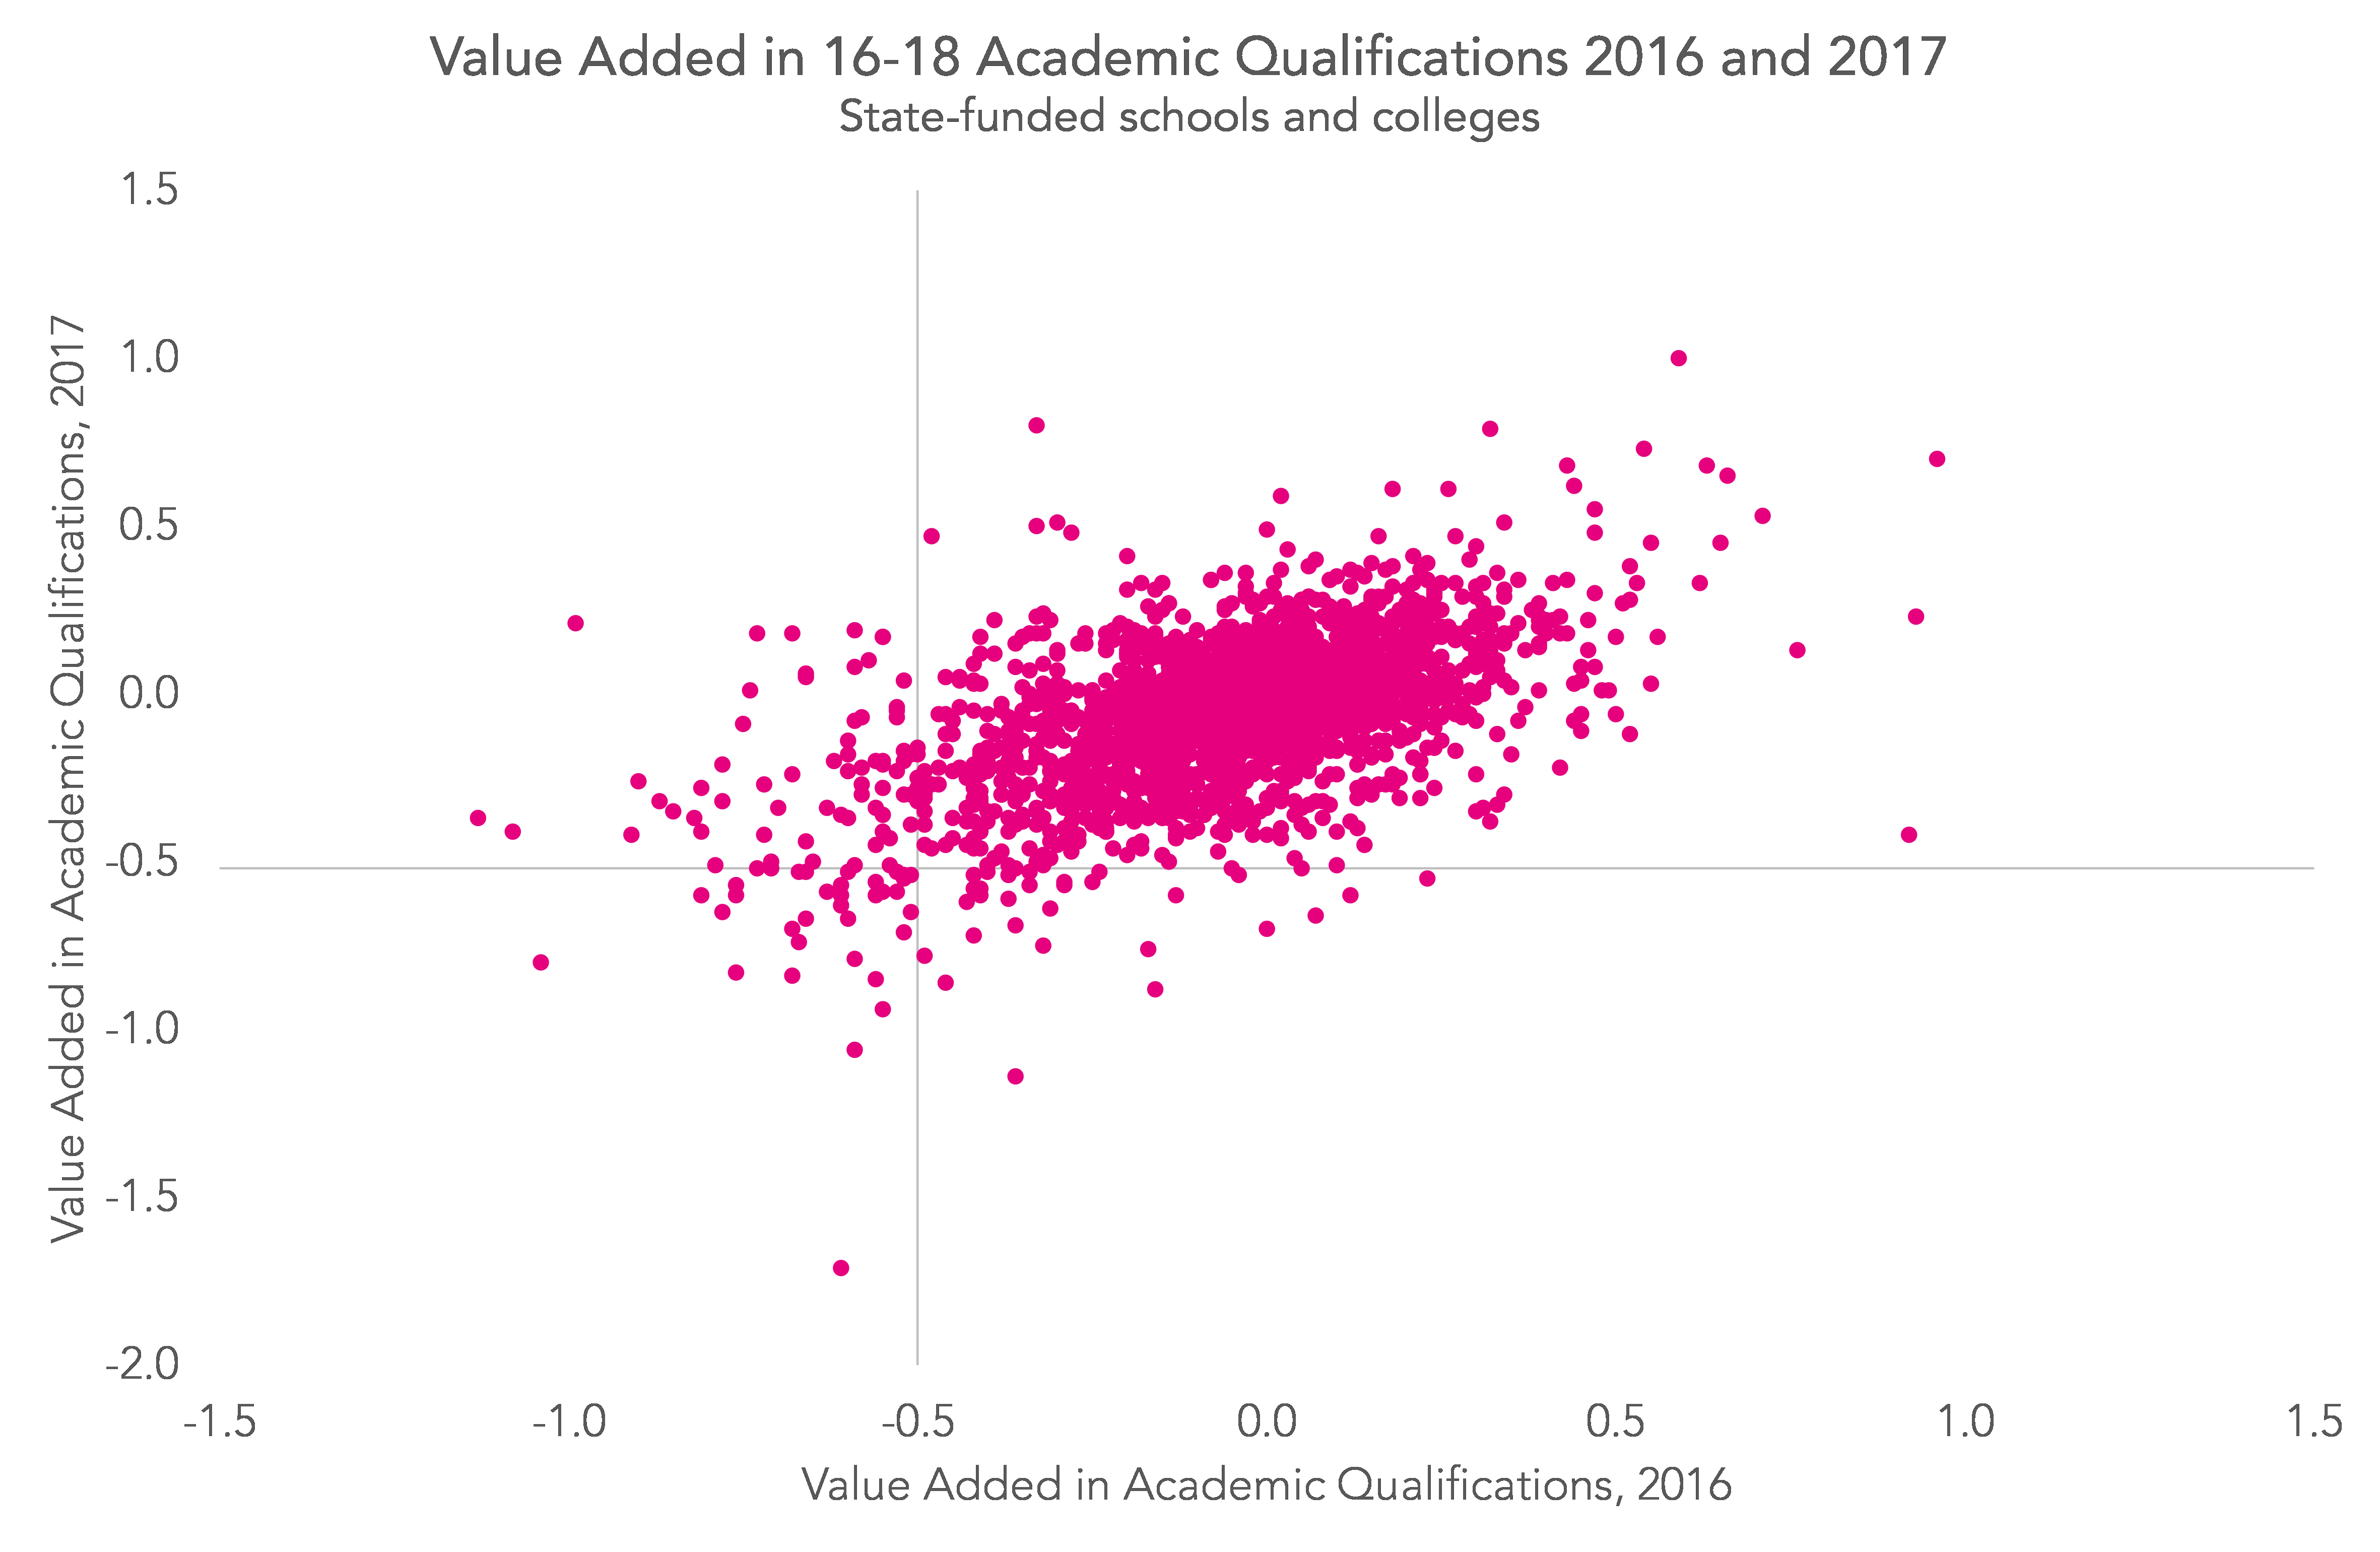
The year-on-year correlation between school-level academic value added scores was 0.57. By way of comparison, the year-on-year correlation in Progress 8, which tends to be based on much larger cohorts, was 0.78 between 2016 and 2017.
The Department for Education guidance sets out how the minimum standards will be applied but nothing about what will happen to the schools and colleges that do not meet them. Before proceeding much further, it may wish to reflect on the current arrangements and ask:
- should the minimum standards be based on several years of data?
- is it fair that an institution should fall below the minimum standard for academic qualifications when they represent a small fraction of overall provision?
- should the standards also include students who took a course but who were not entered for examination?
Want to stay up-to-date with the latest research from Education Datalab? Sign up to our mailing list to get notifications about new blogposts, or to receive our half-termly newsletter.
1. A full list can be found here [PDF].

Leave A Comment