Another day, another post about Key Stage 5 subject choice.
This time we’re going to look at prior attainment. We’ll focus on the GCSE English and maths grades of students taking different subjects post-16.
We’ll be using data from the Key Stage 4 and 5 exam tables in the National Pupil Database and focusing on students in state-funded schools who took exams in 2021. We will only be including Key Stage 5 subjects studied by 5,000 or more students.
An overview
Before we get into grade distributions for English and maths GCSE, let’s see which Key Stage 5 options are associated with high and low prior attainment. We’ll use Attainment 8 as our measure of prior attainment for now.
In the chart below, we’ve split pupils into five groups based on their Attainment 8 score.
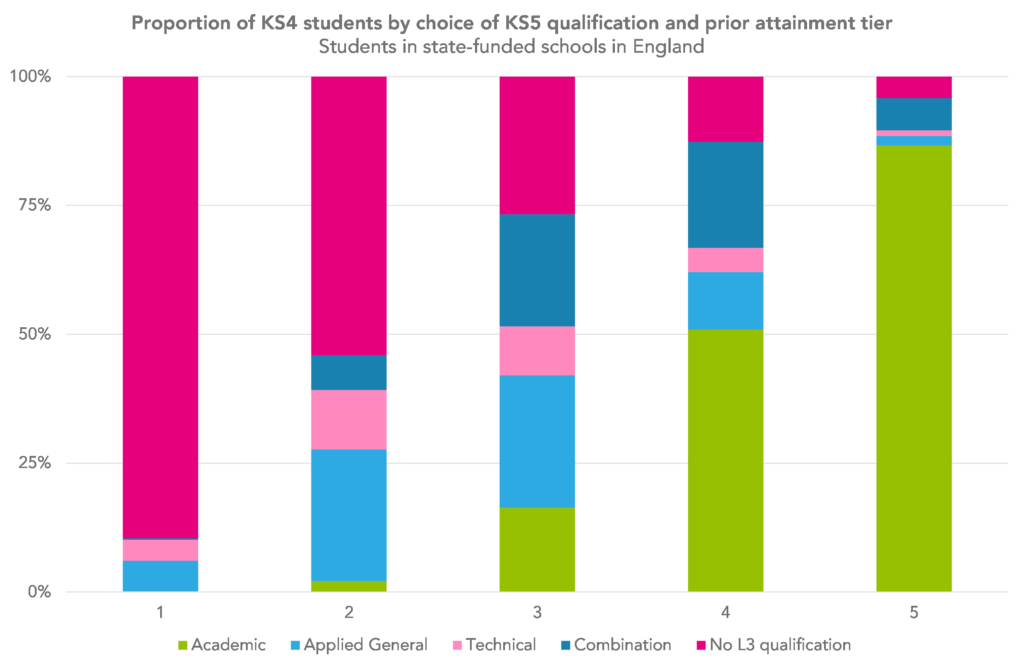
The higher the prior attainment tier, the more likely a student was to take an academic route, and the less likely they were not to enter a Level 3 qualification.
This probably comes as no surprise. This next chart is probably not that surprising either, because we included a very similar chart based on 2020 data in an earlier piece on the subject choices of disadvantaged students.
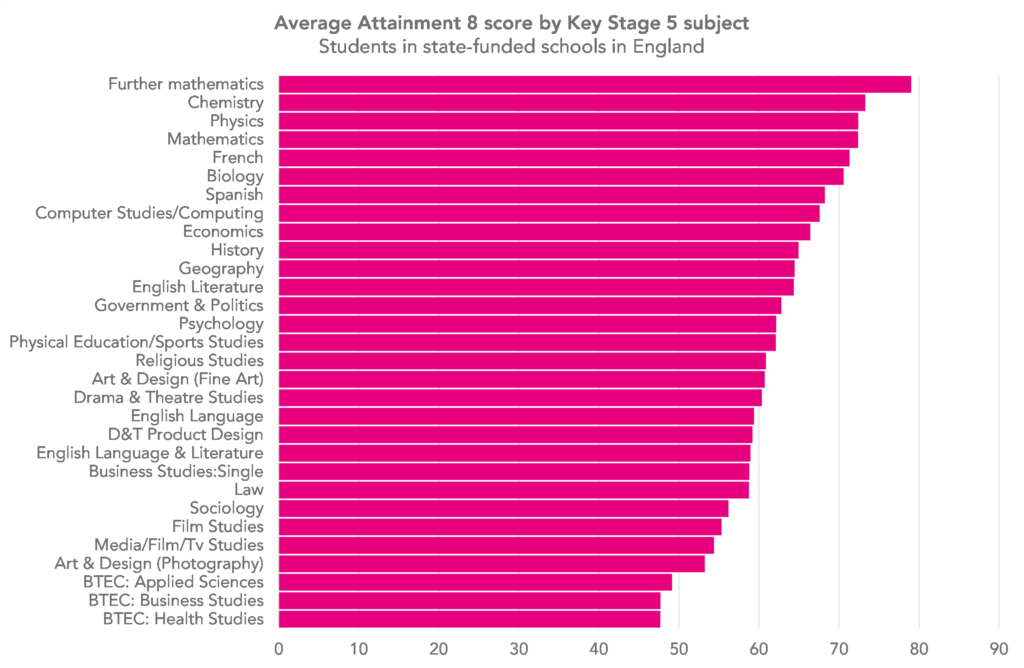
As shown above, the average Attainment 8 score of KS5 students varies quite a bit by subject. A-Level further maths students have the highest at 79, and BTEC health studies the lowest at 48.
This means that further maths students achieve the equivalent of a grade 7.9 in each of the qualifications that make up their Attainment 8 score, while health studies students achieve the equivalent of a grade 4.8.
Generally speaking, A-Levels in the STEM subjects and languages are associated with high prior attainment, while BTECs and A-Levels in media studies, sociology, and photography are associated with lower prior attainment.
English and maths grades
Now we’ll focus in on grades in English and maths GCSEs.
The chart below shows the grade distributions in English and maths for all students who completed Key Stage 4 in 2019. Where students have taken more than one GCSE in a subject – for example English language and English literature – we’ve used the highest grade.
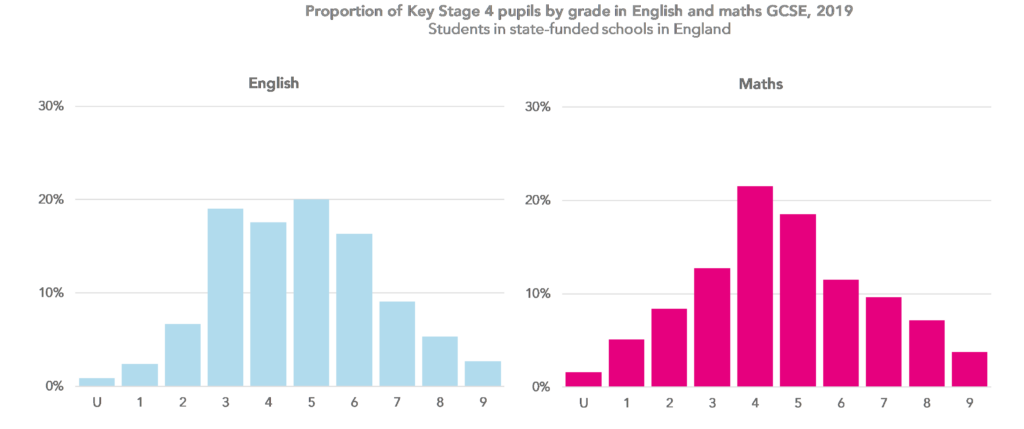
The most common grade in English was a 5, achieved by a fifth (20.0%) of entrants, while in maths it was a 4, achieved by 21.5% of entrants. The difference perhaps reflects that fact that in most cases, the English grade is the highest of two (English literature and English language) while the maths grade is not.
The distributions for those students who went on to complete Key Stage 5 are shown below.
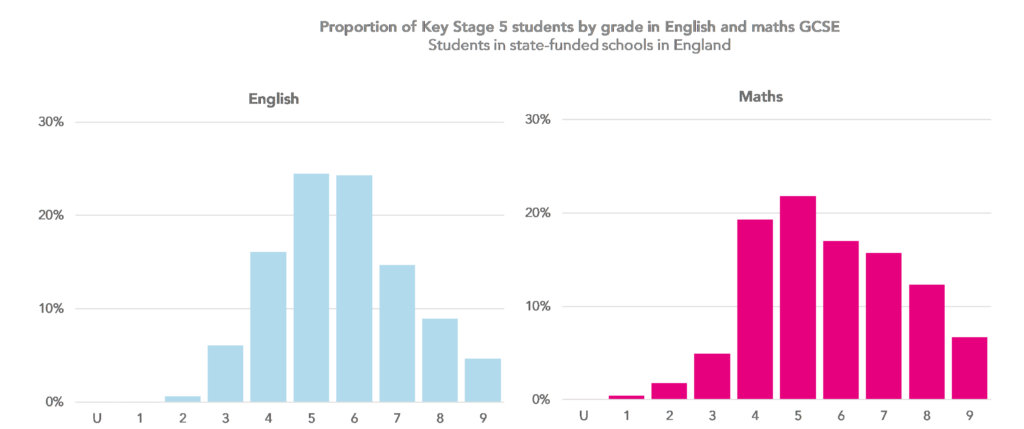
Both distributions are skewed far more towards the higher grades than the distributions for all KS4 pupils. And the distribution for maths grade is flatter than for English. Nearly half of these students (48.8%) received a grade 5 or 6 in English, compared to just 38.8% in maths.
But, as you might expect, the distributions look very different when we break them down by Key Stage 5 subject.
The chart below allows you to see the English and maths grade distributions for all A-Level and BTEC subjects with 5,000 or more entries in 2021.[1]
It’s not surprising to see that students who studied maths A-Level tended to have achieved higher grades in GCSE maths than in GCSE English. 91.0% achieved a grade 7 or above in maths compared to 44.3% in English.
What is a bit more surprising is that the difference in maths and English grades isn’t as extreme for students of English literature and English language A-Level. Just over half (53.1%) of English literature students achieved a grade 7 or above in GCSE English, compared to 28.1% in GCSE maths. And figures for English language students are similar: 44.1% achieved a 7 or above in GCSE English, compared to 18.2% in GCSE maths.
Which subjects have the biggest differences between English and maths grade?
The chart below shows the average difference between maths and English grade by subject.
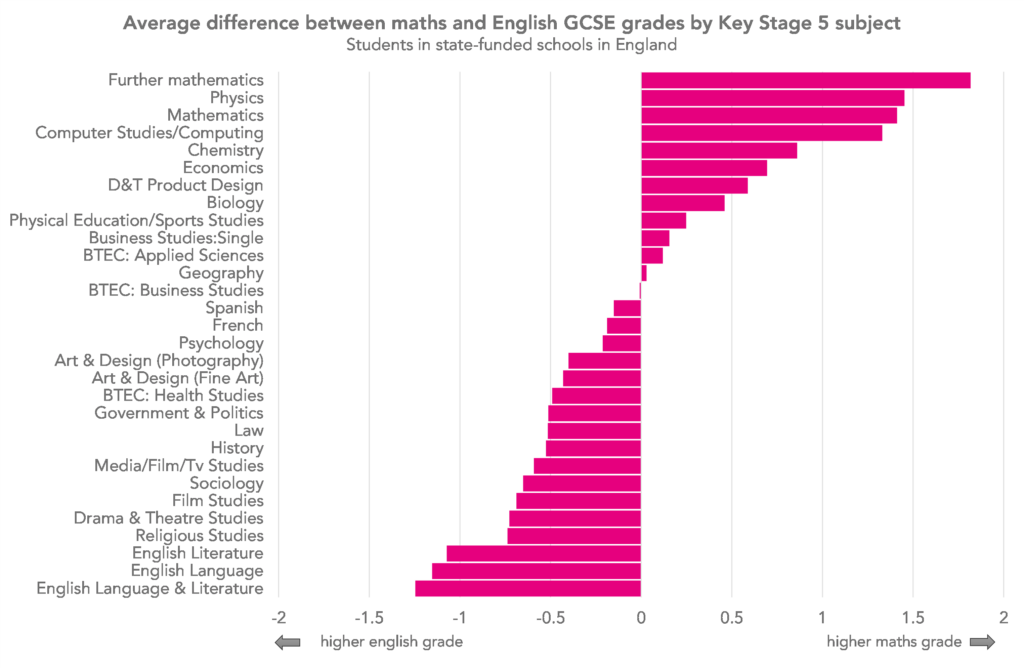
There are more subjects in which students have, on average, a higher grade in English than in maths than vice versa. But in those subjects in which students do tend to have higher grades in maths, the difference tends to be higher.
Further maths students achieved almost two grades (1.8) higher in maths than in English, physics students 1.5 and maths students 1.4. At the other end of the scale, English language and literature students achieved 1.2 grades higher in English than maths, on average, English language students 1.2 and English literature students 1.1.
It’s interesting to see that the difference between maths and English grades is (slightly) higher in physics than it is for maths.
Summing up
There’s a lot of variation in prior attainment by KS5 subject. And there’s even more when we break things down by prior attainment in English and maths.
The distributions do seem to suggest that most schools and colleges require a grade 7 or above in maths to enter some subjects – like maths, further maths and physics A-Level. Otherwise we’d probably expect to see more students with lower GCSE grades entering these subjects.
But this doesn’t seem to be the case for GCSE English. Even among those studying English at A-Level, only around half achieved a grade 7 or above in GCSE English.
[1]: Data suppression rules do not allow us to publish any data based on fewer than 10 students. To avoid this, we have grouped some grades together. For every subject, we show the proportions achieving a grade of 2 or below rather than those achieving a U, 1 or 2 separately. For some subjects, we have also grouped other grades together where numbers were low.


This is really interesting. Just wondering if you’ve done a breakdown by gender?
Hi Tim, thanks for this. We didn’t do a breakdown by gender but now that you mention it I’d be interested to see it, particularly for subjects that tend to have more students from one gender. I think a follow up could be on the cards…
I know the JCQ releases could tell me, but do the differences in prior attainment affect the distribution of A level grades? and following on from this does the skew of prior grades for the top subjects / maths, chem, physics affect the L3VA scores in any unexpected ways as these are the subjects we always have lower L3VA in despite high P8 and high prior grades
I think the answer is yes… and no! A higher proportion of A-Levels in further maths, chemistry and physics receive top grades than in other subjects. But the difference isn’t as big as you’d think given the high prior attainment of students in these subjects – because they tend to be graded more severely than other subjects. We’ve written about this here. And both the high prior attainment and severe grading of these subjects will affect the VA.