In a previous blogpost we looked at the severity of grading in A-Level physics. Our view was that grading was more severe than in other subjects.
None of this was new. Ofqual itself has published lots of detailed research into inter-subject comparability, for instance. And before that the 2008 SCORE report by Rob Coe and colleagues did similar.
However, Ofqual has not shown any inclination to take any action. It investigated grading in science and modern foreign languages at A-Level in 2018. Although finding evidence of severe grading, it decided that adjustments to grading were not appropriate.
What I’ll show in this blogpost is that many students who take physics are doubly penalised when it comes to A-Level grades because they take other subjects that are also severely graded.
Before I get to that, let’s look at subject grading in all A-Level subjects.
Data
I use data on A-Level achievements of 16-18 year olds in 2019, the last year in which exams took place (at the time of writing). This is the data used for 16-18 Performance Tables.
We restrict our analysis to students who entered at least 3 A-Levels. We include students who took their exams in all types of establishment including state schools, independent schools and further education and sixth form colleges.
A-Level grading severity by subject in 2019
I start by calculating a simple index of grading severity by subject. I convert grades into points [1] and then fit a multilevel model of points scores clustered by student with fixed effects for each subject. This assumes that points scores are a function of grading severity in each subject and the students that entered them. I leave aside issues about the reliability of grading
I use the most popular subject (maths) as a base category. In other words, the index of grading severity is relative to maths.
Results for subjects with at least 6000 entrants among our sample are shown below, ordered by grading severity from least to high.
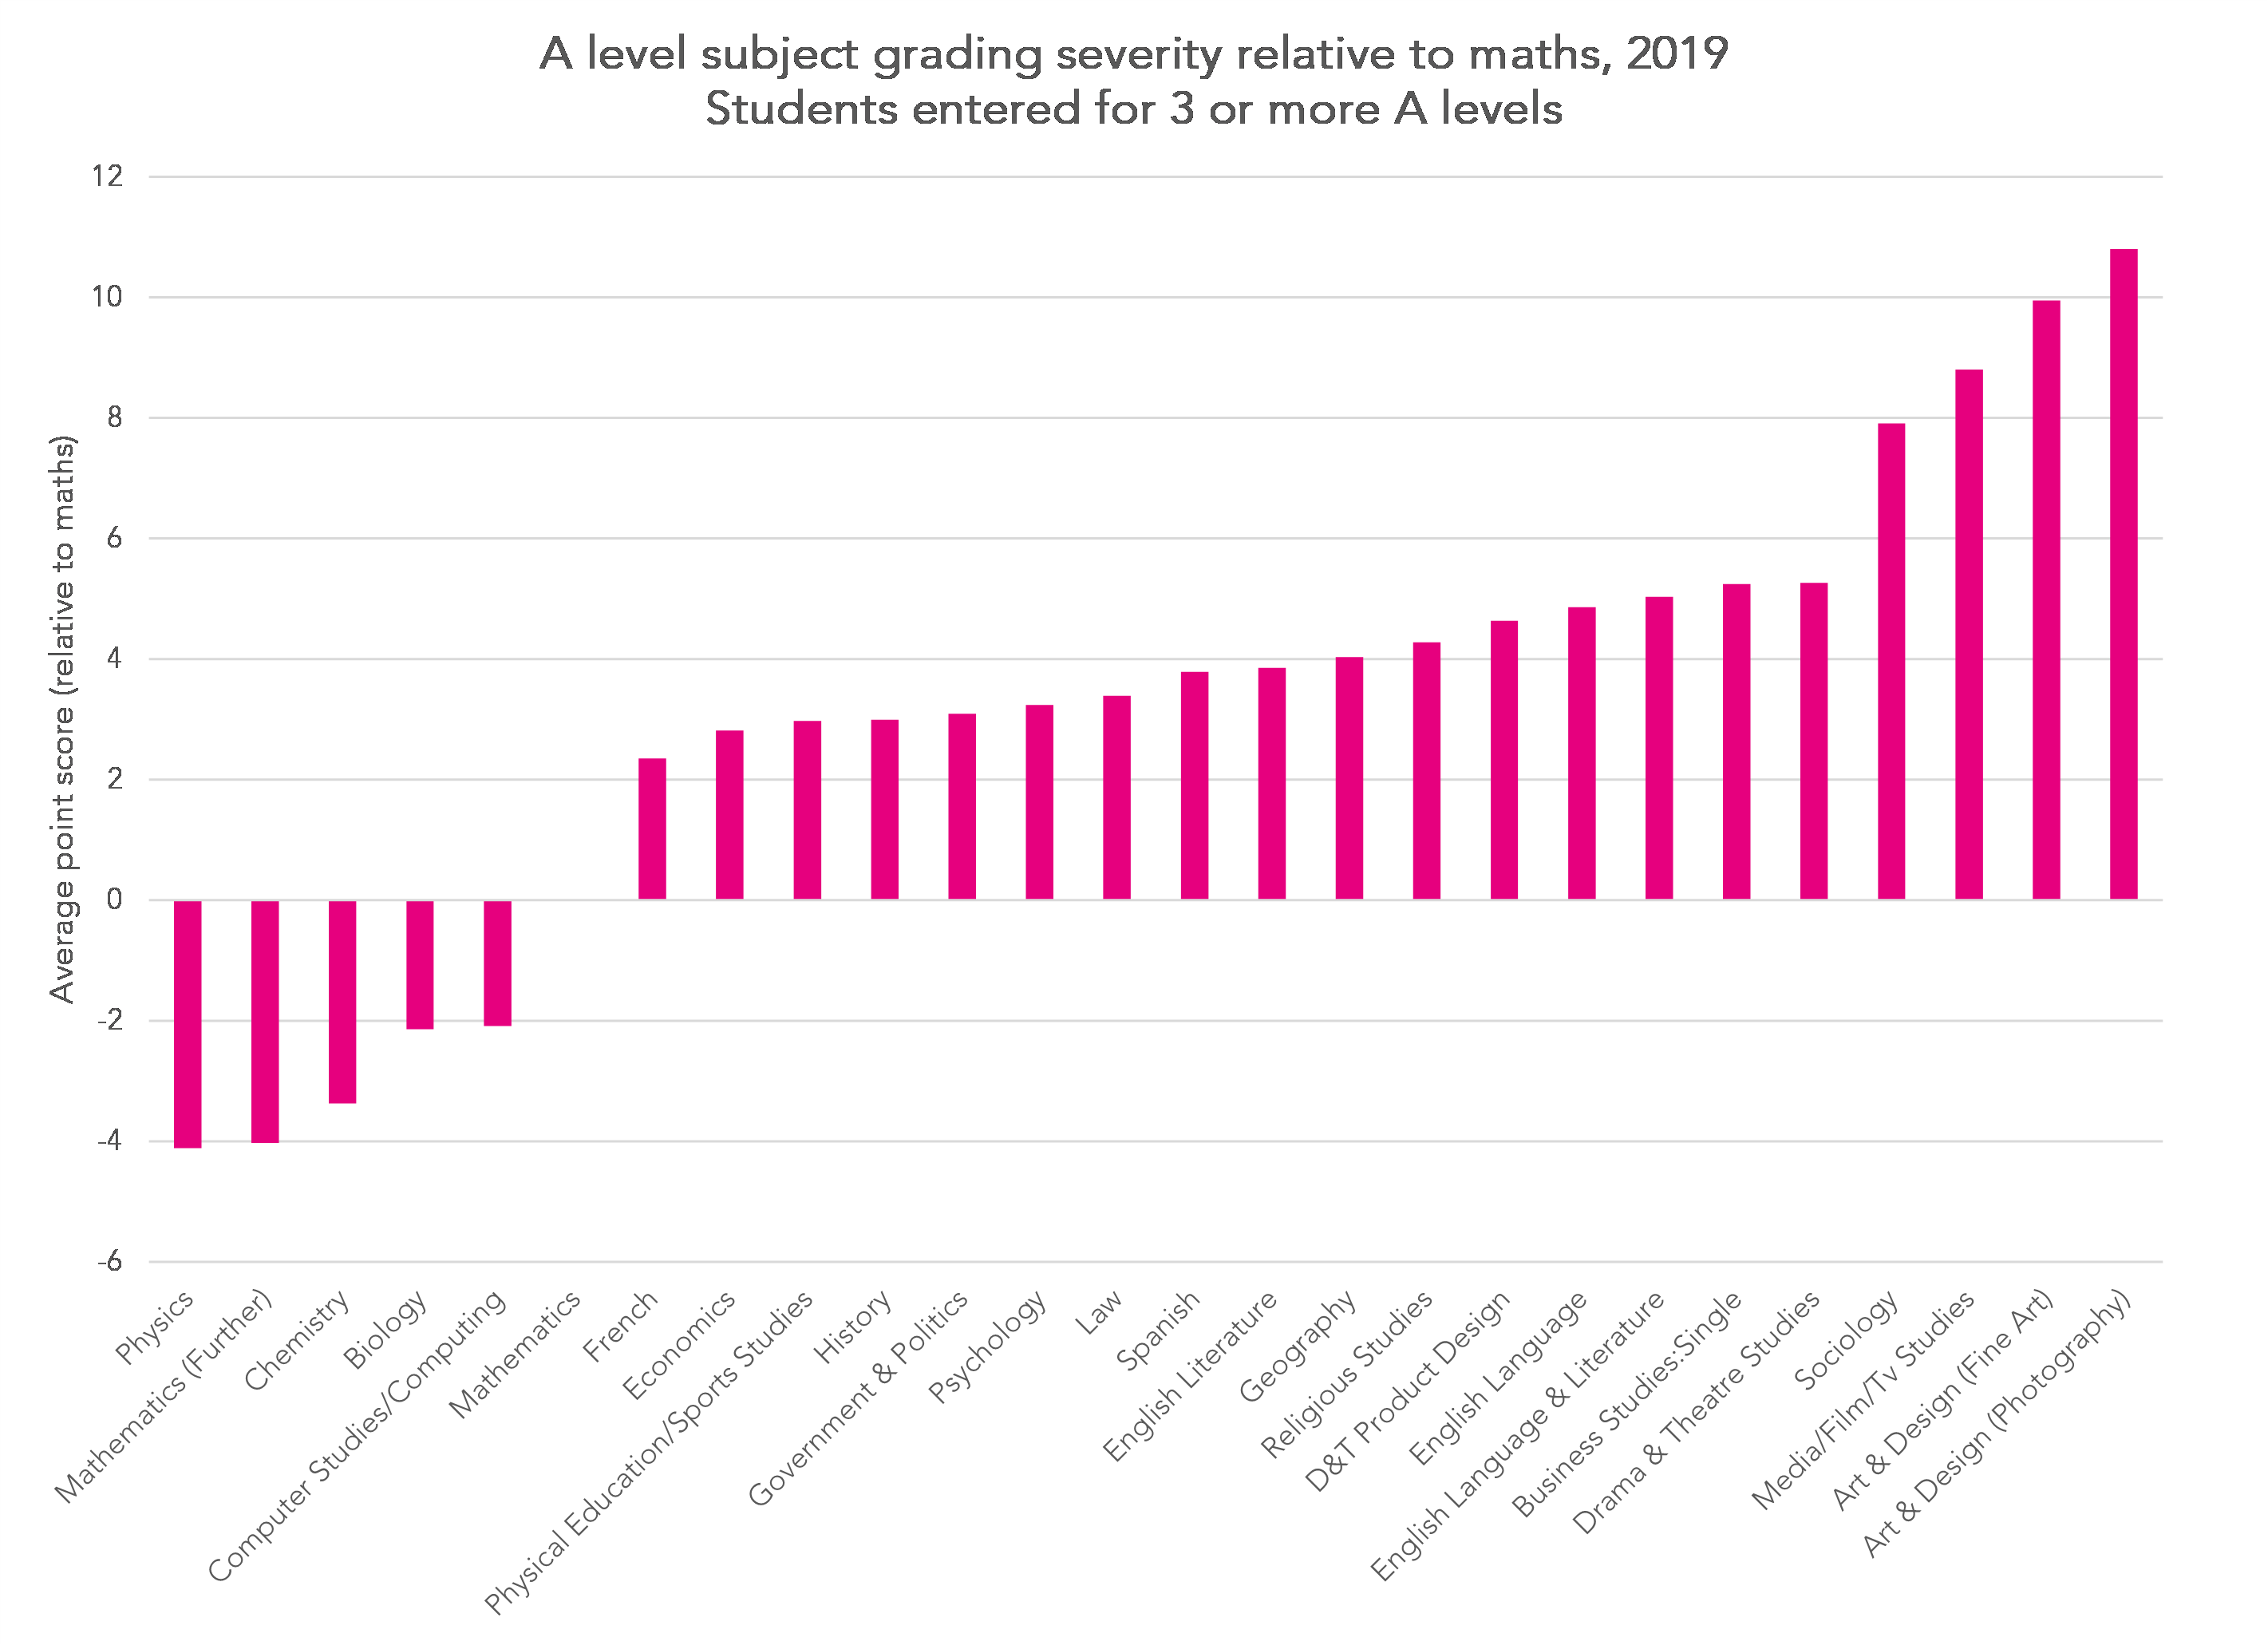
Based on this index, physics is graded most severely. Chemistry, biology, further maths and computer science are also graded more severely than maths. As we shall see, these are subjects that many physics students also take.
This in itself might suggest an issue with the index, or at least the values displayed in the chart above. There are others, for instance the use of grades converted to points. In their own research Ofqual model severity at each grade separately.
So let’s try something different.
How grades differ in other subjects for students who take A-Level physics and maths
Almost 30,000 students entered physics, maths and at least one other A-level subject in 2019. The most popular other subjects are shown below.
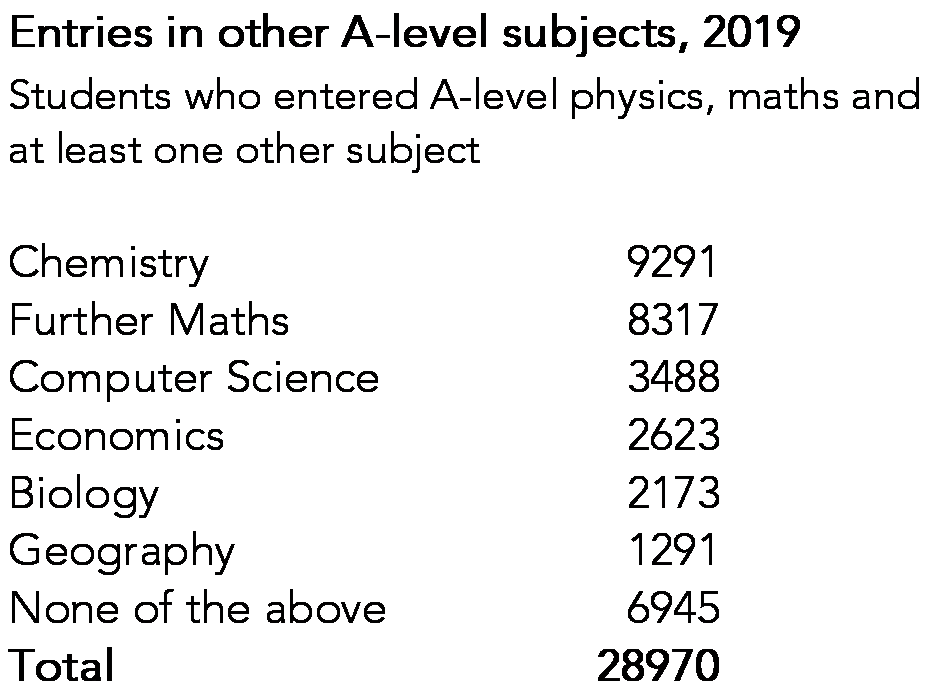
Eagle-eyed readers will note that the values do not sum to the total. This is because some students enter more than one of the subjects listed.
But how do grades compare in different subjects relative to maths and physics? Let’s start with chemistry.
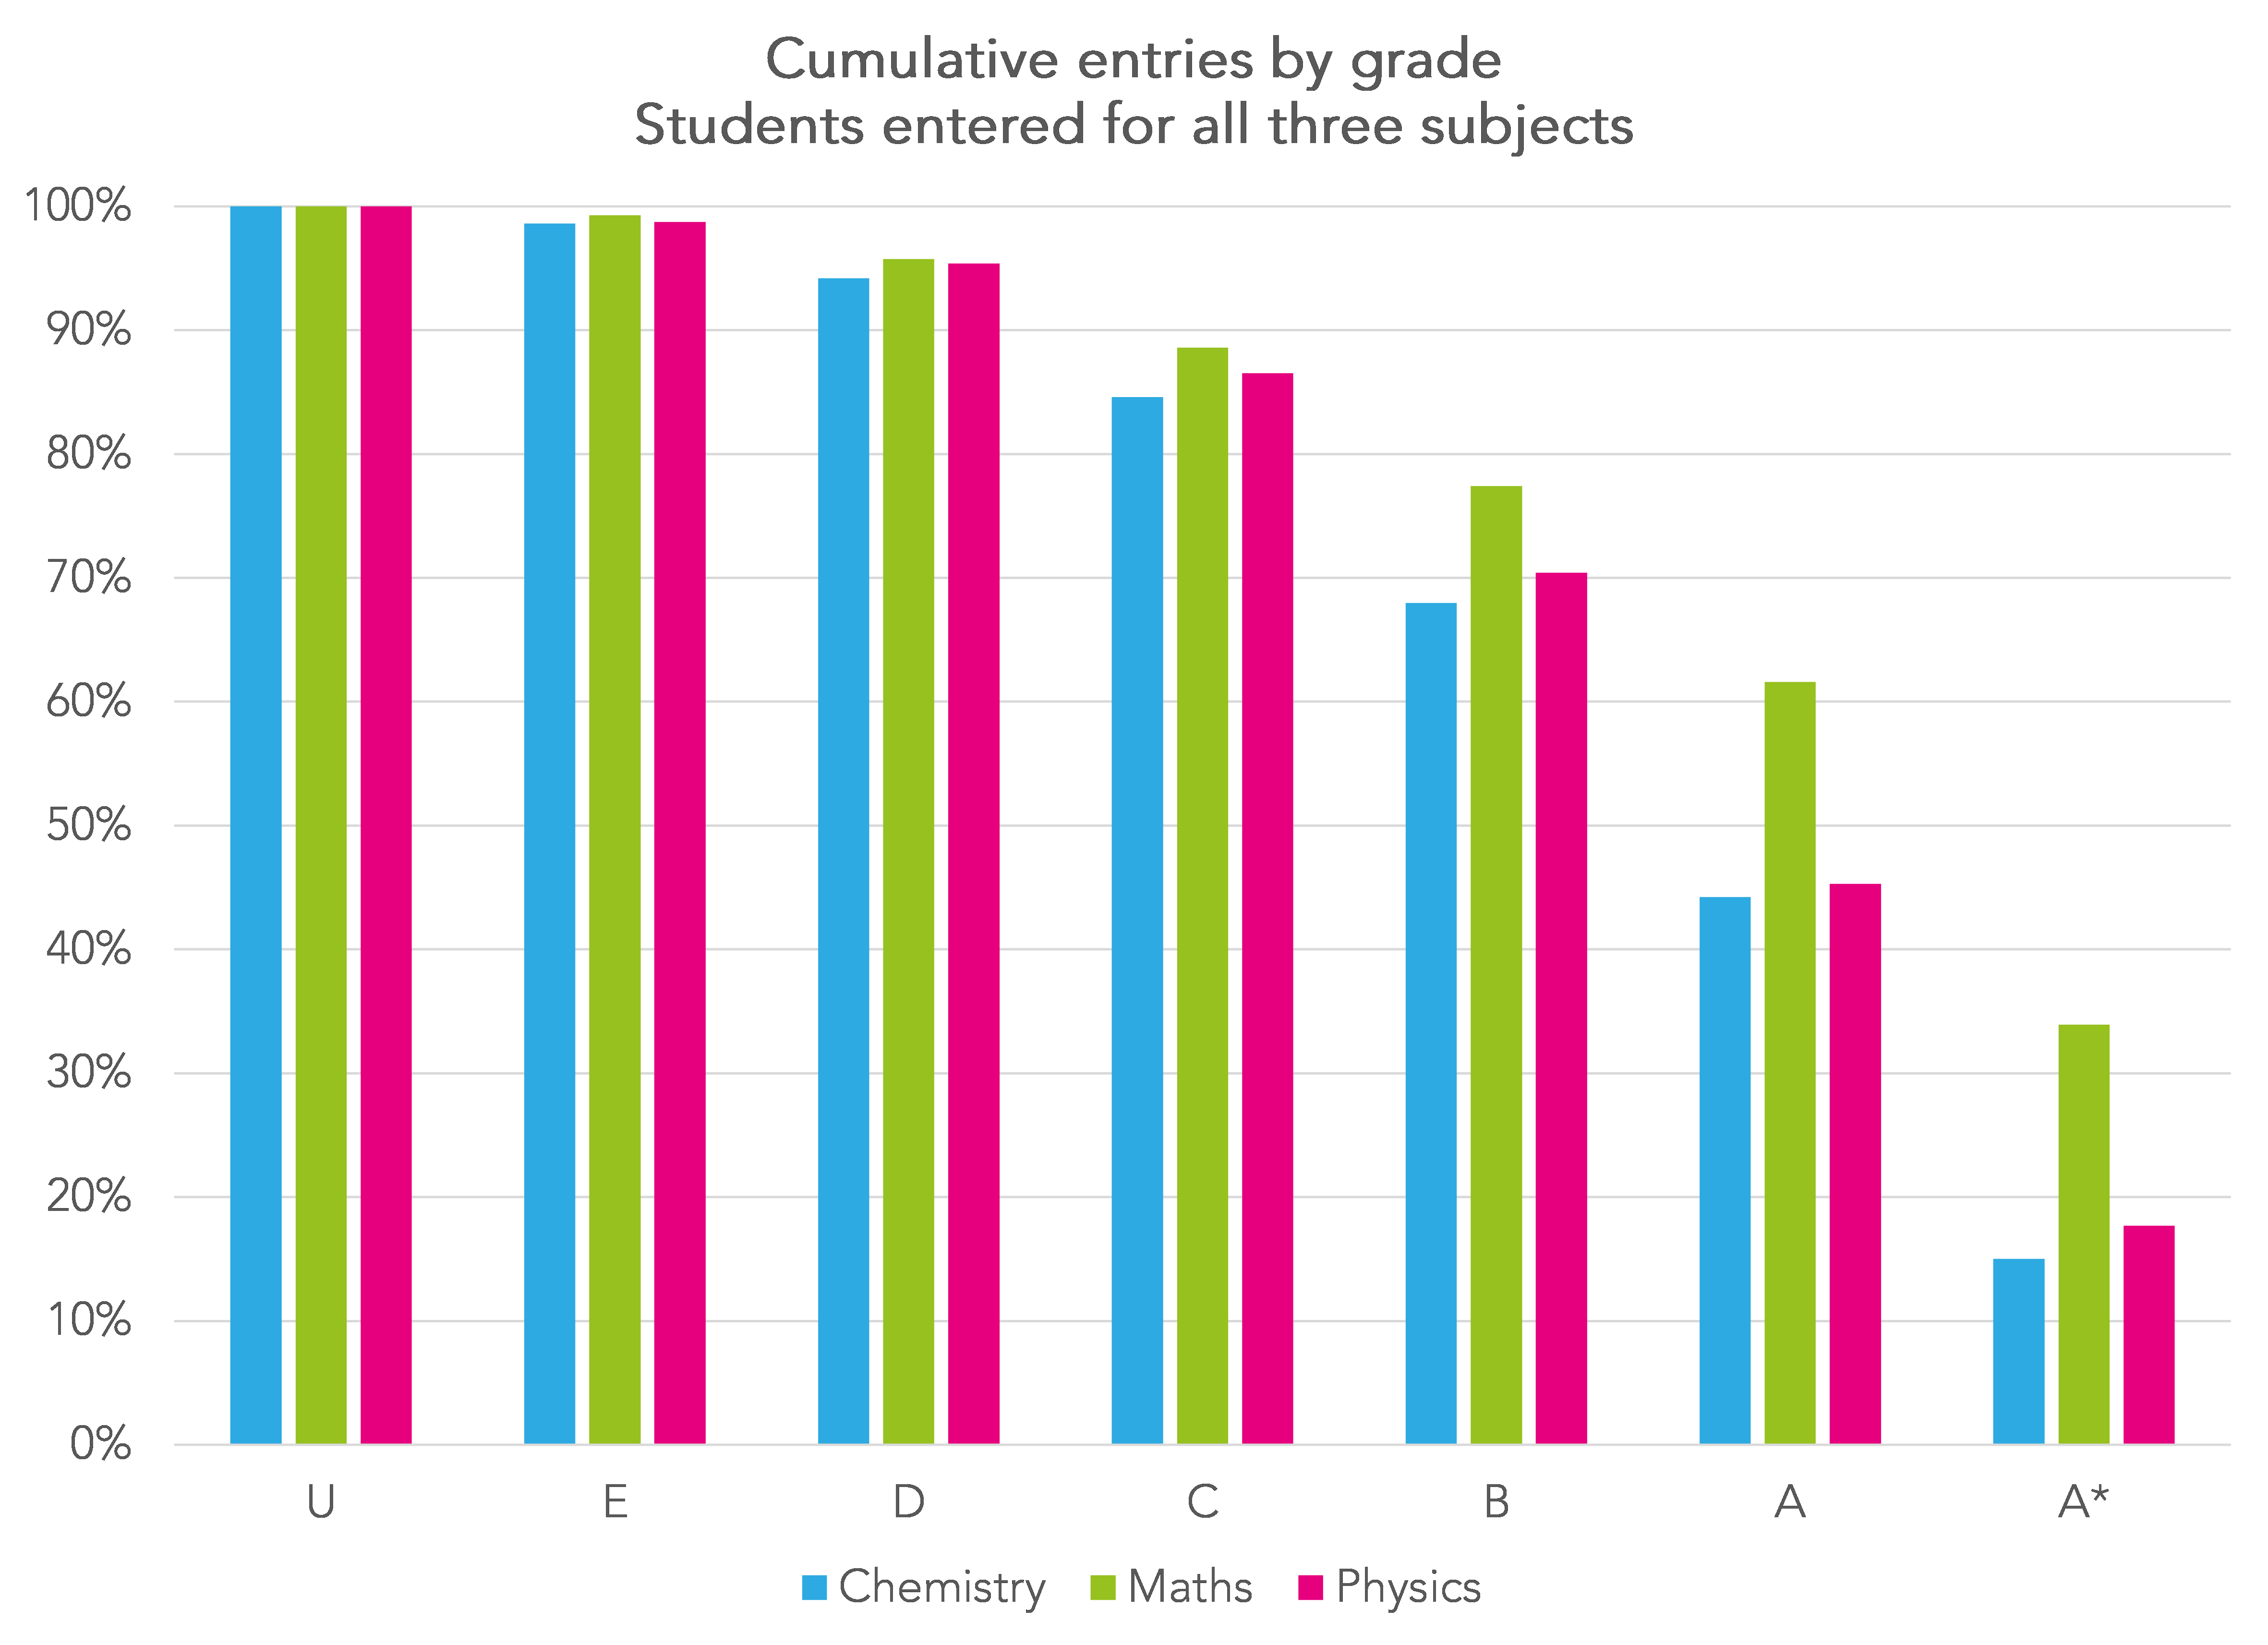
Among students who enter maths, physics and chemistry, grades tend to be higher in maths and lowest in chemistry. In our previous blogpost we asked whether taking maths boosts grades in physics but conceivably the reverse is true. And both could boost (and be boosted by) taking chemistry. The question of how much and whether it varies between subjects I’ll leave for another day.
Let’s now look at further maths alongside maths and physics.
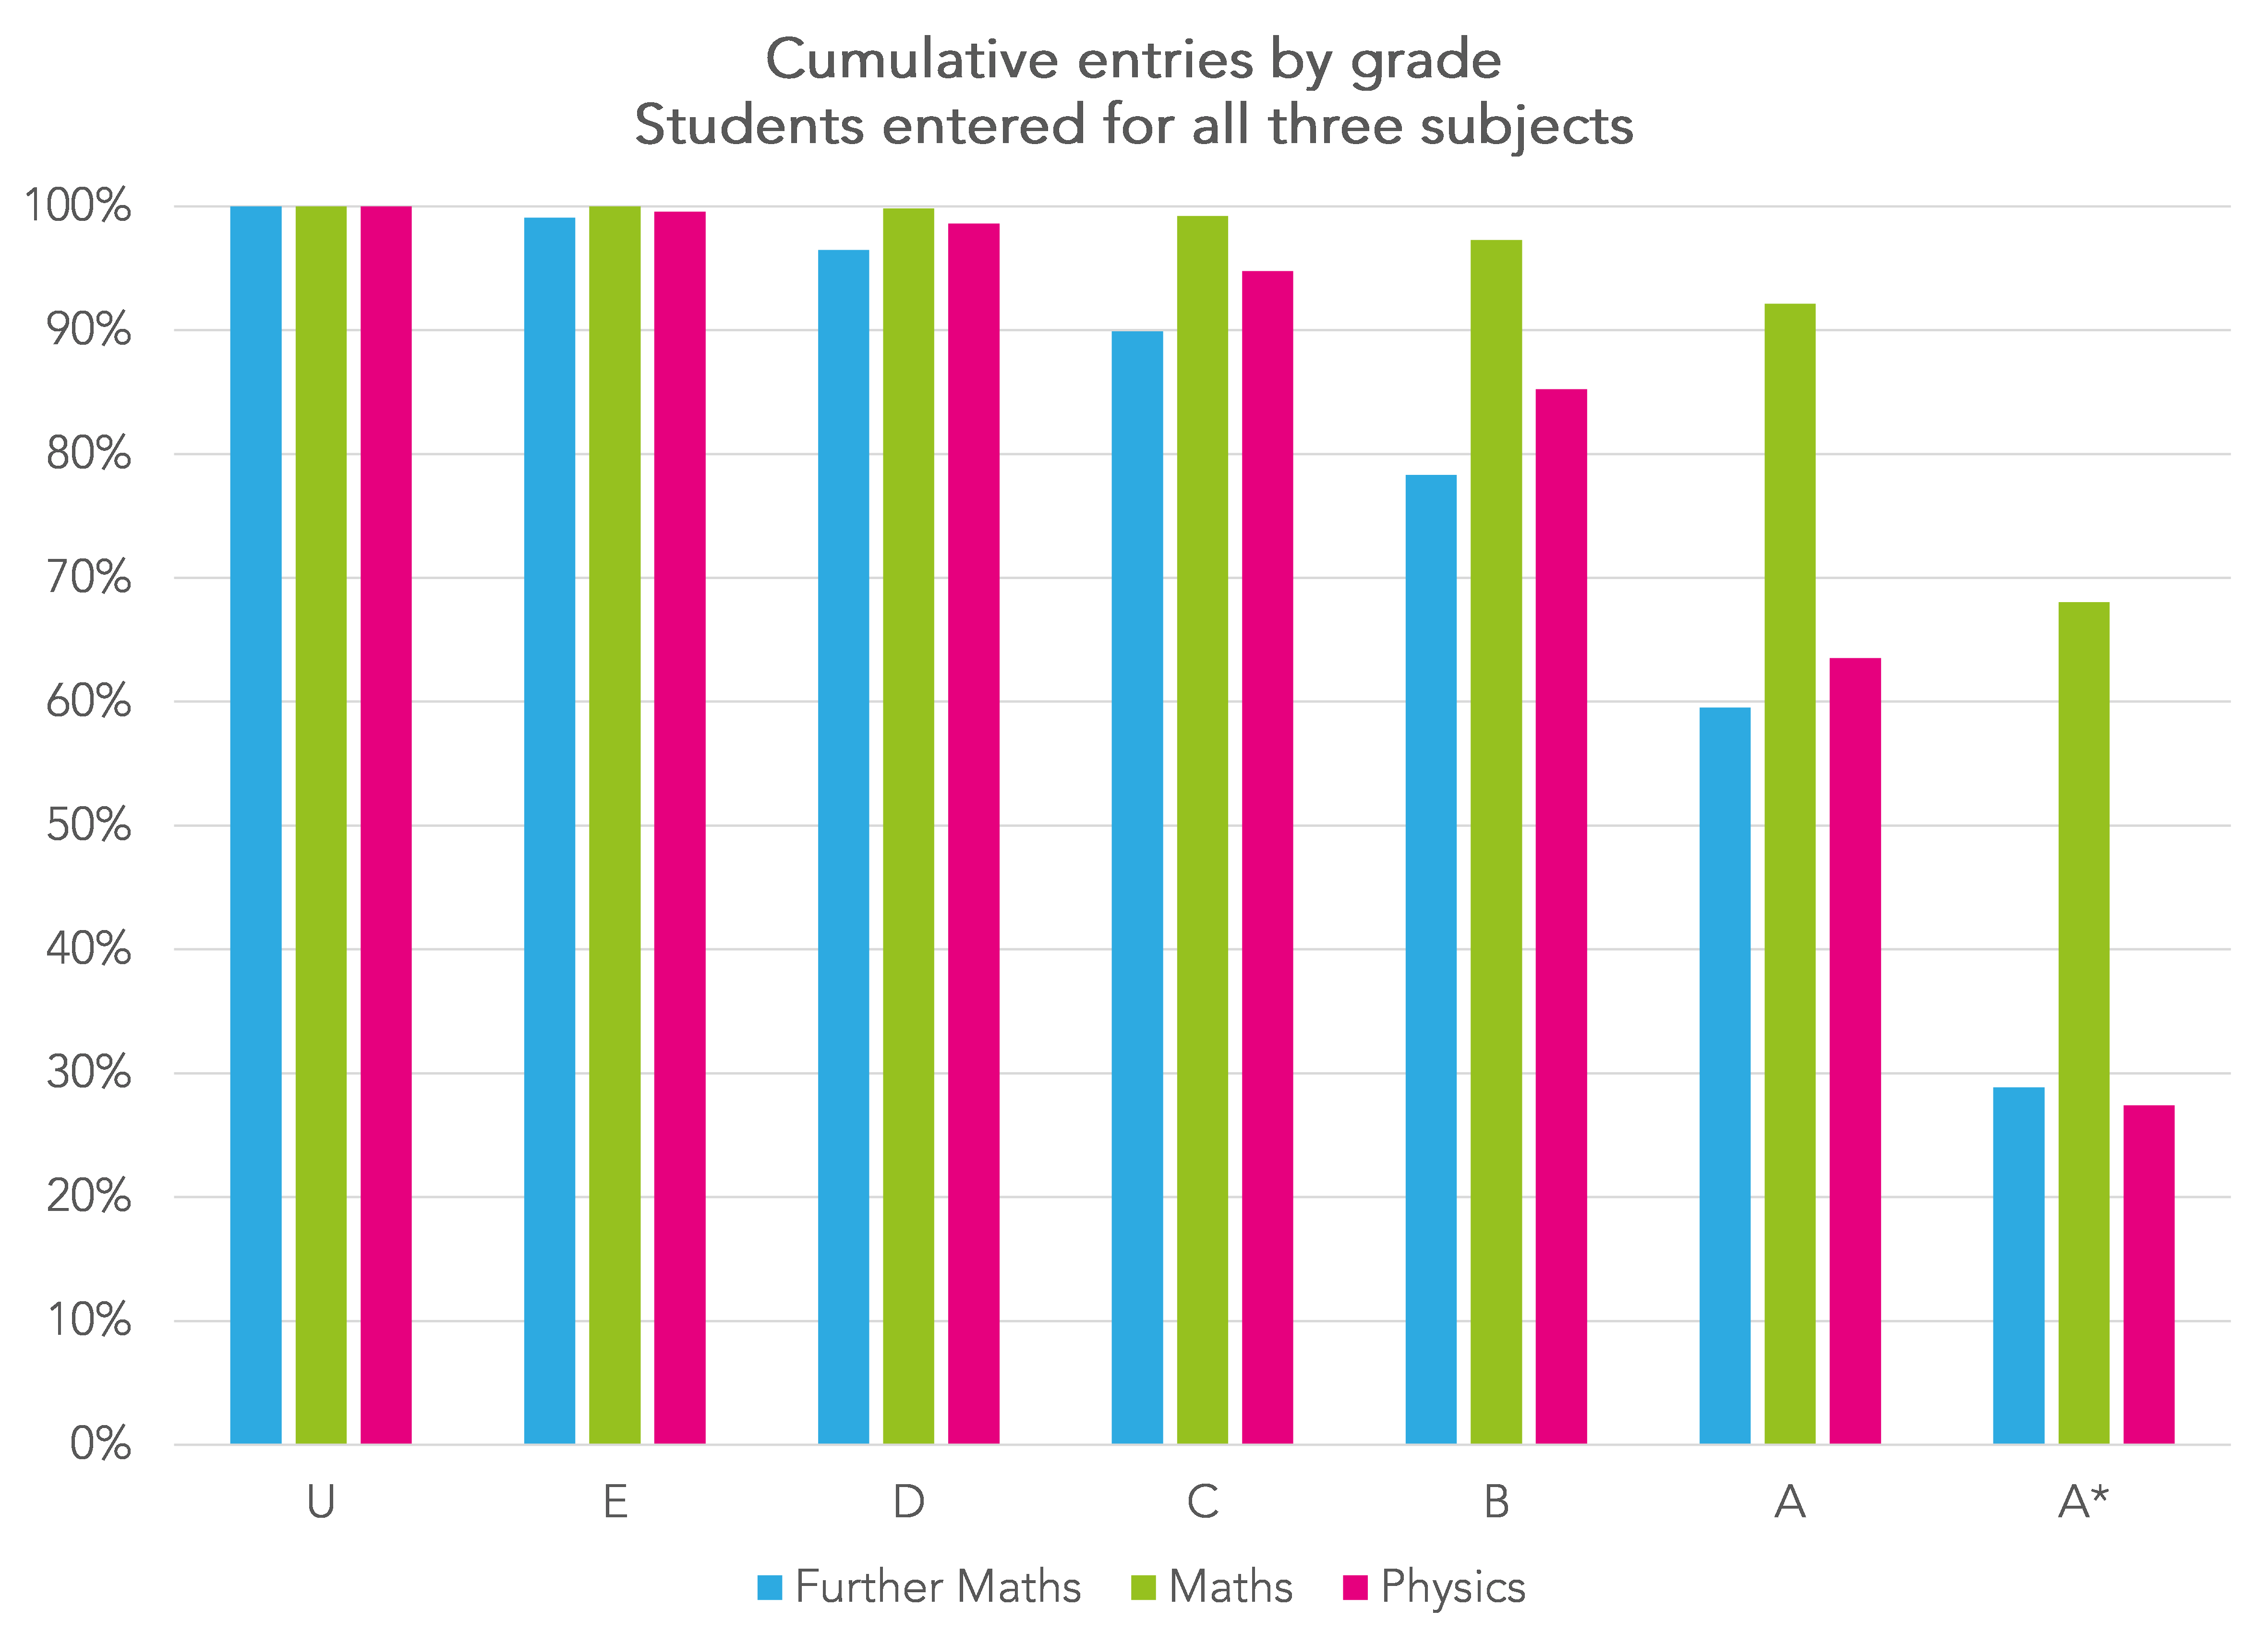
Here we see that grades in further maths also tend to be lower than at physics apart from at grade A*.
Finally four other subjects: computer science, economics, biology and geography.
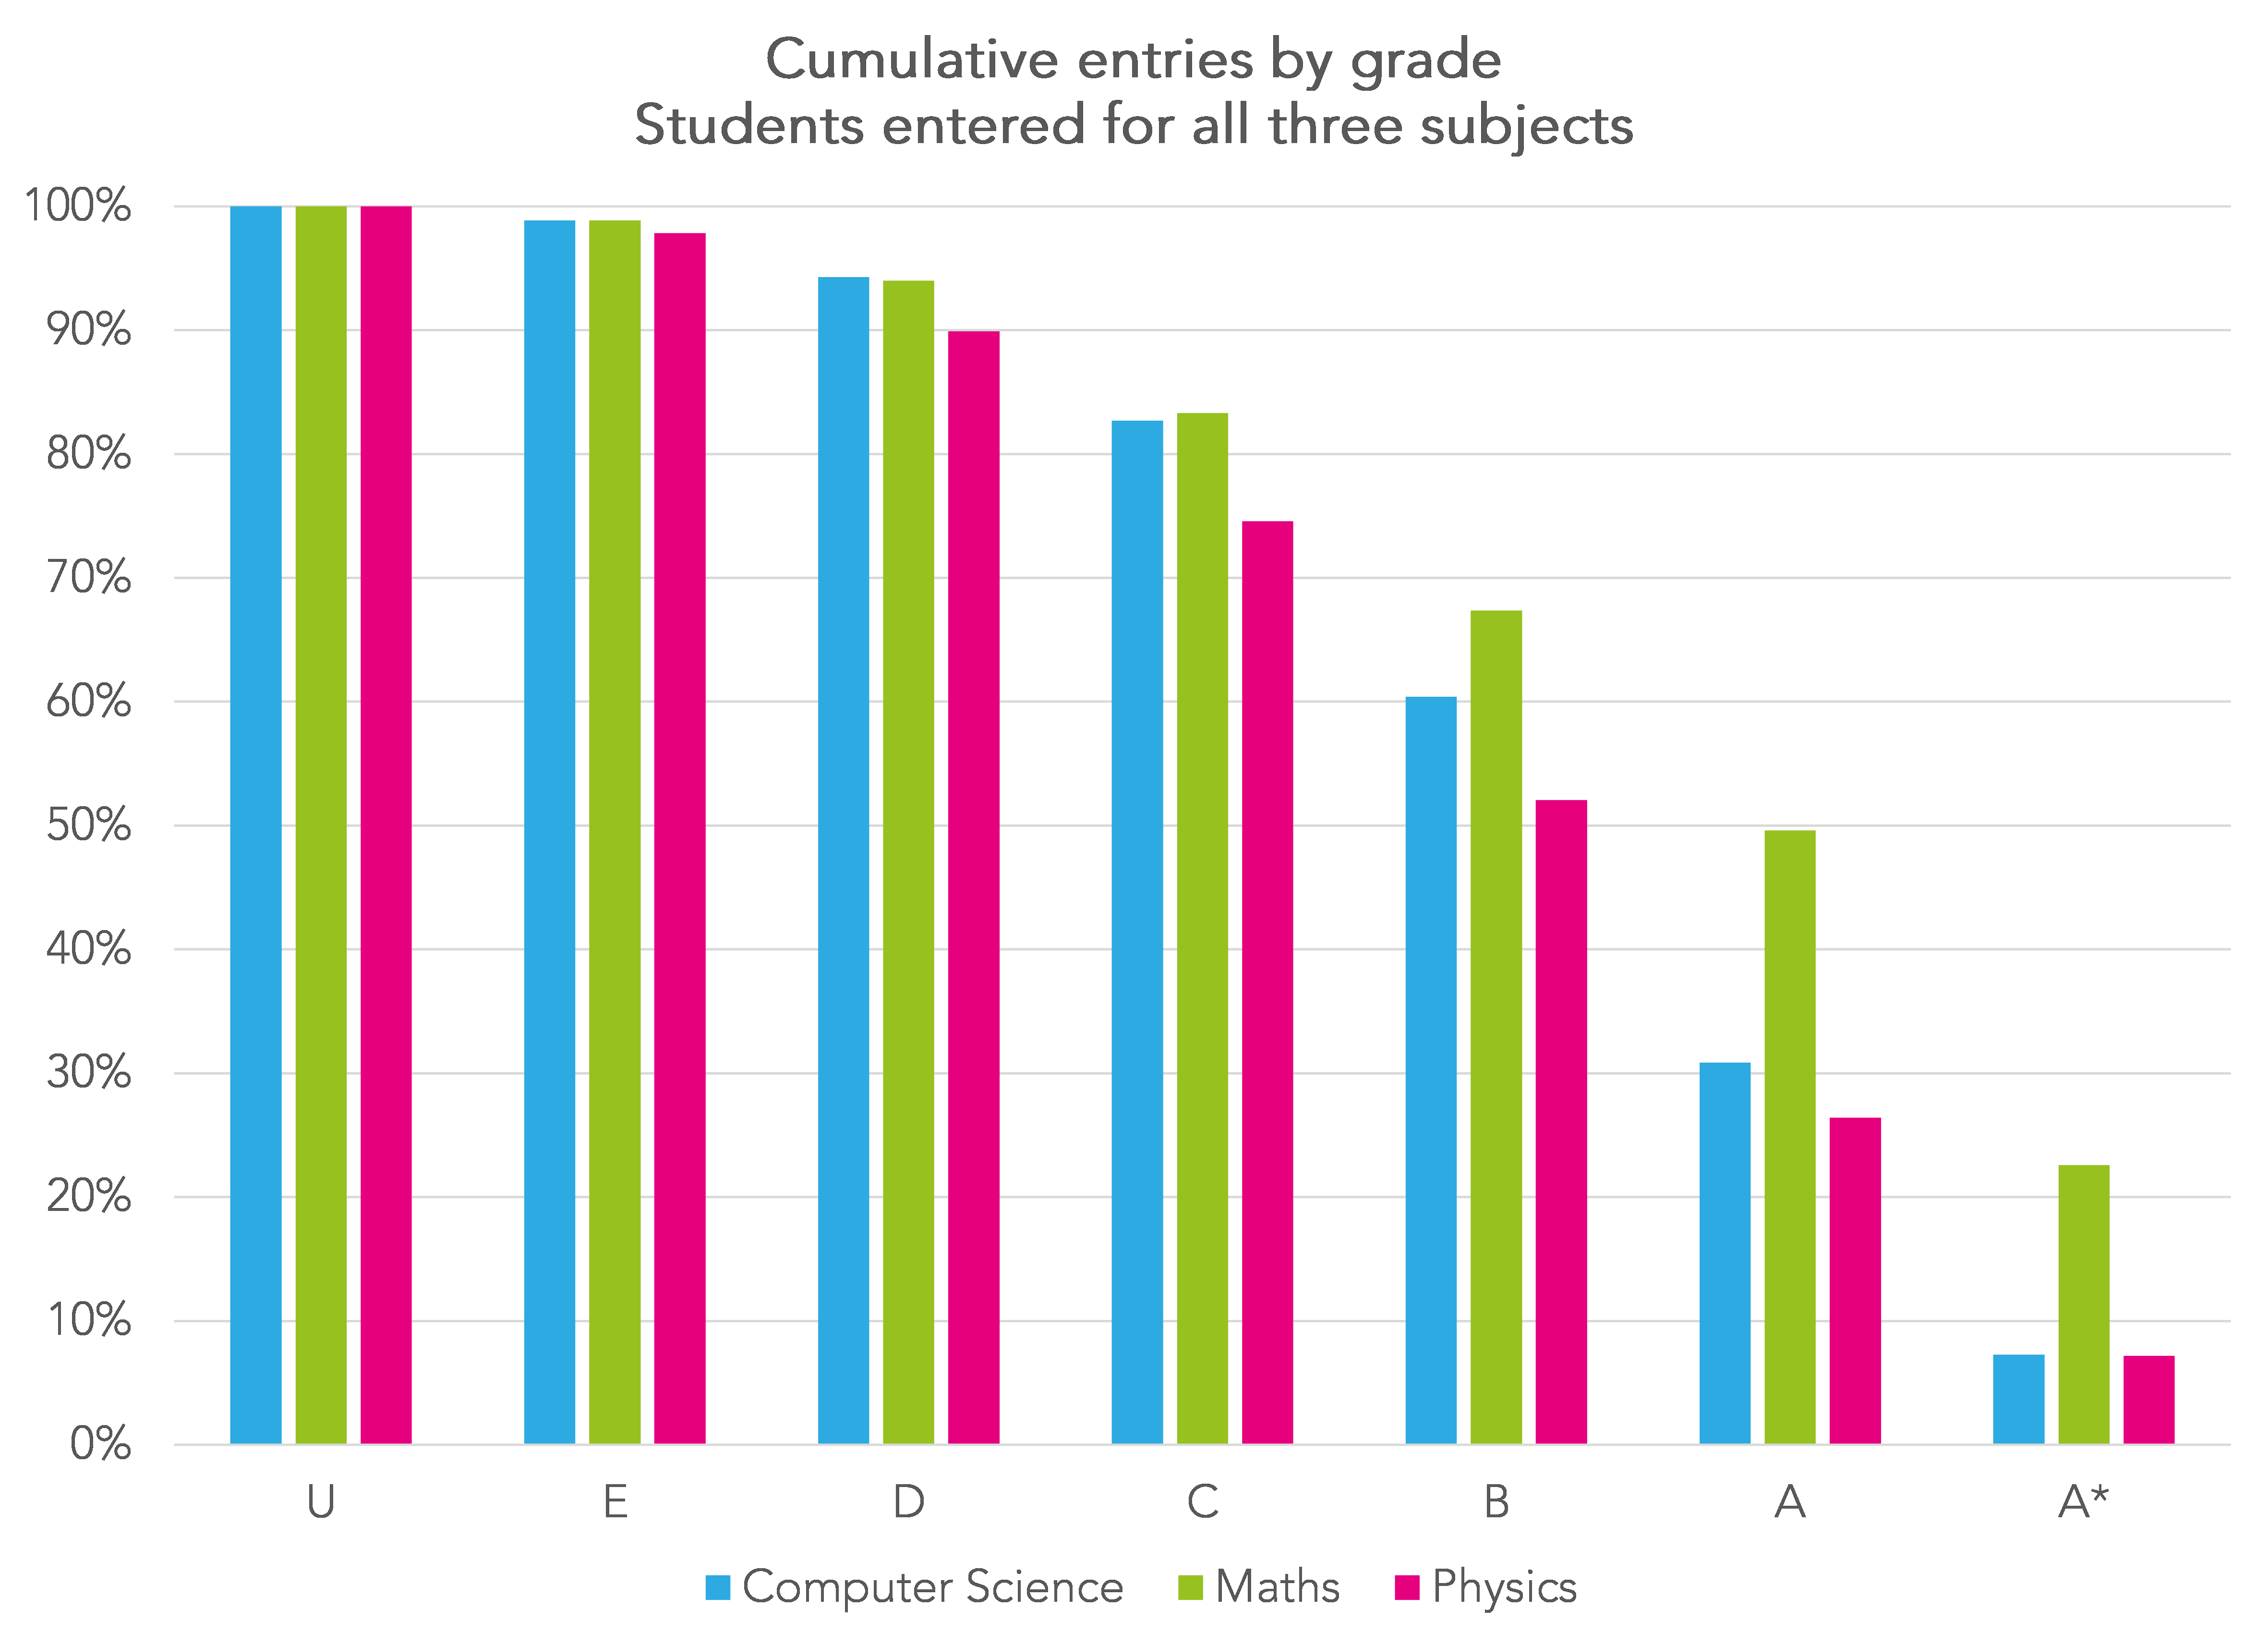
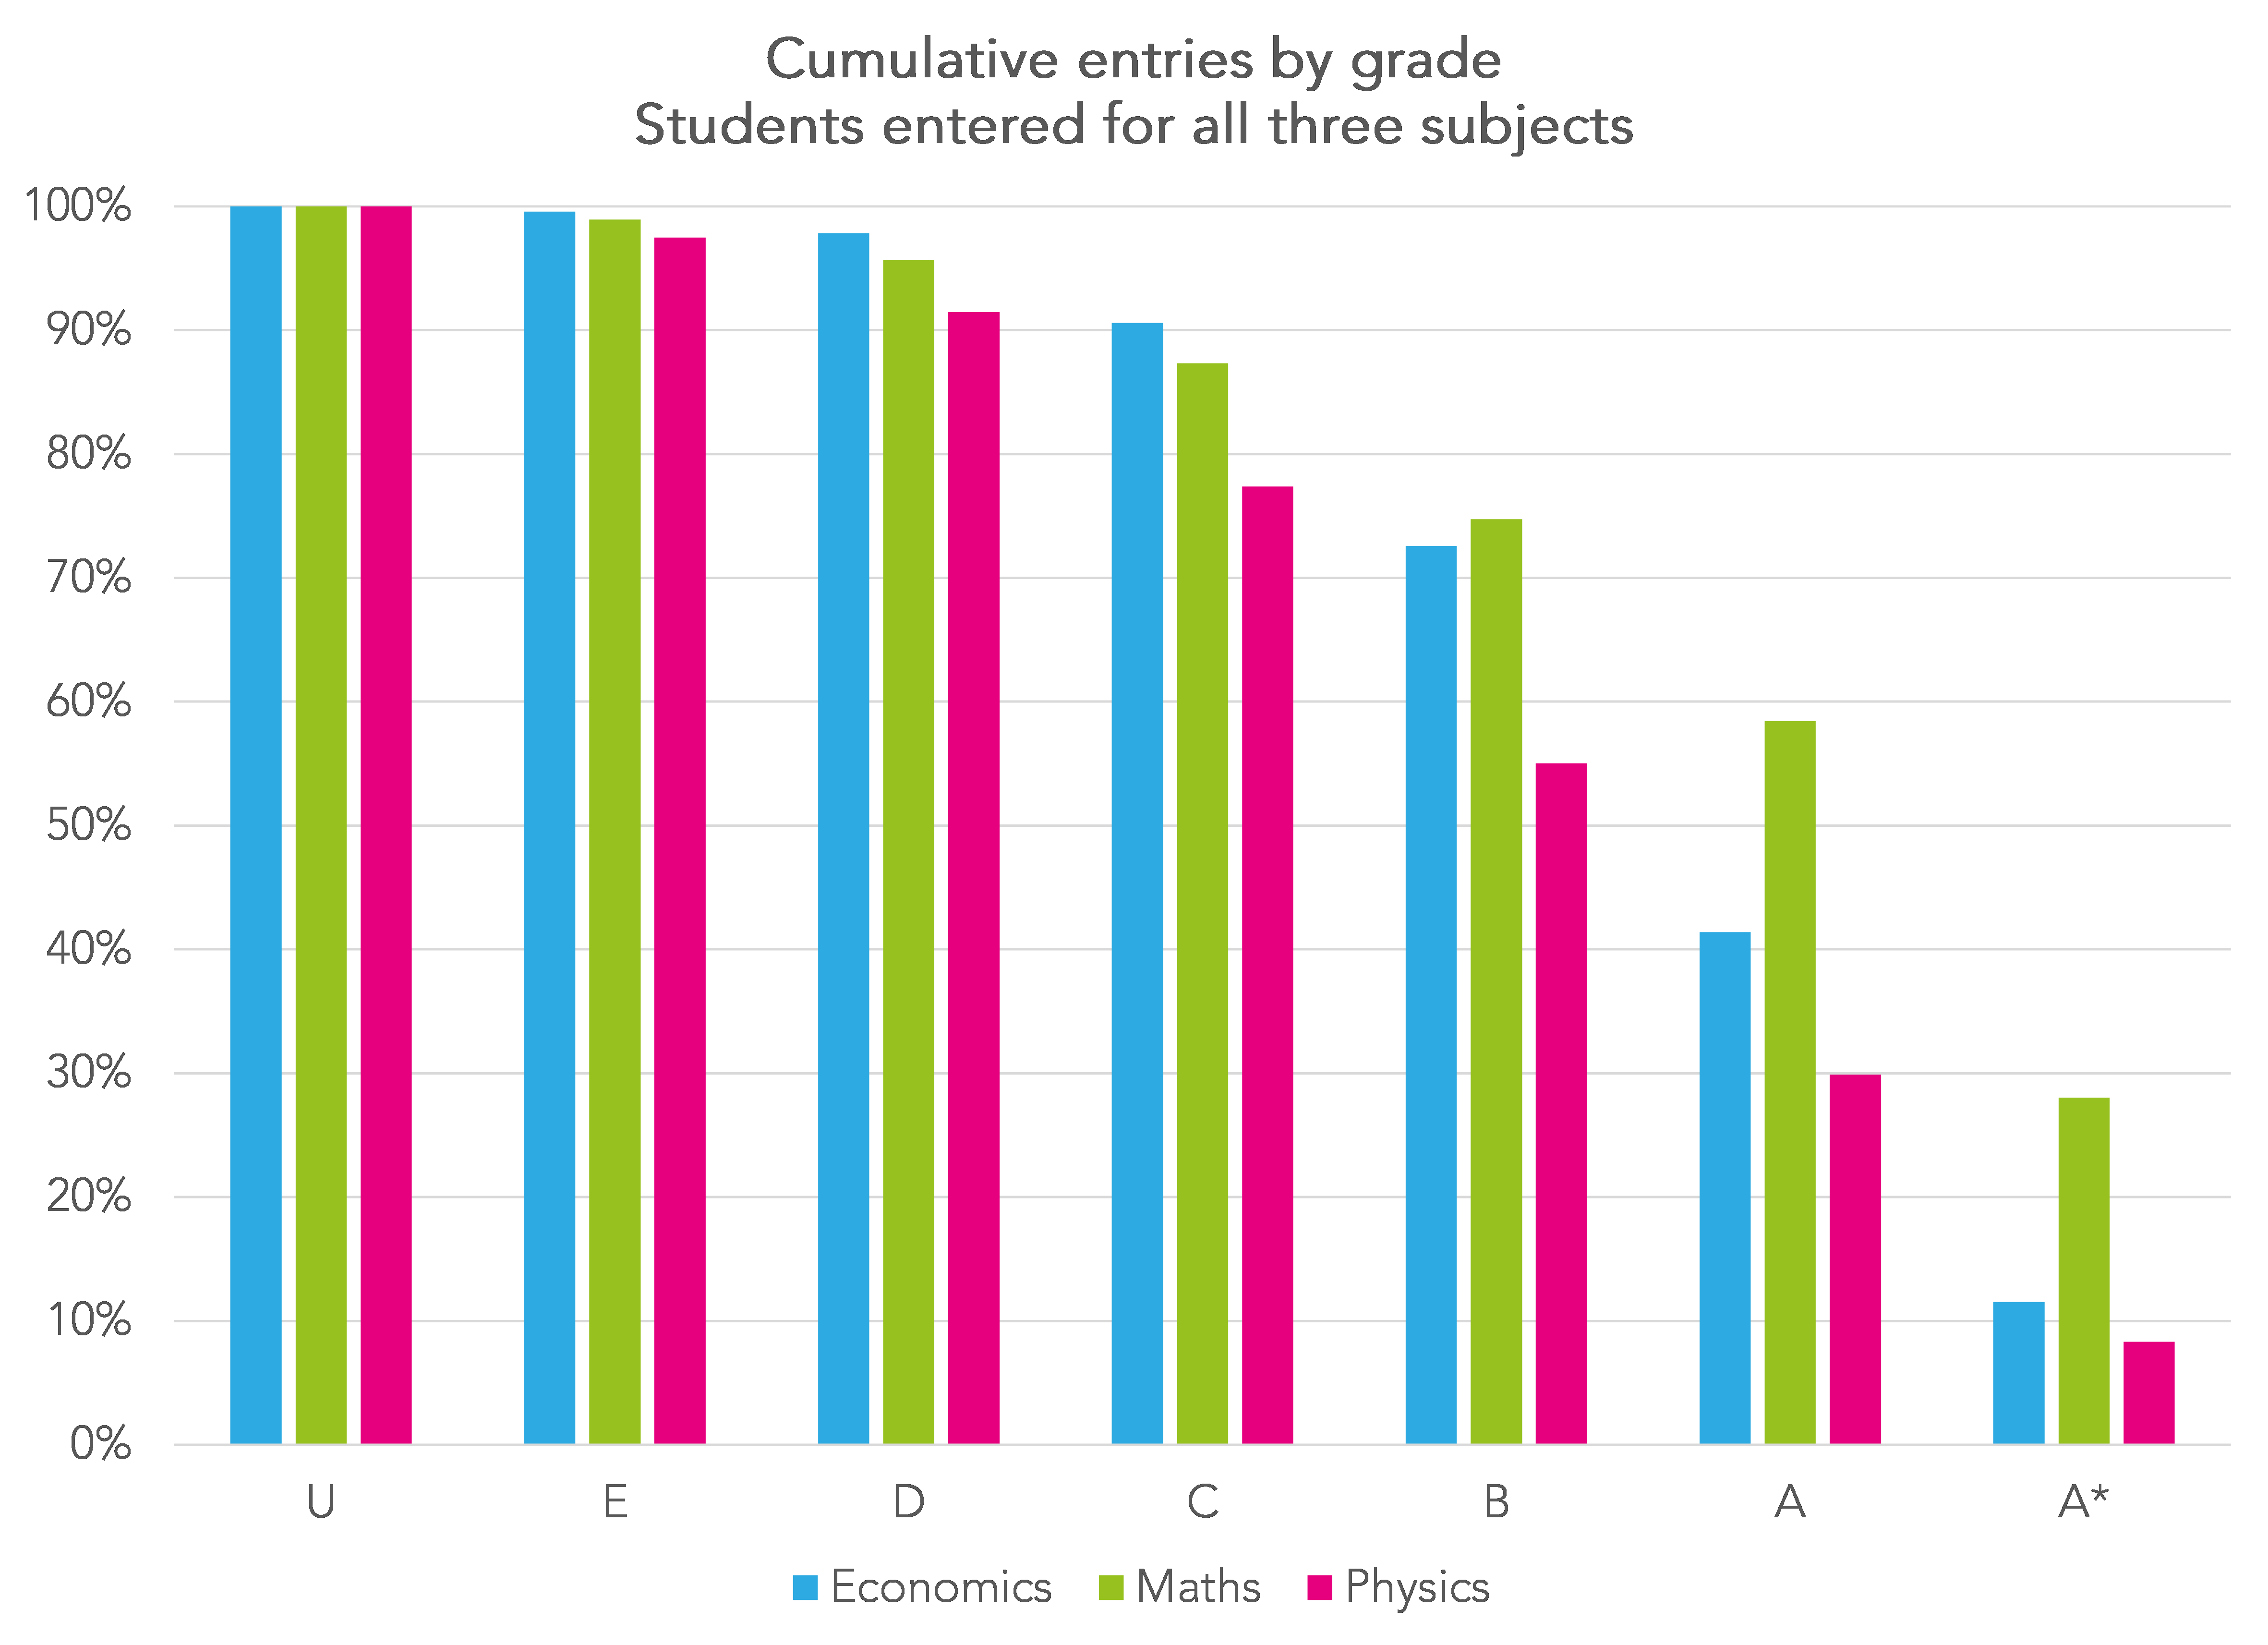
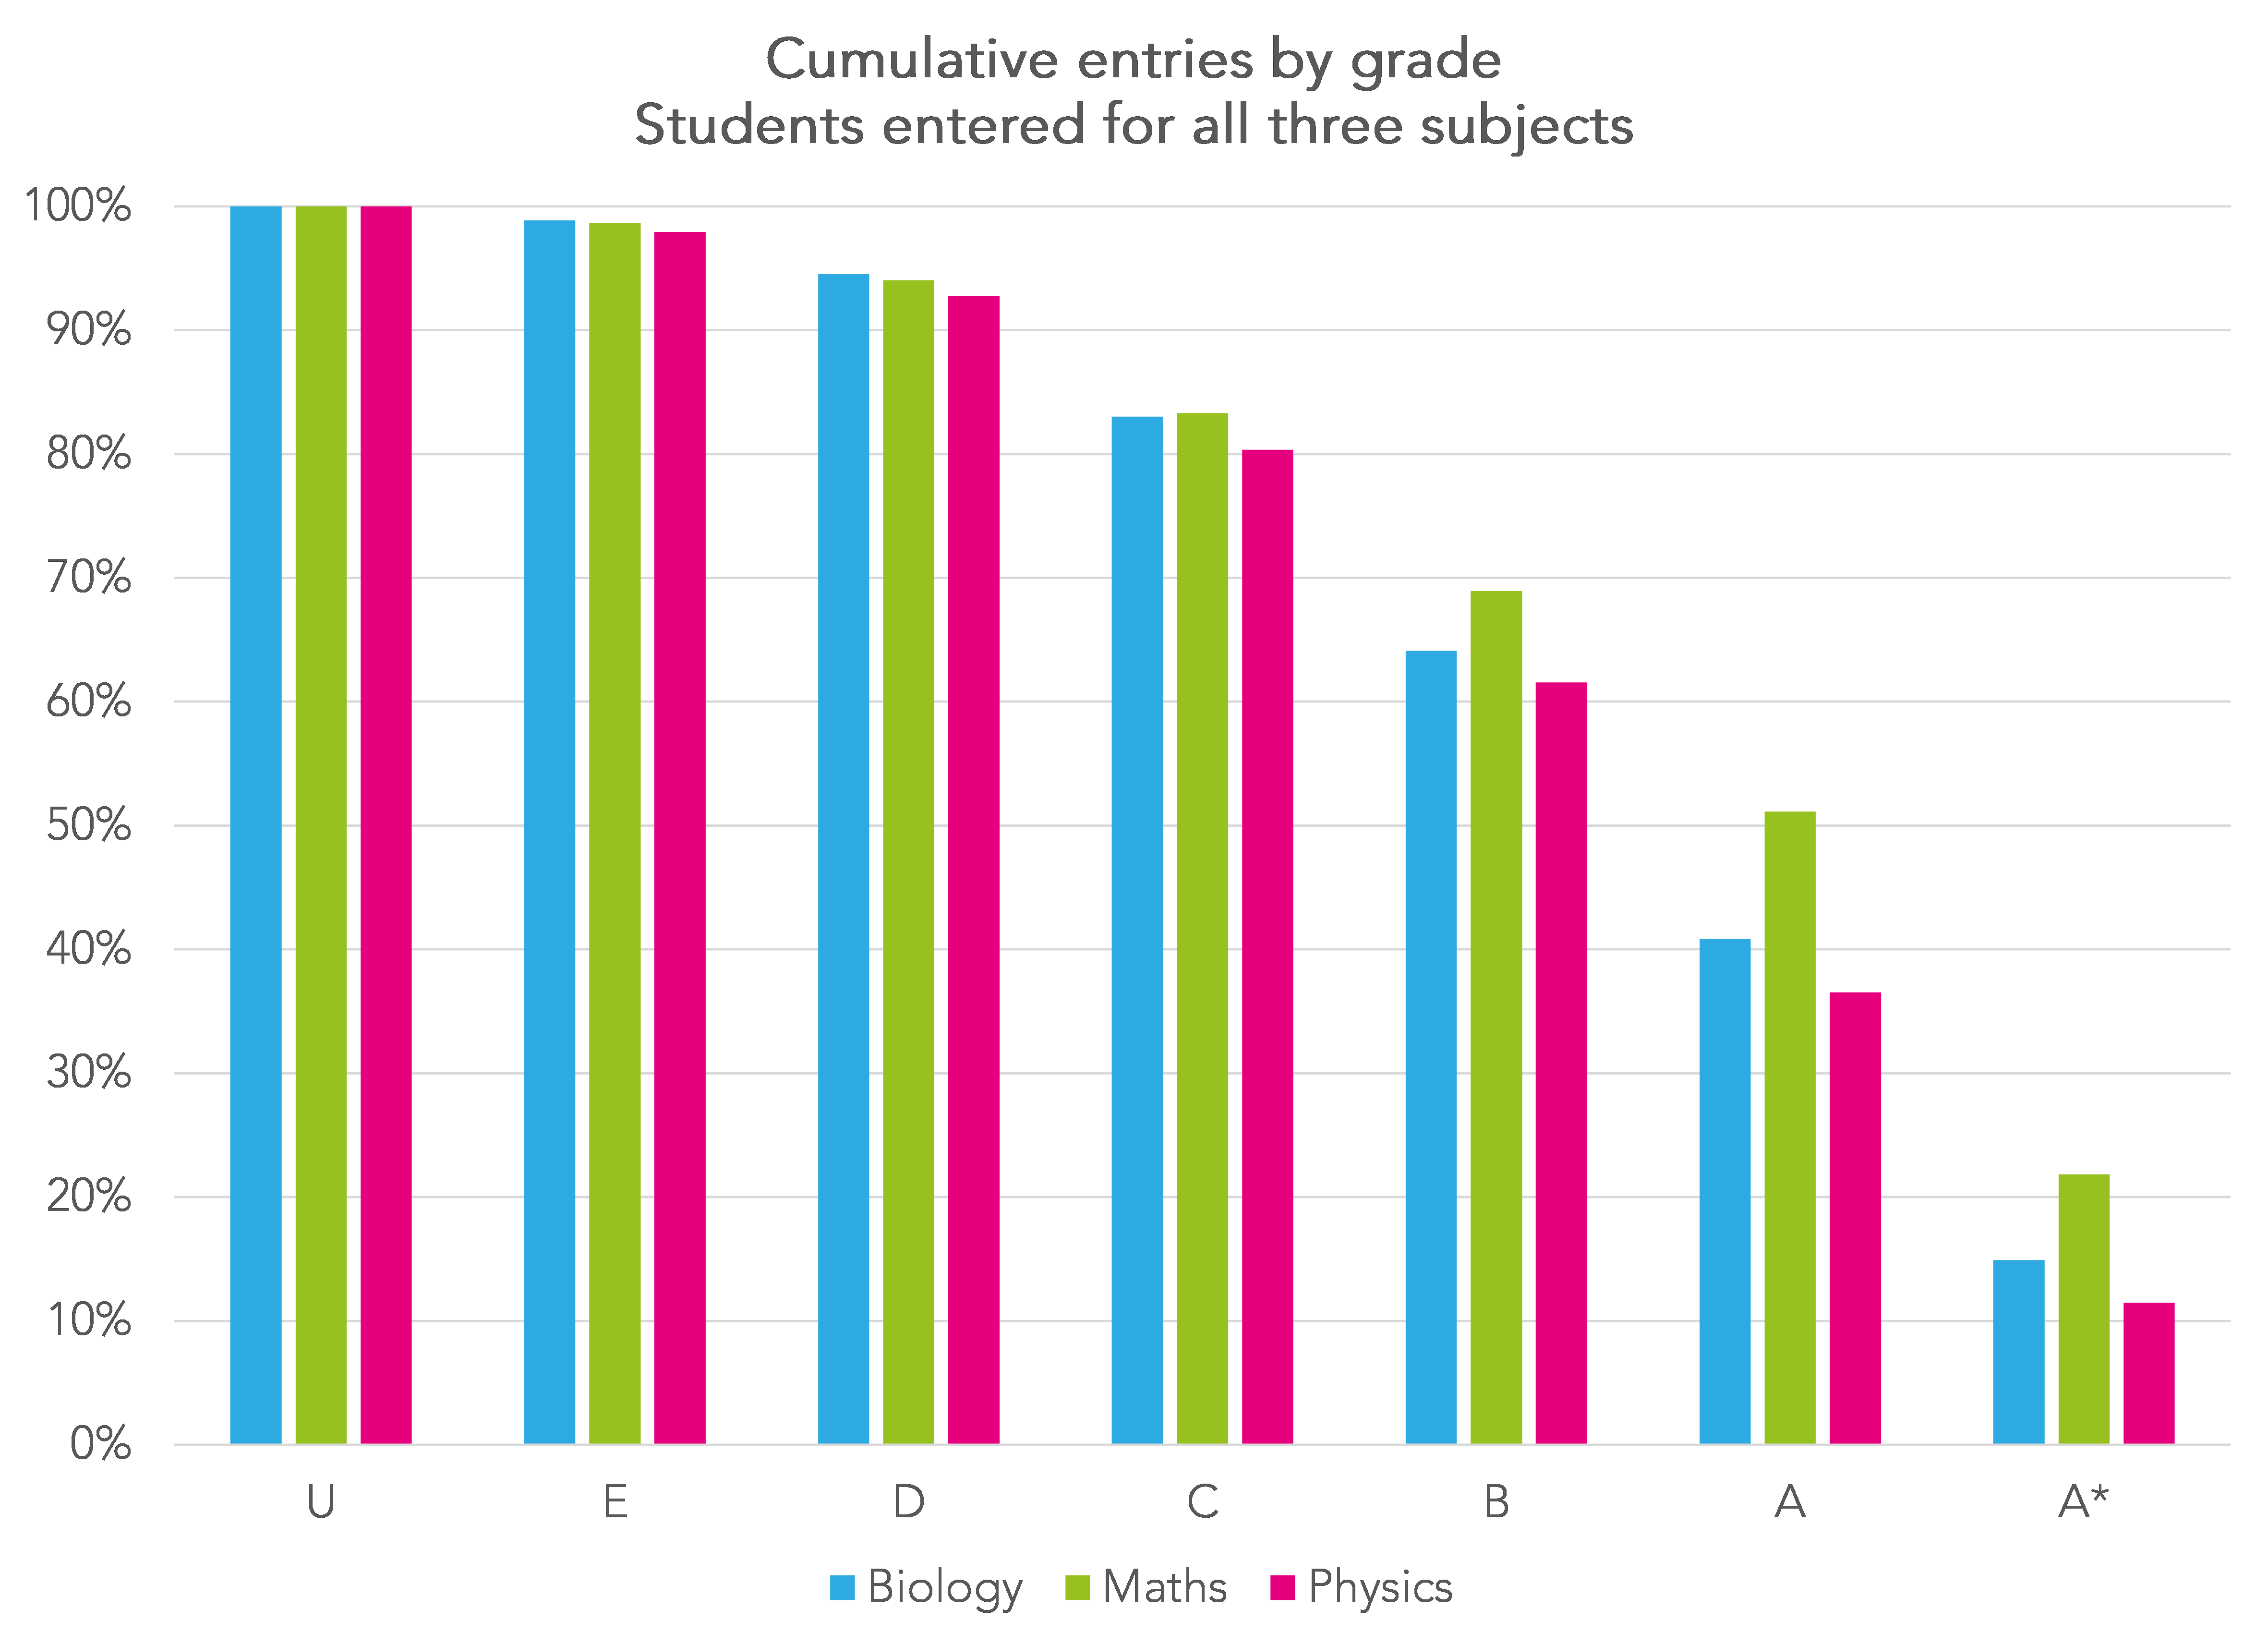
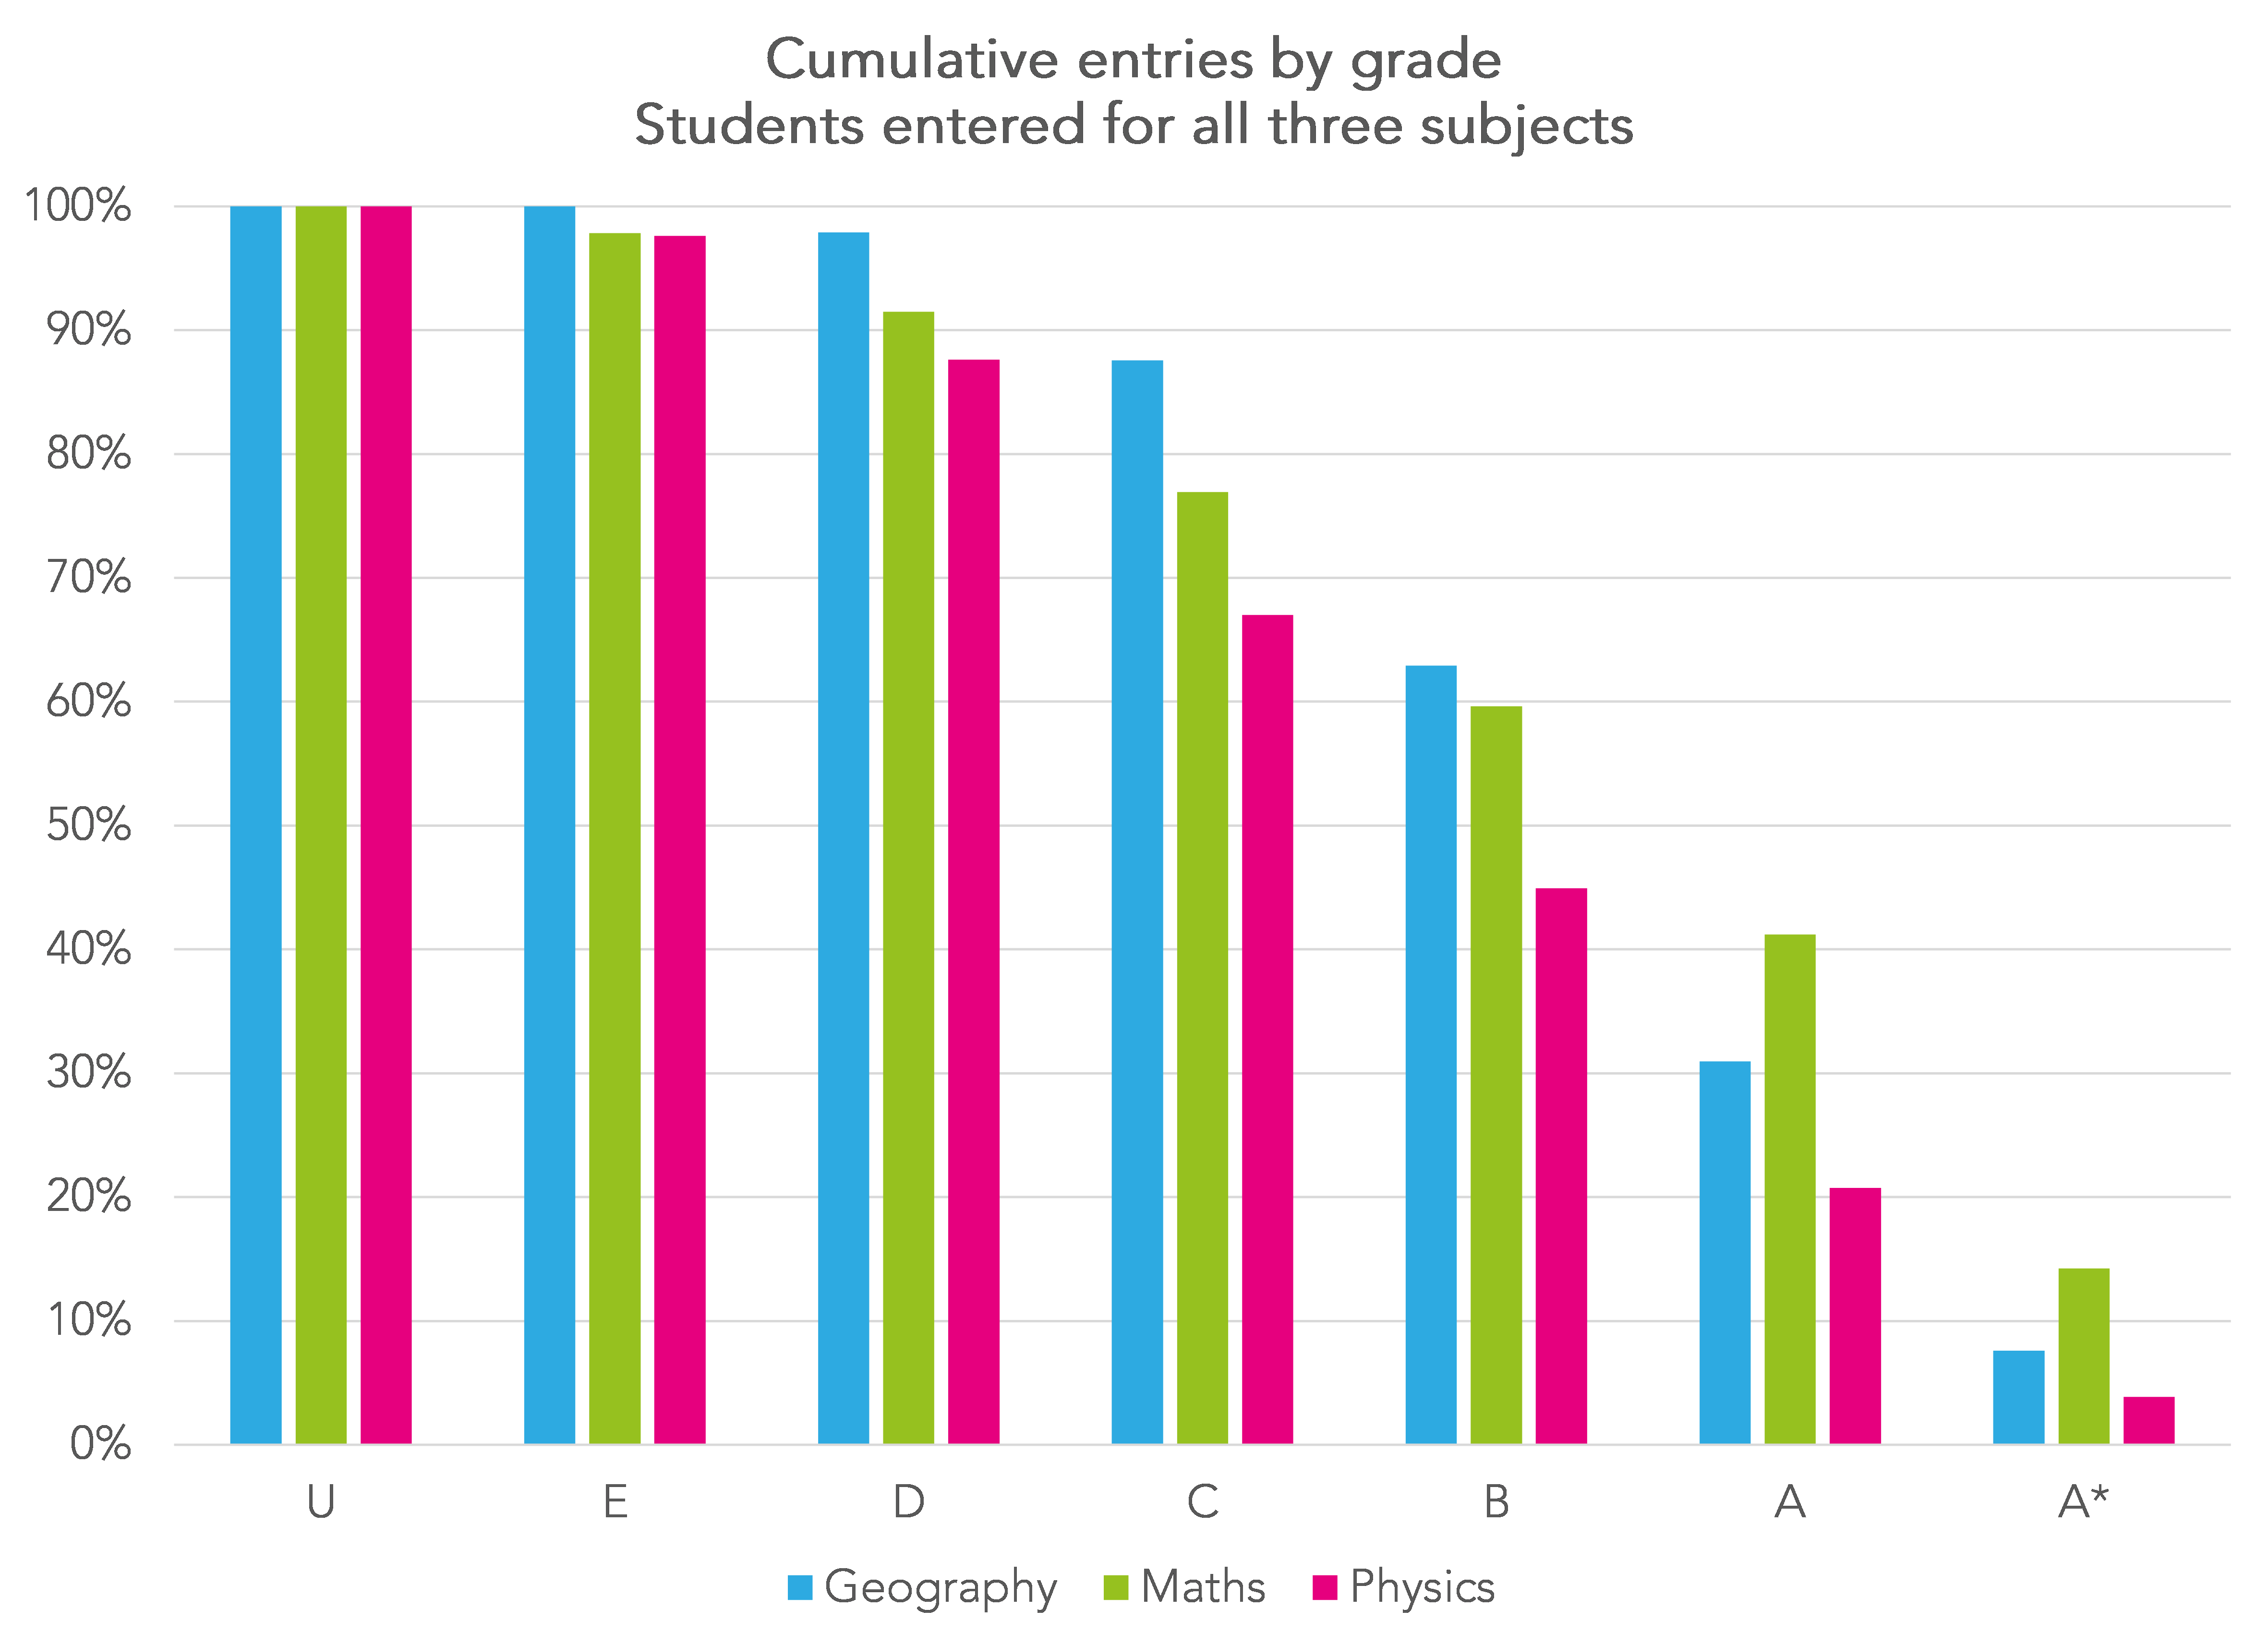
In all subjects and at all grades, attainment in physics is lower. However, a higher percentage of students achieve grade A*-A in maths.
Is maths graded too leniently?
This might lead you think that maths isn’t severely graded at all. But remember that we’re only looking at students who take physics.
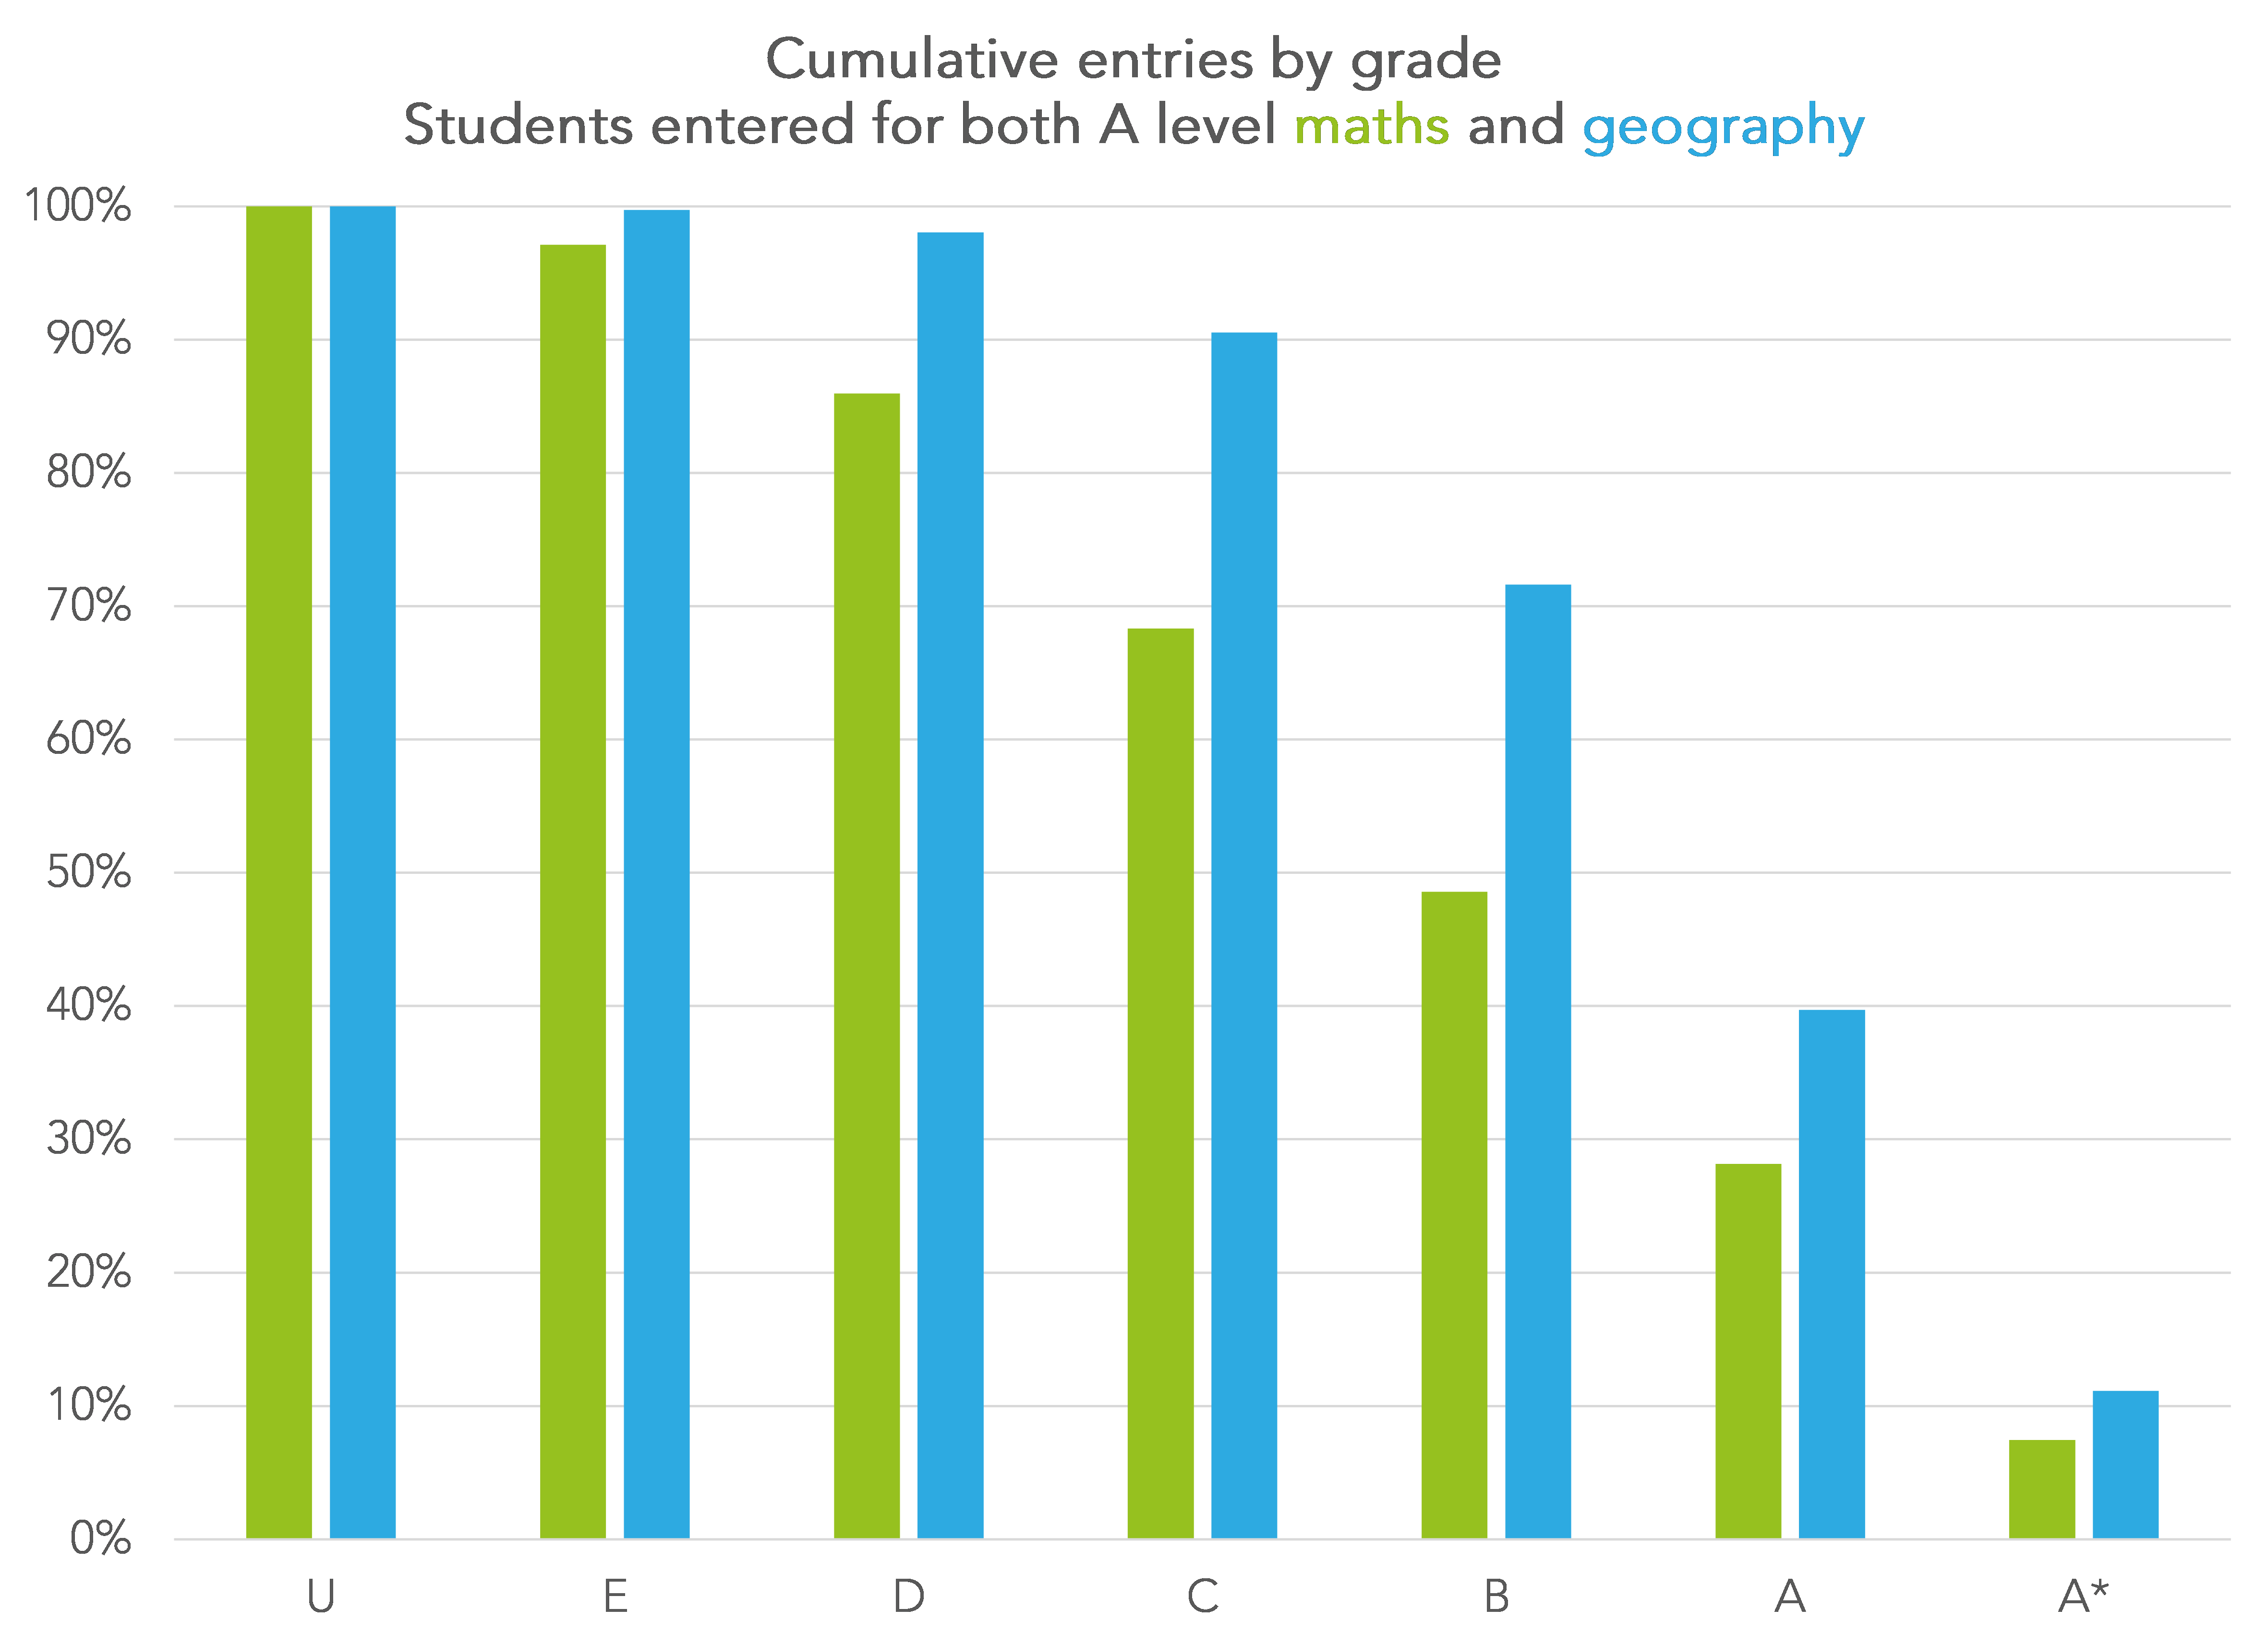
In the previous section we saw that more students achieved grade A*-A in maths than in geography. But this was only among those entered for physics.
Almost 4,000 students entered geography and maths but not physics. For this group, the picture is different. Attainment in geography exceeds maths in all subjects.
Similarly, there were nearly 2,000 students who entered both maths and A-level art and design. The chart below compares grades in both subjects for this group.
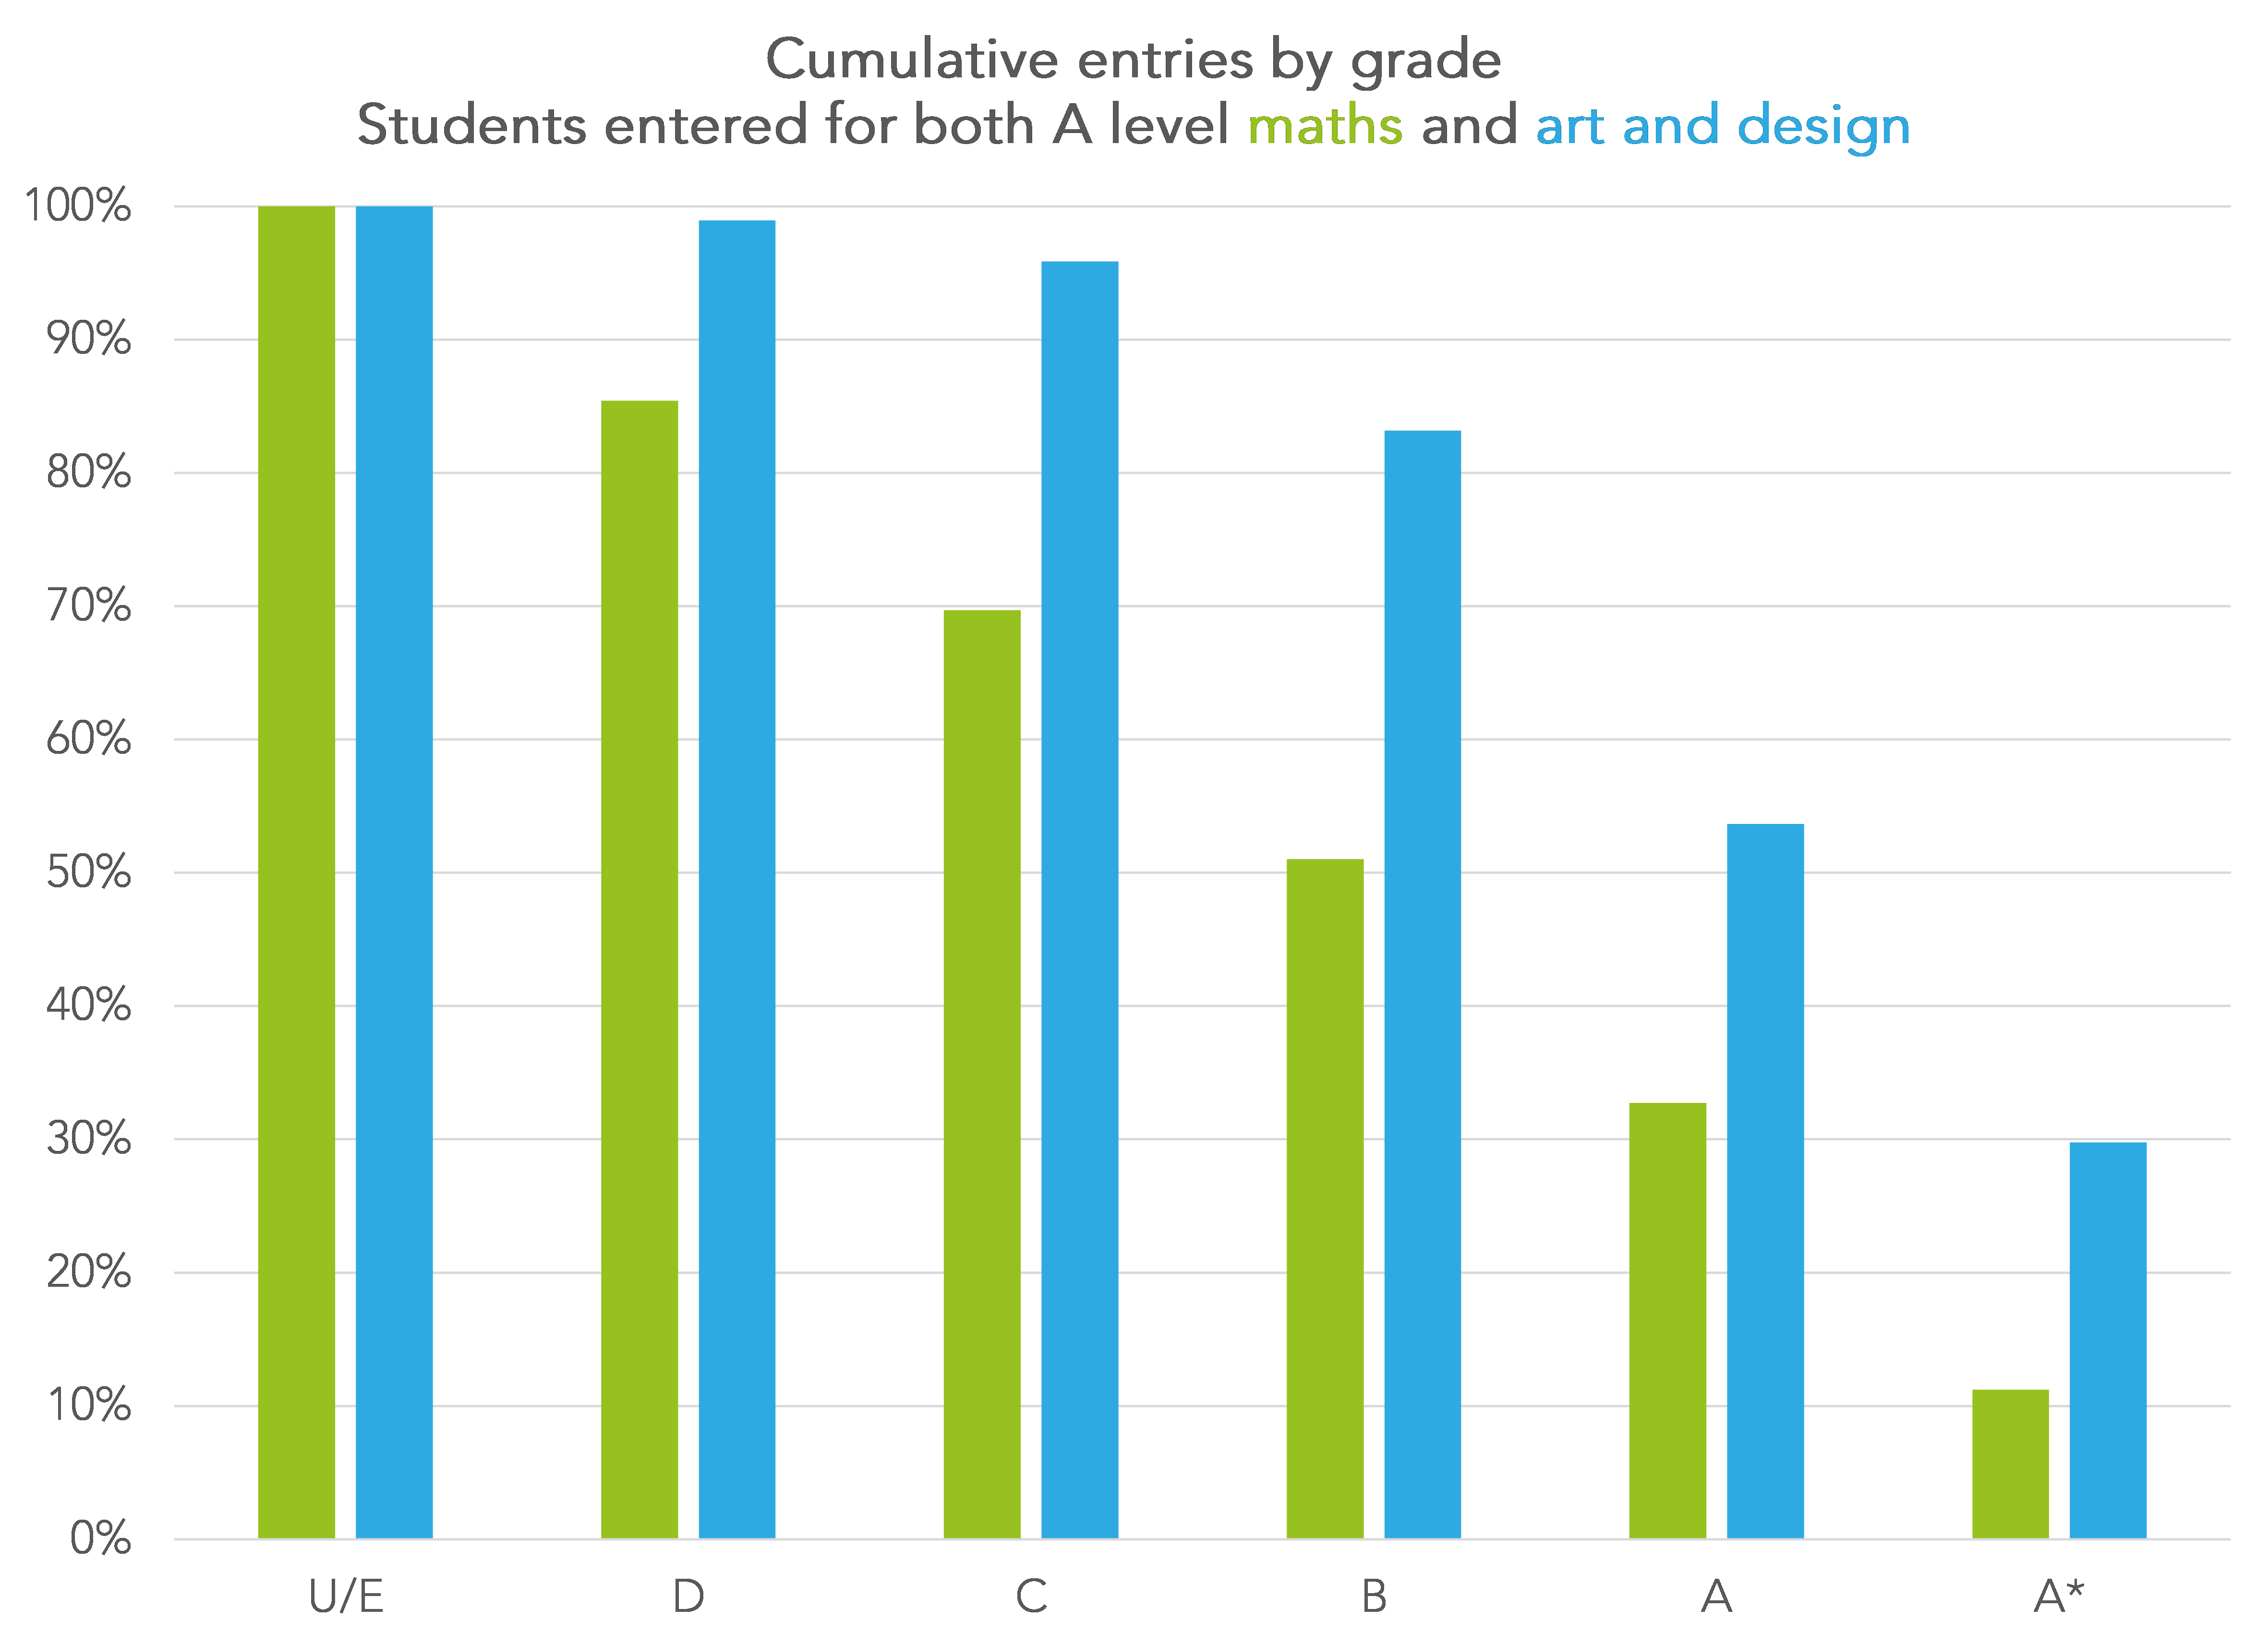
33% of students achieved A*-A in maths whereas 54% did so in art & design.
A-Level grading severity by subject in 2021
A quick tangent before finishing off. The chart below repeats the subject difficulty analysis for 2021 (when A levels were awarded based on teacher assessment grades) and compares to 2019. The puce squares represent the bars from the very first chart above.
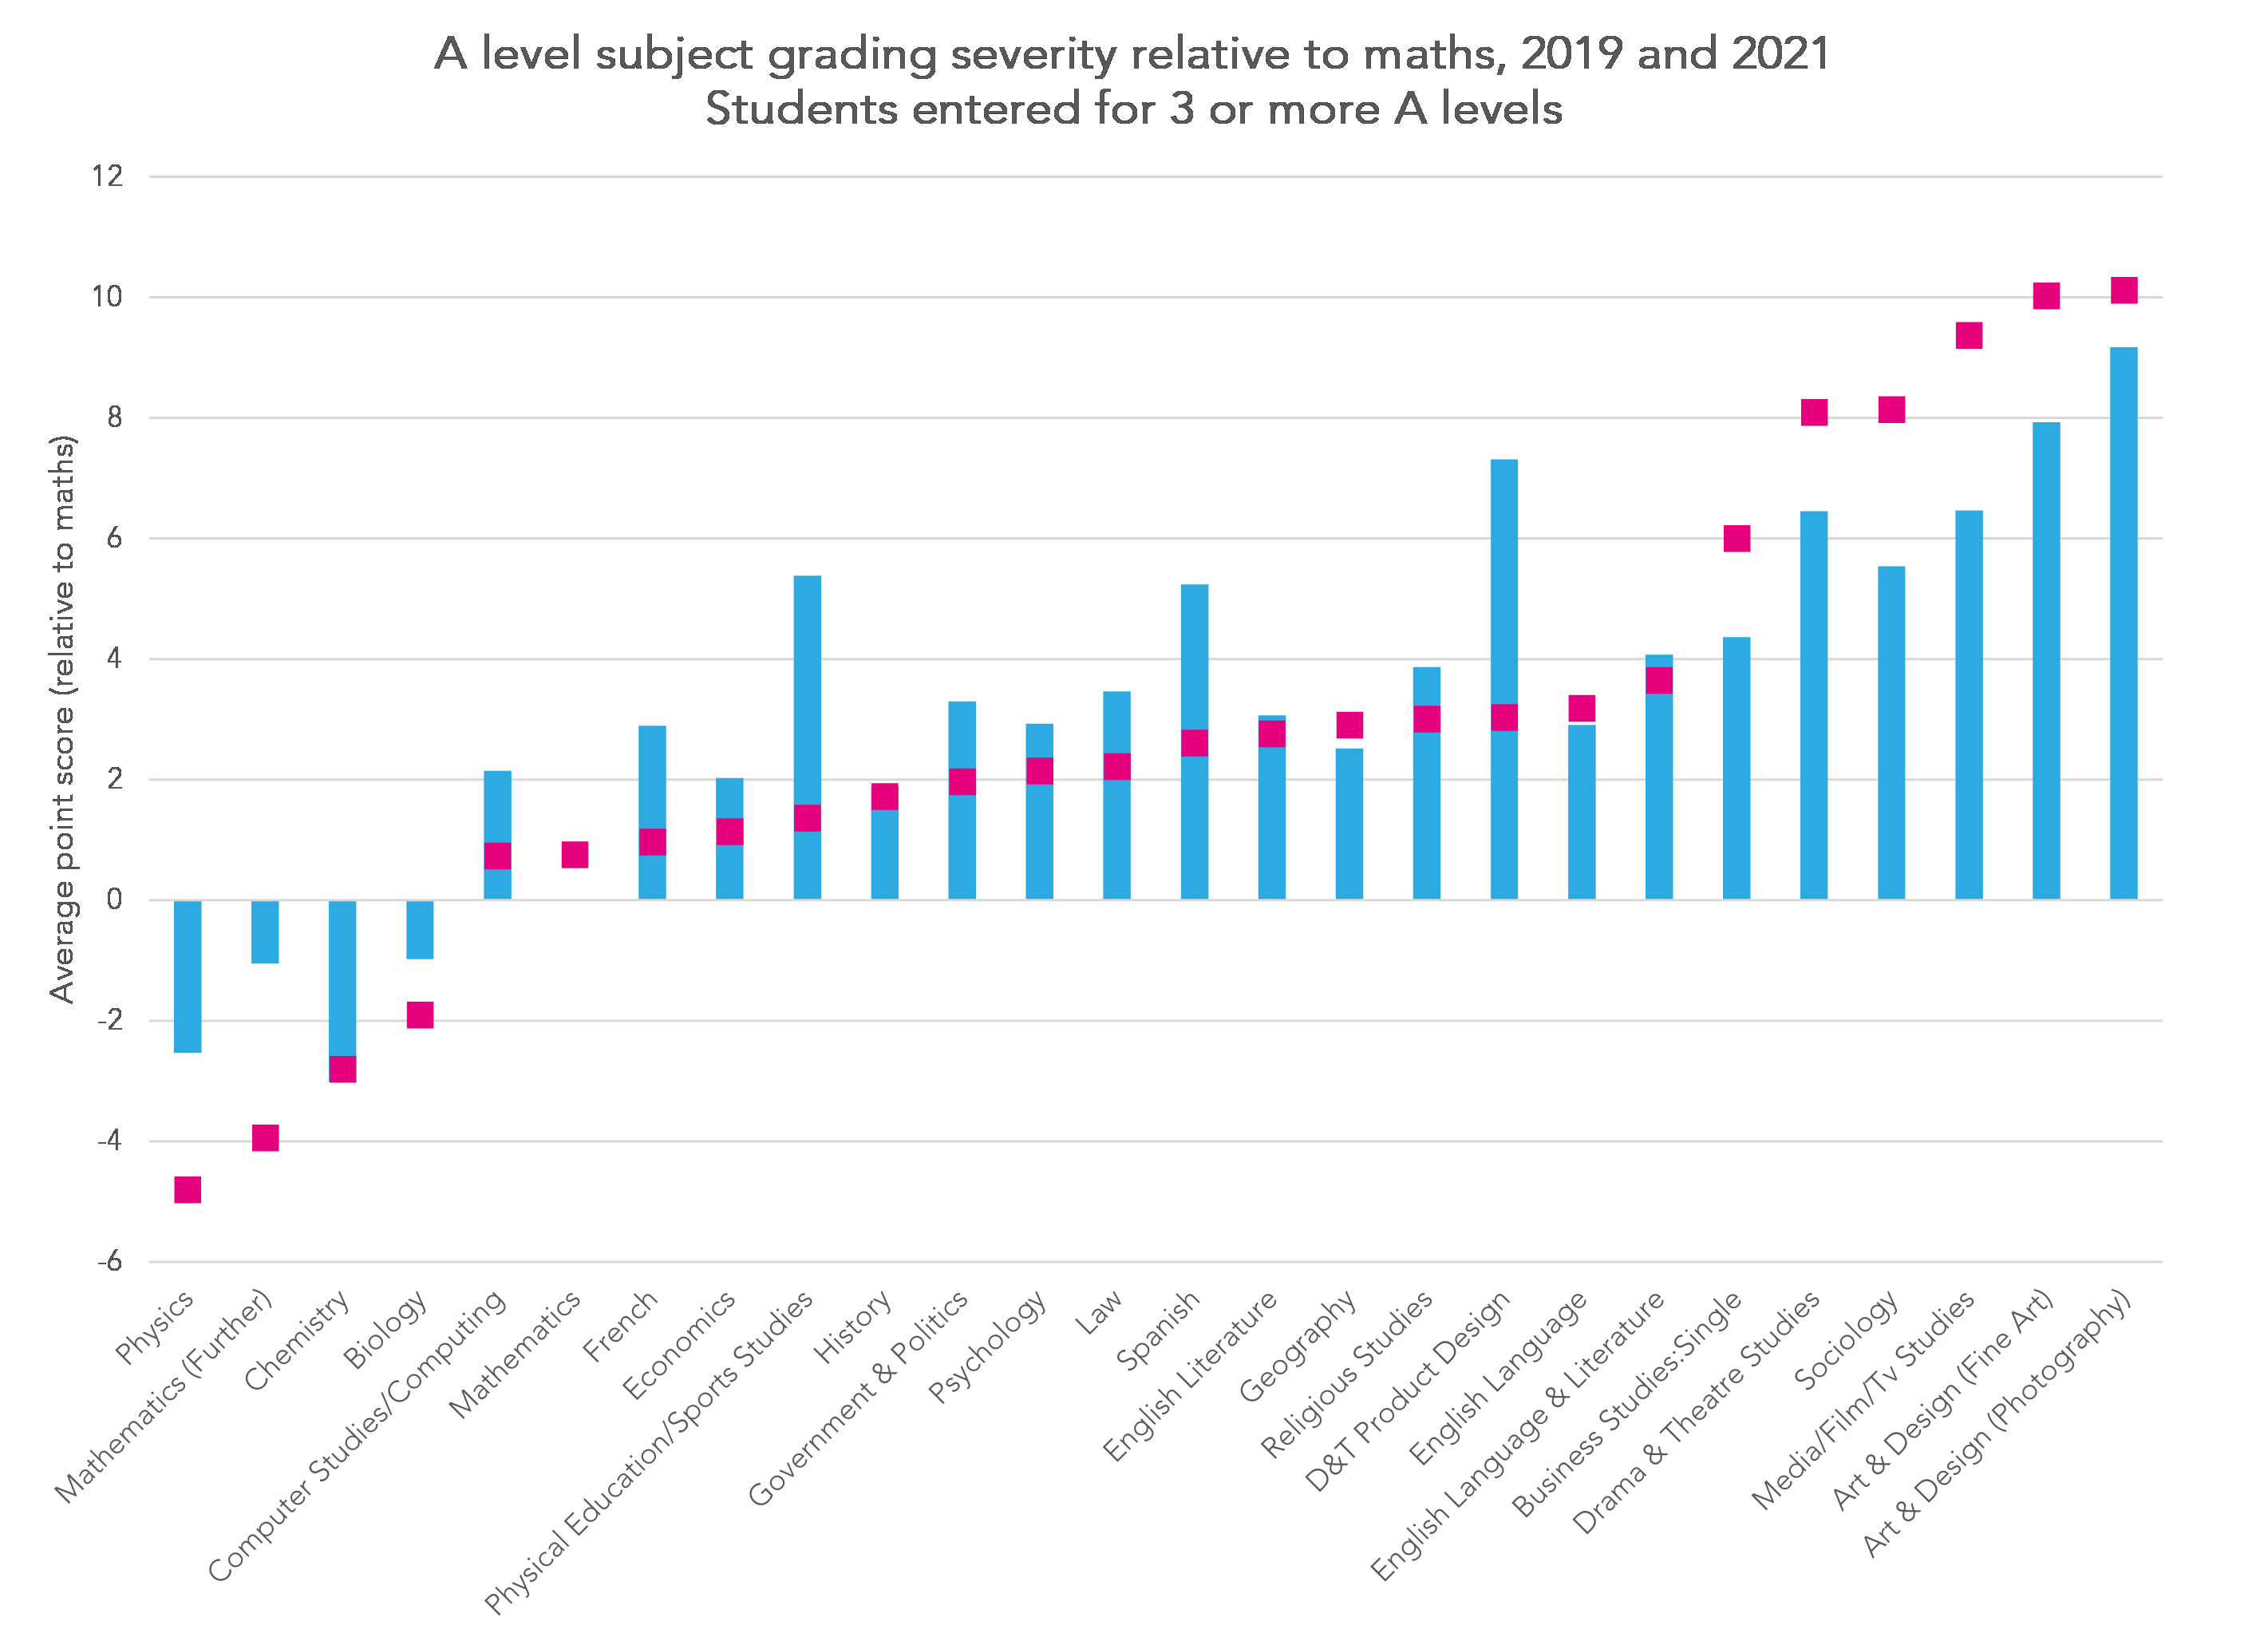
The pattern is broadly similar to 2019 with chemistry and physics remaining the most severely graded subjects. Overall, there’s perhaps slightly less variation between subjects in 2021. A few subjects, notably PE, Spanish and D&T appear to have been graded less severely in 2021 than in 2019.
Summing up
However we look at it, grades in physics tends to be more severely graded than other subjects.
Many physics students are also further penalised by taking it in combination with other severely graded subjects, particularly chemistry and further maths.
This may not matter if students are taking physics with a view to pursuing it at higher education. All other potential university entrants will be in a similar position (at least if they have taken A-Levels).
But if they are looking at university routes that do not require physics, they may be at a disadvantage as a result of having a lower grade than they might have achieved had they taken another subject.
1 A*=60; A=50; B=40; C=30; D=20; E=10; U=0
2 The STATA command for this is: mixed points i.subject, || student:,
Want to stay up-to-date with the latest research from FFT Education Datalab? Sign up to Datalab’s mailing list to get notifications about new blogposts, or to receive the team’s half-termly newsletter.


Are students being ‘triply disadvantaged’ by taking the STEM route? Is the attainment gap also wider for KS2 -> GCSE for Physics than other subjects? The absence of KS3 data makes this much harder to gauge as most students do not do much science at KS2. A more useful comparison might be to compare combined science with separate sciences.
I think another contribution to the KS4-KS5 attainment gap is that GCSE Physics is much more a test of memory, whereas A Level is a test of problem solving. GCSE Physics students have to memorise the equations, whereas A Level students are given an extensive data booklet. The exam results for this year will be interesting in this regard because the GCSE students have been given a formula booklet this year.