Measuring changes in pupil attainment is at the heart of our work as education researchers. It is a practice that is also routinely carried out in schools to monitor pupil progress and teaching quality. One means of doing this is through the purchase of standardised tests in core subjects such as maths and English that report a student’s performance relative to a national distribution.
The Education Endowment Foundation (EEF) regularly uses these standardised tests in their randomised controlled trials. When trials are completed, the data is archived routinely and matched to administrative exams data as it becomes available. This presents a unique opportunity for independent researchers to analyse the statistical properties of these commercial tests, which will in turn inform trial design, but also has important implications for how they are used in schools.
Earlier this year we analysed the student test data [PDF] drawn from 14 of the largest trials run so far, all of which now are matched to Key Stage 2 data from government tests sat at age 11. One part of our analysis measures the predictive validity of the commercial assessments with respect to the Key Stage 2 test in the same subject (i.e. maths or English). Predictive validity is simply the extent to which a score on a test predicts scores on some other test. Where it is low, we worry about both reliabilities of one or other of the tests and/or whether the tests are measuring similar underlying constructs (validity).
In this blogpost I raise several concerns arising from our findings. First, data from a single commercial test is unlikely to show whether a school is making good progress in a subject if test conditions are not standardised across schools. This means it will probably not be a good predictor of a school’s ‘value added’ between Key Stage 1 and Key Stage 2 SATs. Second, while short assessments designed to be completed within a lesson can help teachers monitor what students can do, they are rarely capable of telling us what sort of progress an individual student has made in the previous year.
We measured the correlation between pupil Key Stage 2 maths test results and their score in earlier tests that were administered as part of the EEF trials. The chart below plots the correlation between the test sat and the KS2 maths test on the vertical axis. The horizontal axis plots the time in months between the test and the KS2 maths test. The vertical red line illustrates the May Year 6 date of the KS2 SATs tests. The bunching of points on the left hand side of the chart shows the Key Stage 1 assessments, which are taken approximately 48 months earlier.
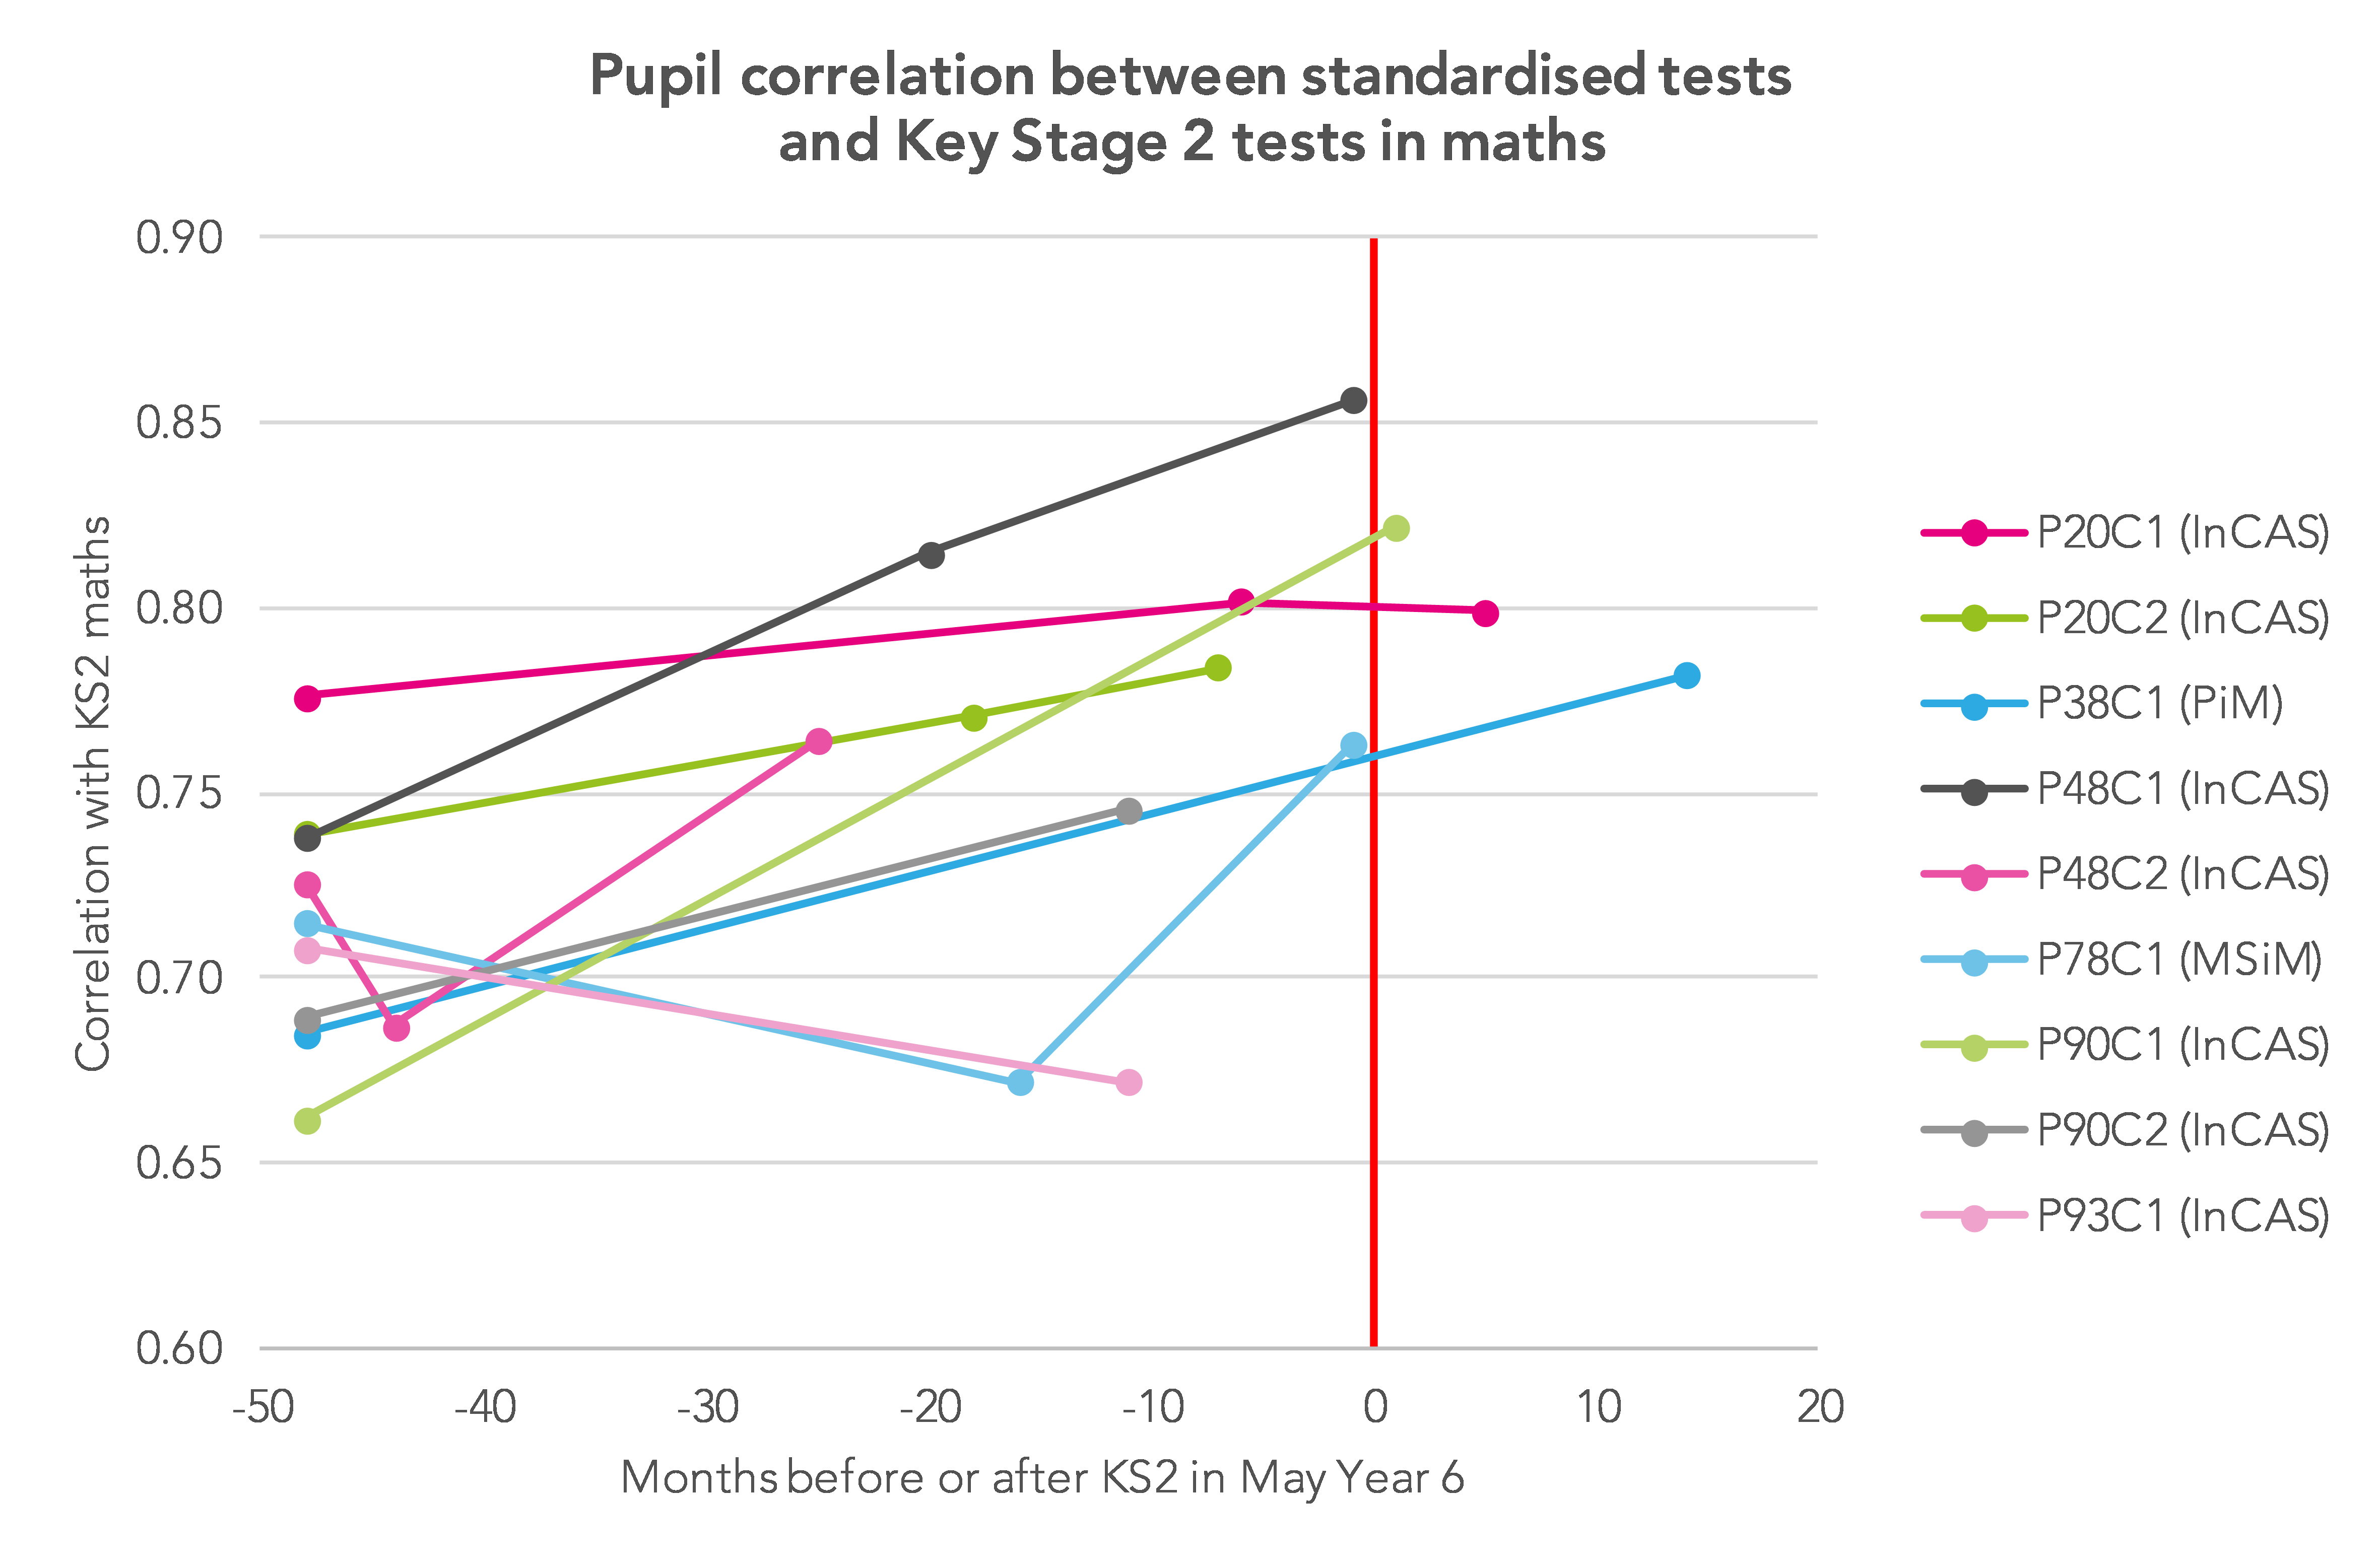
The correlation between these standardised tests and the KS2 maths tests was generally not as high as we had expected. We had expected most trials to follow a standard pattern whereby, the closer in time the standardised test to KS2 SATs, the higher the correlation; and that the correlation would be much higher for these standardised tests than it would be for the KS1 maths test taken much earlier in the year, for which we do not possess fine grain test scores. One trial’s data clearly conforms to the expected pattern (marked as P48C1 on the chart below); many more do not.
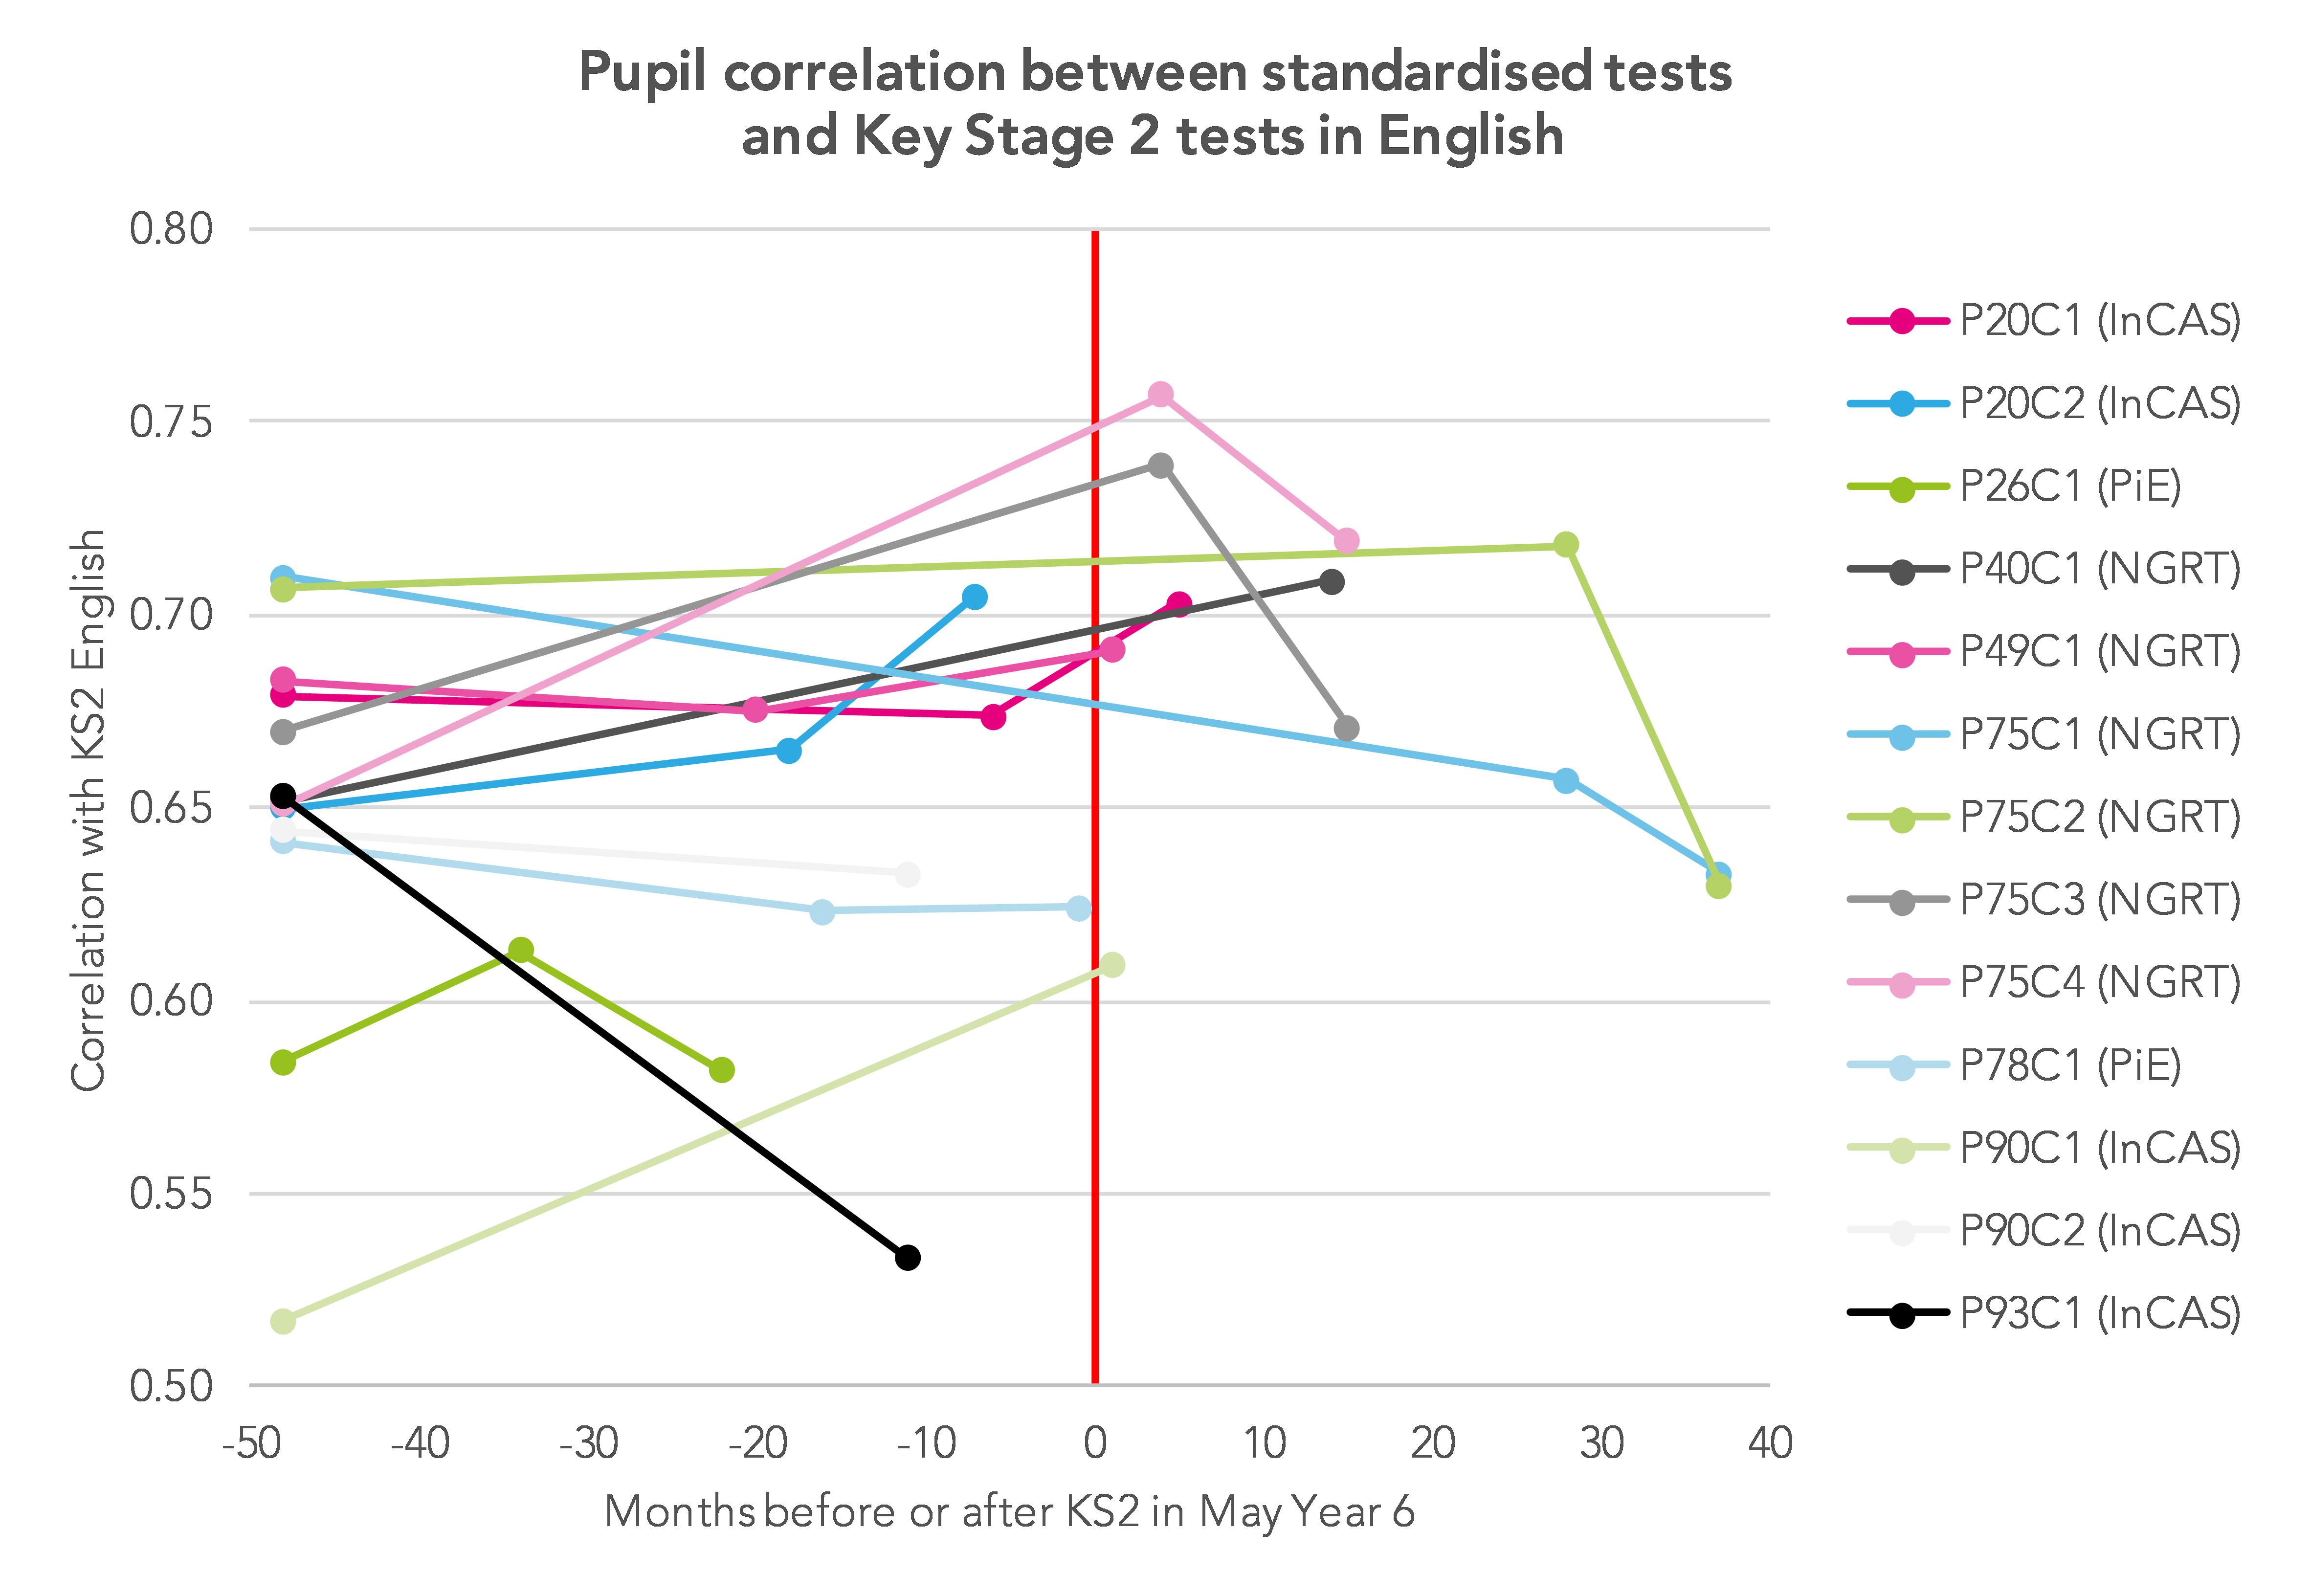
For reading and English tests, the correlations with the Key Stage 2 tests in English are generally lower overall, which is to be expected (see the chart below). More significantly, it is rarely the case in these trials that the test becomes a better predictor of KS2 English SATs the closer in time it gets to the Year 6 SATs.
For assessments where the predictive validity in relation to Key Stage 2 is quite low we might worry about the reliability of one or other of the tests or we should question whether the tests are measuring similar underlying constructs. Our report recommends that the EEF pays more attention to the conditions under which these tests are being sat by students. One issue is that these standardised assessments will often be administered in a setting that is relatively low stakes for the pupil. Existing psychometric literature (reviewed by Wise and DeMars, 2005) suggests that variation in persistence during the standardised test is a prime candidate for the poor correlation with Key Stage 2 data. Student persistence during a test can be inferred through proxy measures such as item non-response, careless answering and performance decline over a paper (see, for example, analysis of PISA data [PDF]). We know that student sensitivity to whether or not a test is high stakes varies across countries and other cultural settings (see, for example, experiments run in the US versus China [PDF]).
Our concern, both for EEF trials and for schools using these standardised tests, is that we need to be sure that standardised tests are sat in standardised conditions where students and teachers have standardised perceptions of the importance of the test. For example, inference is potentially compromised where only some teachers know that these tests are used in their own performance management; where some teachers are able to view the test papers in advance to influence revision guidance and others not; where some parents and pupils believe the test has important consequences for class allocations and other not.
These concerns about achieving greater consistency in how these tests are used in schools, whether through high quality guidance or other means, applies as much to multi-academy trusts devising their own tests as it does to schools who choose to buy commercial tests. If the data that has been collected through the EEF trials is representative of the wider experience of using these tests in schools, then it has two major implications for what we are reasonably able to infer from this data.
Firstly, using data from a single commercial assessment to decide whether a school is making good progress in a subject might be quite unreliable if test conditions are not standardised across schools. This means it is unlikely to act as a good predictor of the progress a school will make between two government assessments at Key Stage 1 and Key Stage 2.
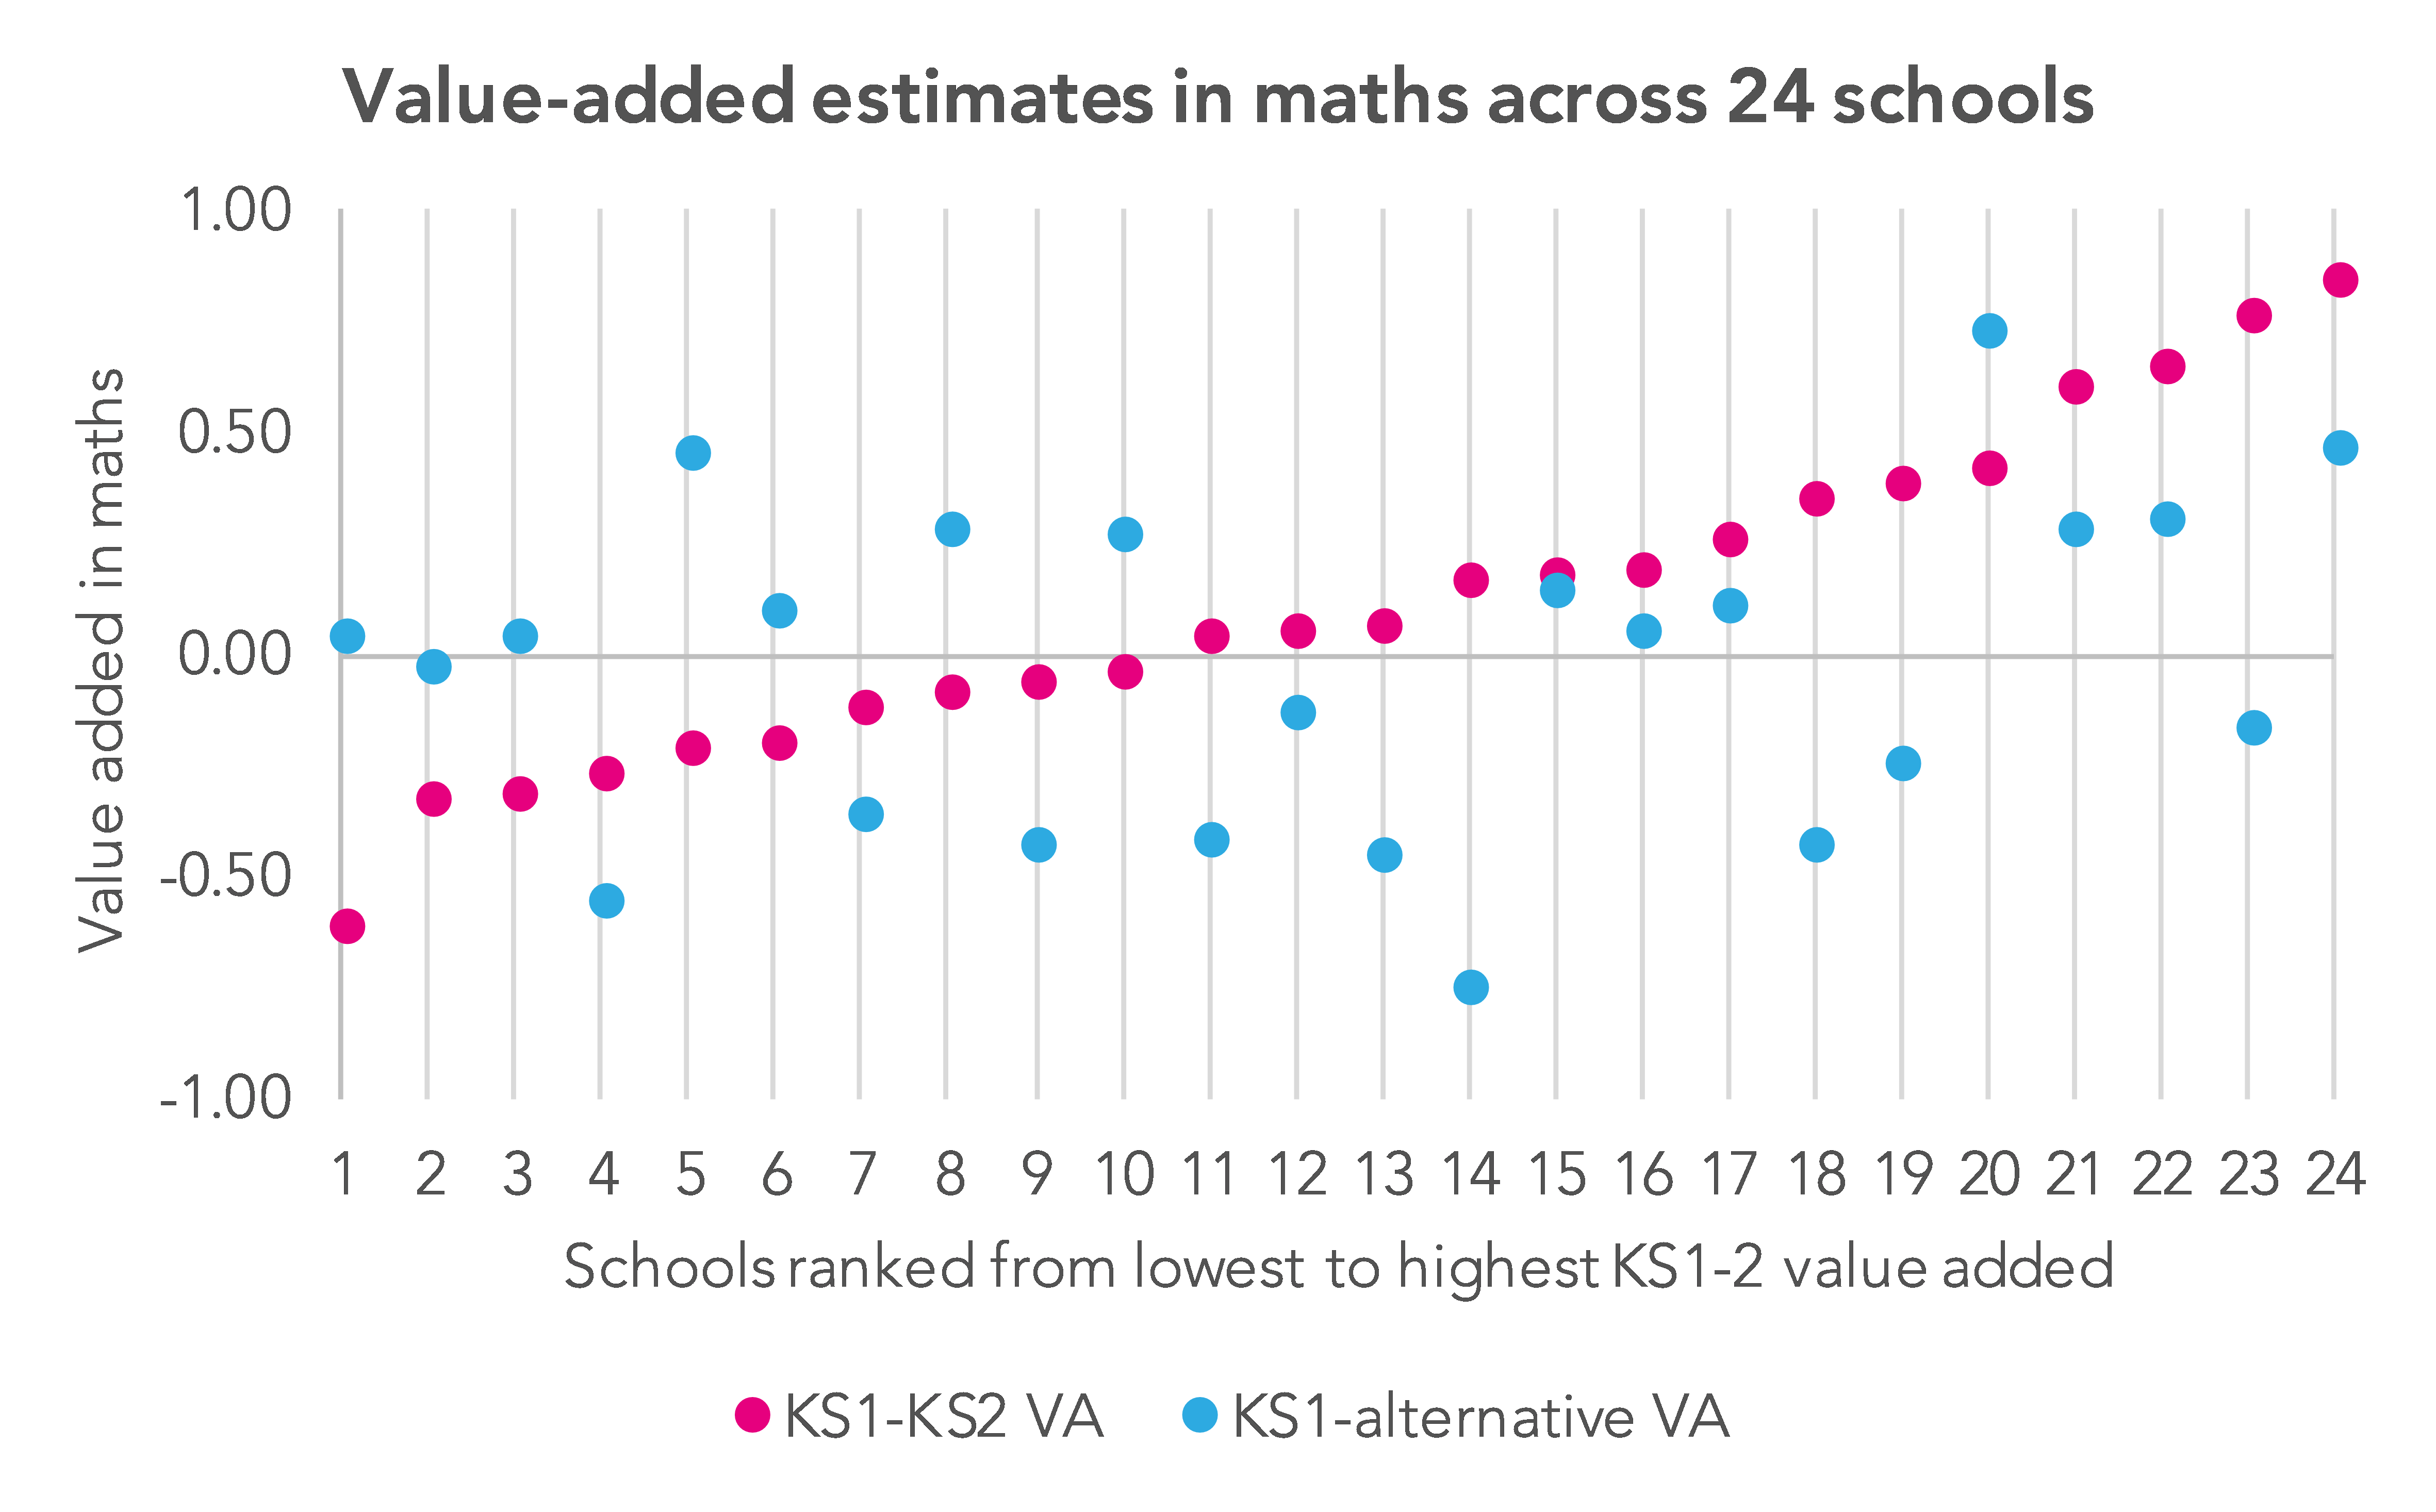
We illustrate this for one trial where 888 pupils in 24 schools took a commercially available maths test just one month before their Key Stage 2 tests. The chart below shows that the school value added score estimated using KS1 maths as a starting point and the standardised test as an outcome is very poorly correlated with the ‘official’ value added or progress measure they will achieve using the KS2 maths tests just one month later.
Secondly, short assessments that are designed to be completed within a lesson are rarely capable of telling us whether the progress an individual student has made in a year is noteworthy in any case. If we measure start-of-year and end-of-year attainment with a test which has an internal reliability of 0.9 (the level reported by most test companies in this situation) and if the correlation between test scores a year apart is over 0.8 (as many test companies report), then progress – i.e. the change in attainment – will be measured with a great deal of uncertainty.
A school will typically find that only a minority of their pupils record a test score growth statistically significantly different from zero. Furthermore, chance alone will be responsible for a large proportion of those who appear to have noteworthy growth or decline in scores. Dylan Wiliam (2010) summarises that the challenge of measuring annual test score growth occurs because “the progress of individual students is slow compared to the variability of achievement within the age cohort”.
Tests, including standardised tests that are short enough to be sat in a lesson, are an excellent way for teachers to monitor what students can do. However, headteachers and others who are keen to measure whether pupils have learnt enough in a subject within a space of year should take care to understand that relatively short, low stakes tests necessarily provide limited inference.
Want to stay up-to-date with the latest research from FFT Education Datalab? Sign up to our mailing list to get notifications about new blogposts, or to receive our half-termly newsletter.


The importance of variability in scores for individuals seems to me a really important aspect that all educators need to understand. Most of your data sets involve tens or even hundreds of thousands of students so the statistics have validity. Are you able to tell me what the likely distribution of results would be for, say, a student who is predicted 8 grade 5s at GCSE? What proportion of students, predicted 8 grade 5s would you expect to actually get 8 grade 5s? My guess is that, statistically, you would expect at least one grade 1/2 in there amongst the eight (and probably an 8/9). If not, then is there any evidence that, for individual students, not cohorts, predictions become self fulfilling prophesies?