Today the government has published its latest statistical first release (SFR) on attainment at Key Stage 2 in England.
This tells us about overall trends in national and local authority performance. Further information on the attainment of different groups of pupils (such as those eligible for the pupil premium) will be published later in the year.
National results have improved
Percentages of pupils achieving the expected standard (and higher standard) have improved each year in reading, writing and mathematics since the new tests/standards were introduced in 2016.
(Strictly speaking, the writing standards are different this year. Whether this has made any difference to which pupils have been deemed to be working at the expected standard is a story for another day).

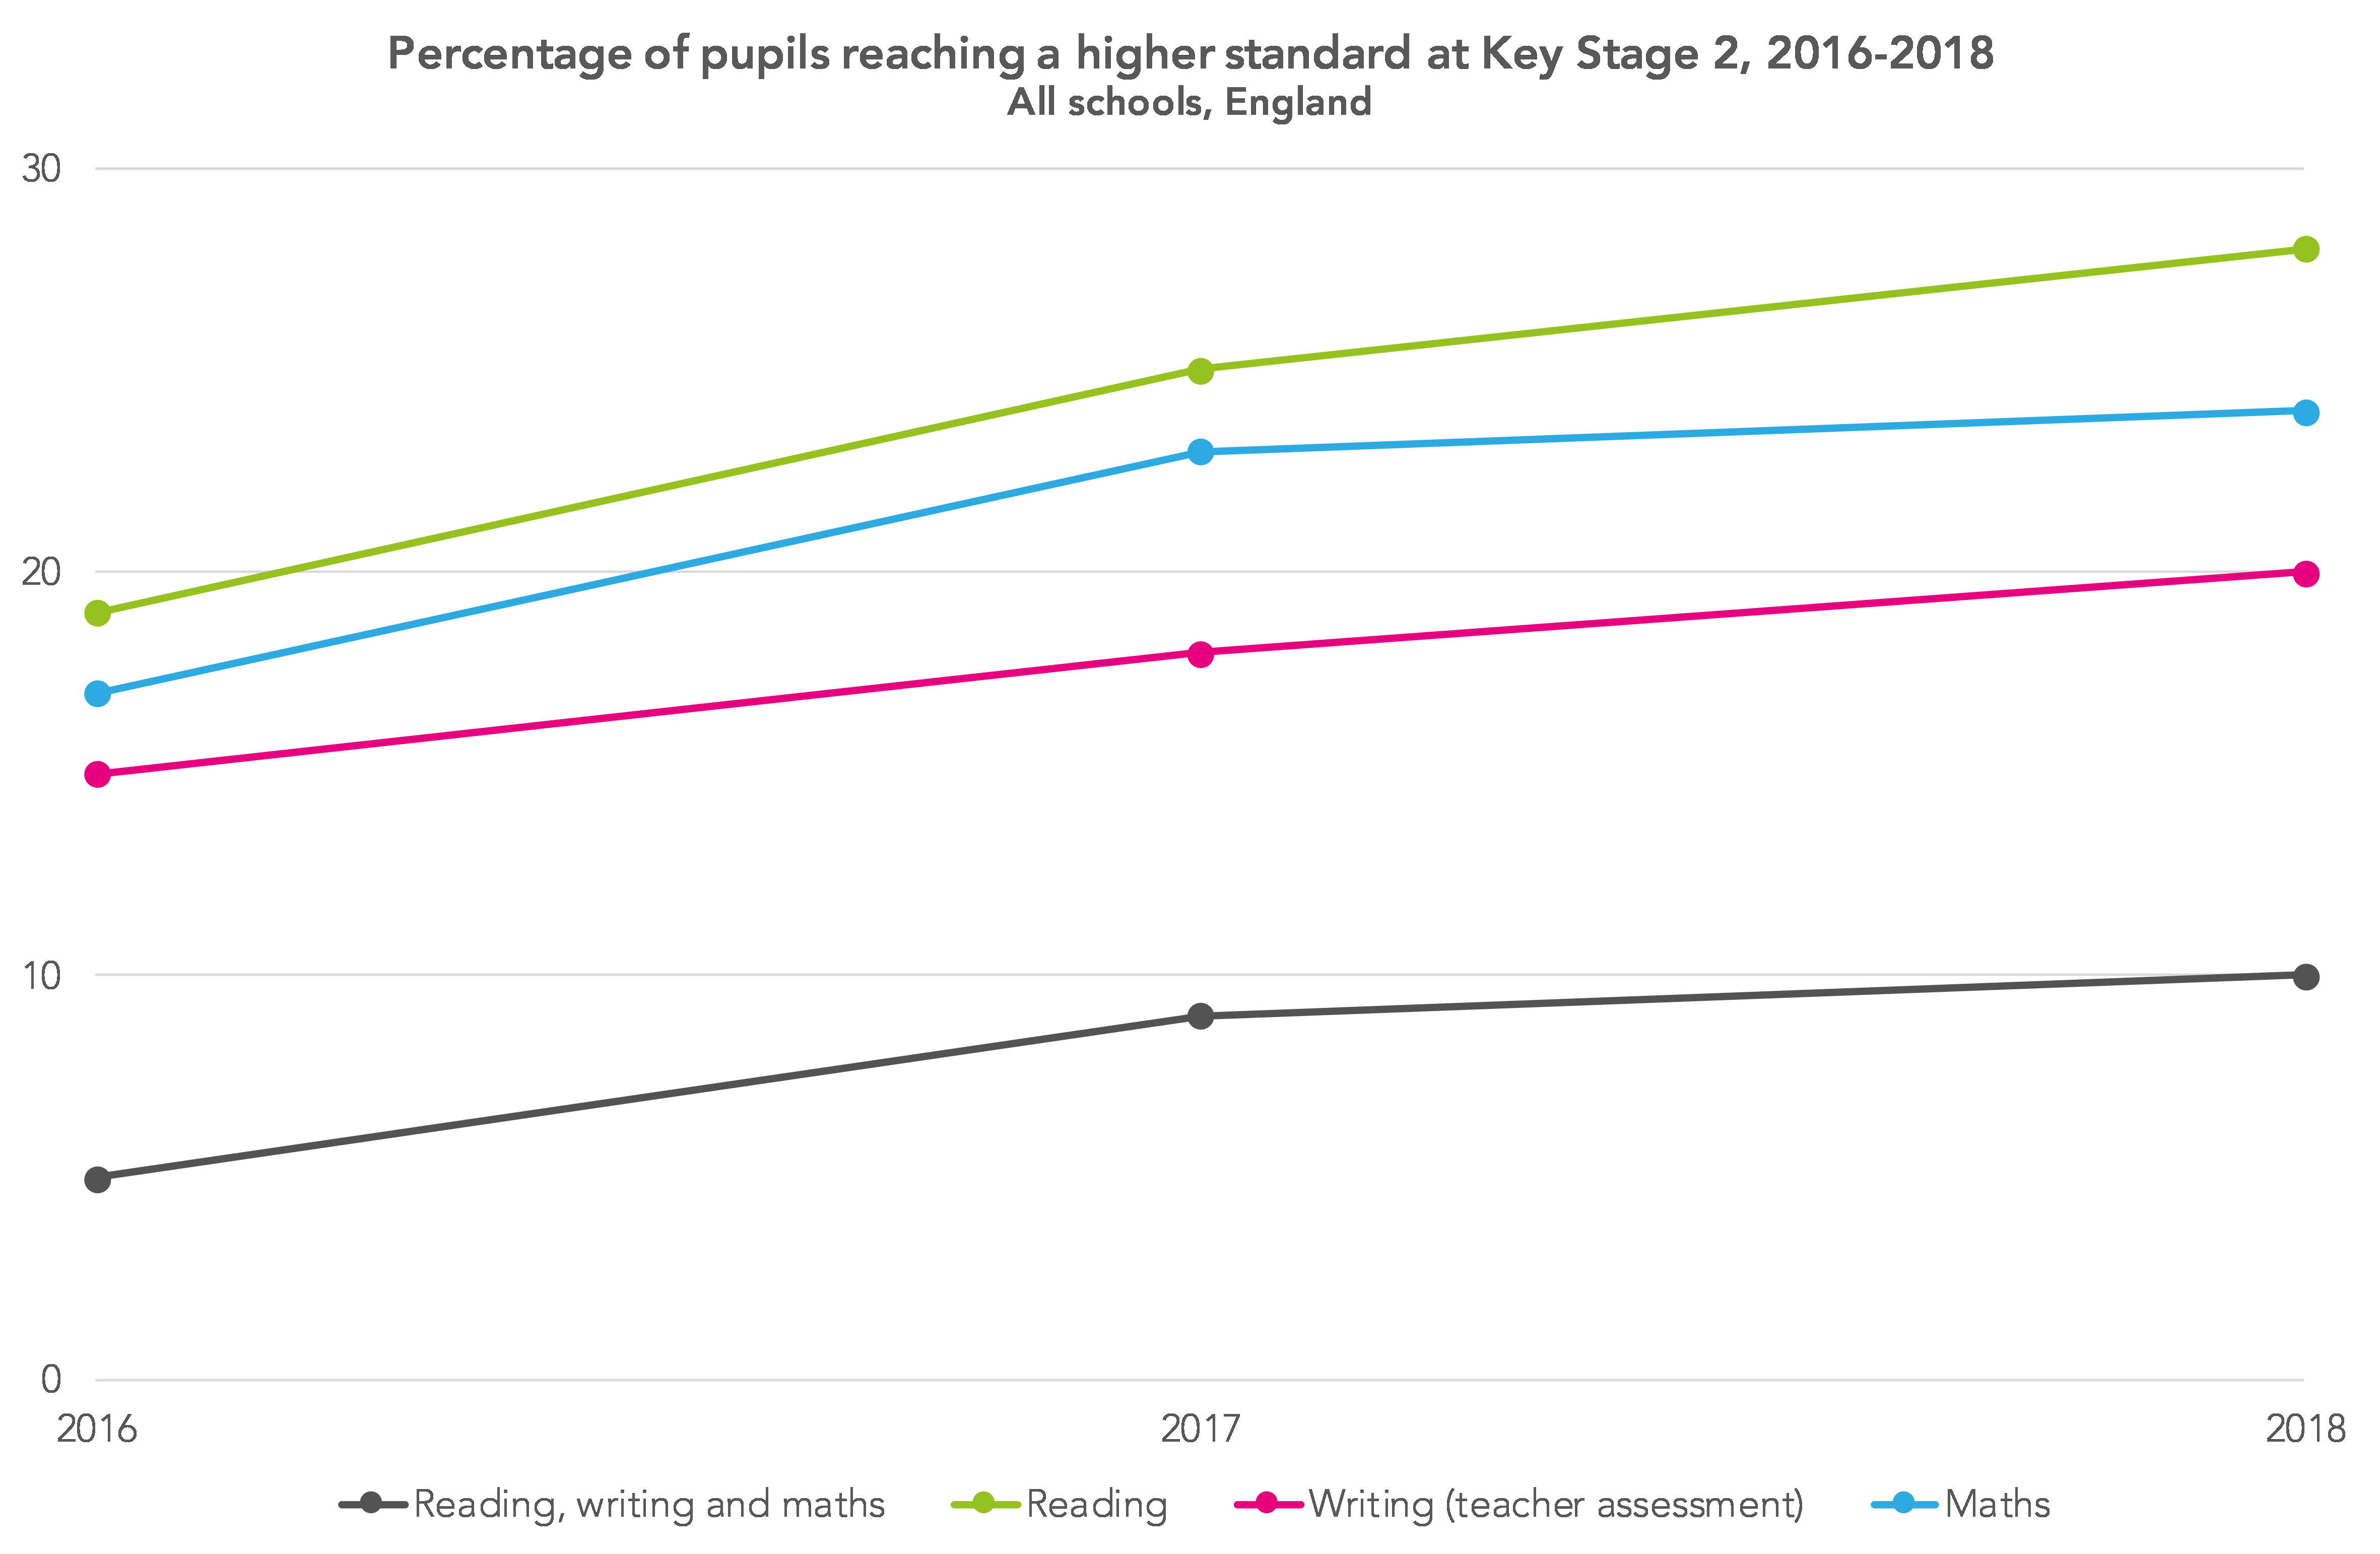
This improvement is exactly what we would expect to happen when a new set of tests (or assessments) is introduced. Fairly rapid improvement in the first few years followed by a plateauing as teachers become more familiar with the new curriculum.
In addition, this cohort of Year 6 pupils is the first to have completed the full KS2 curriculum from Year 3 onwards.
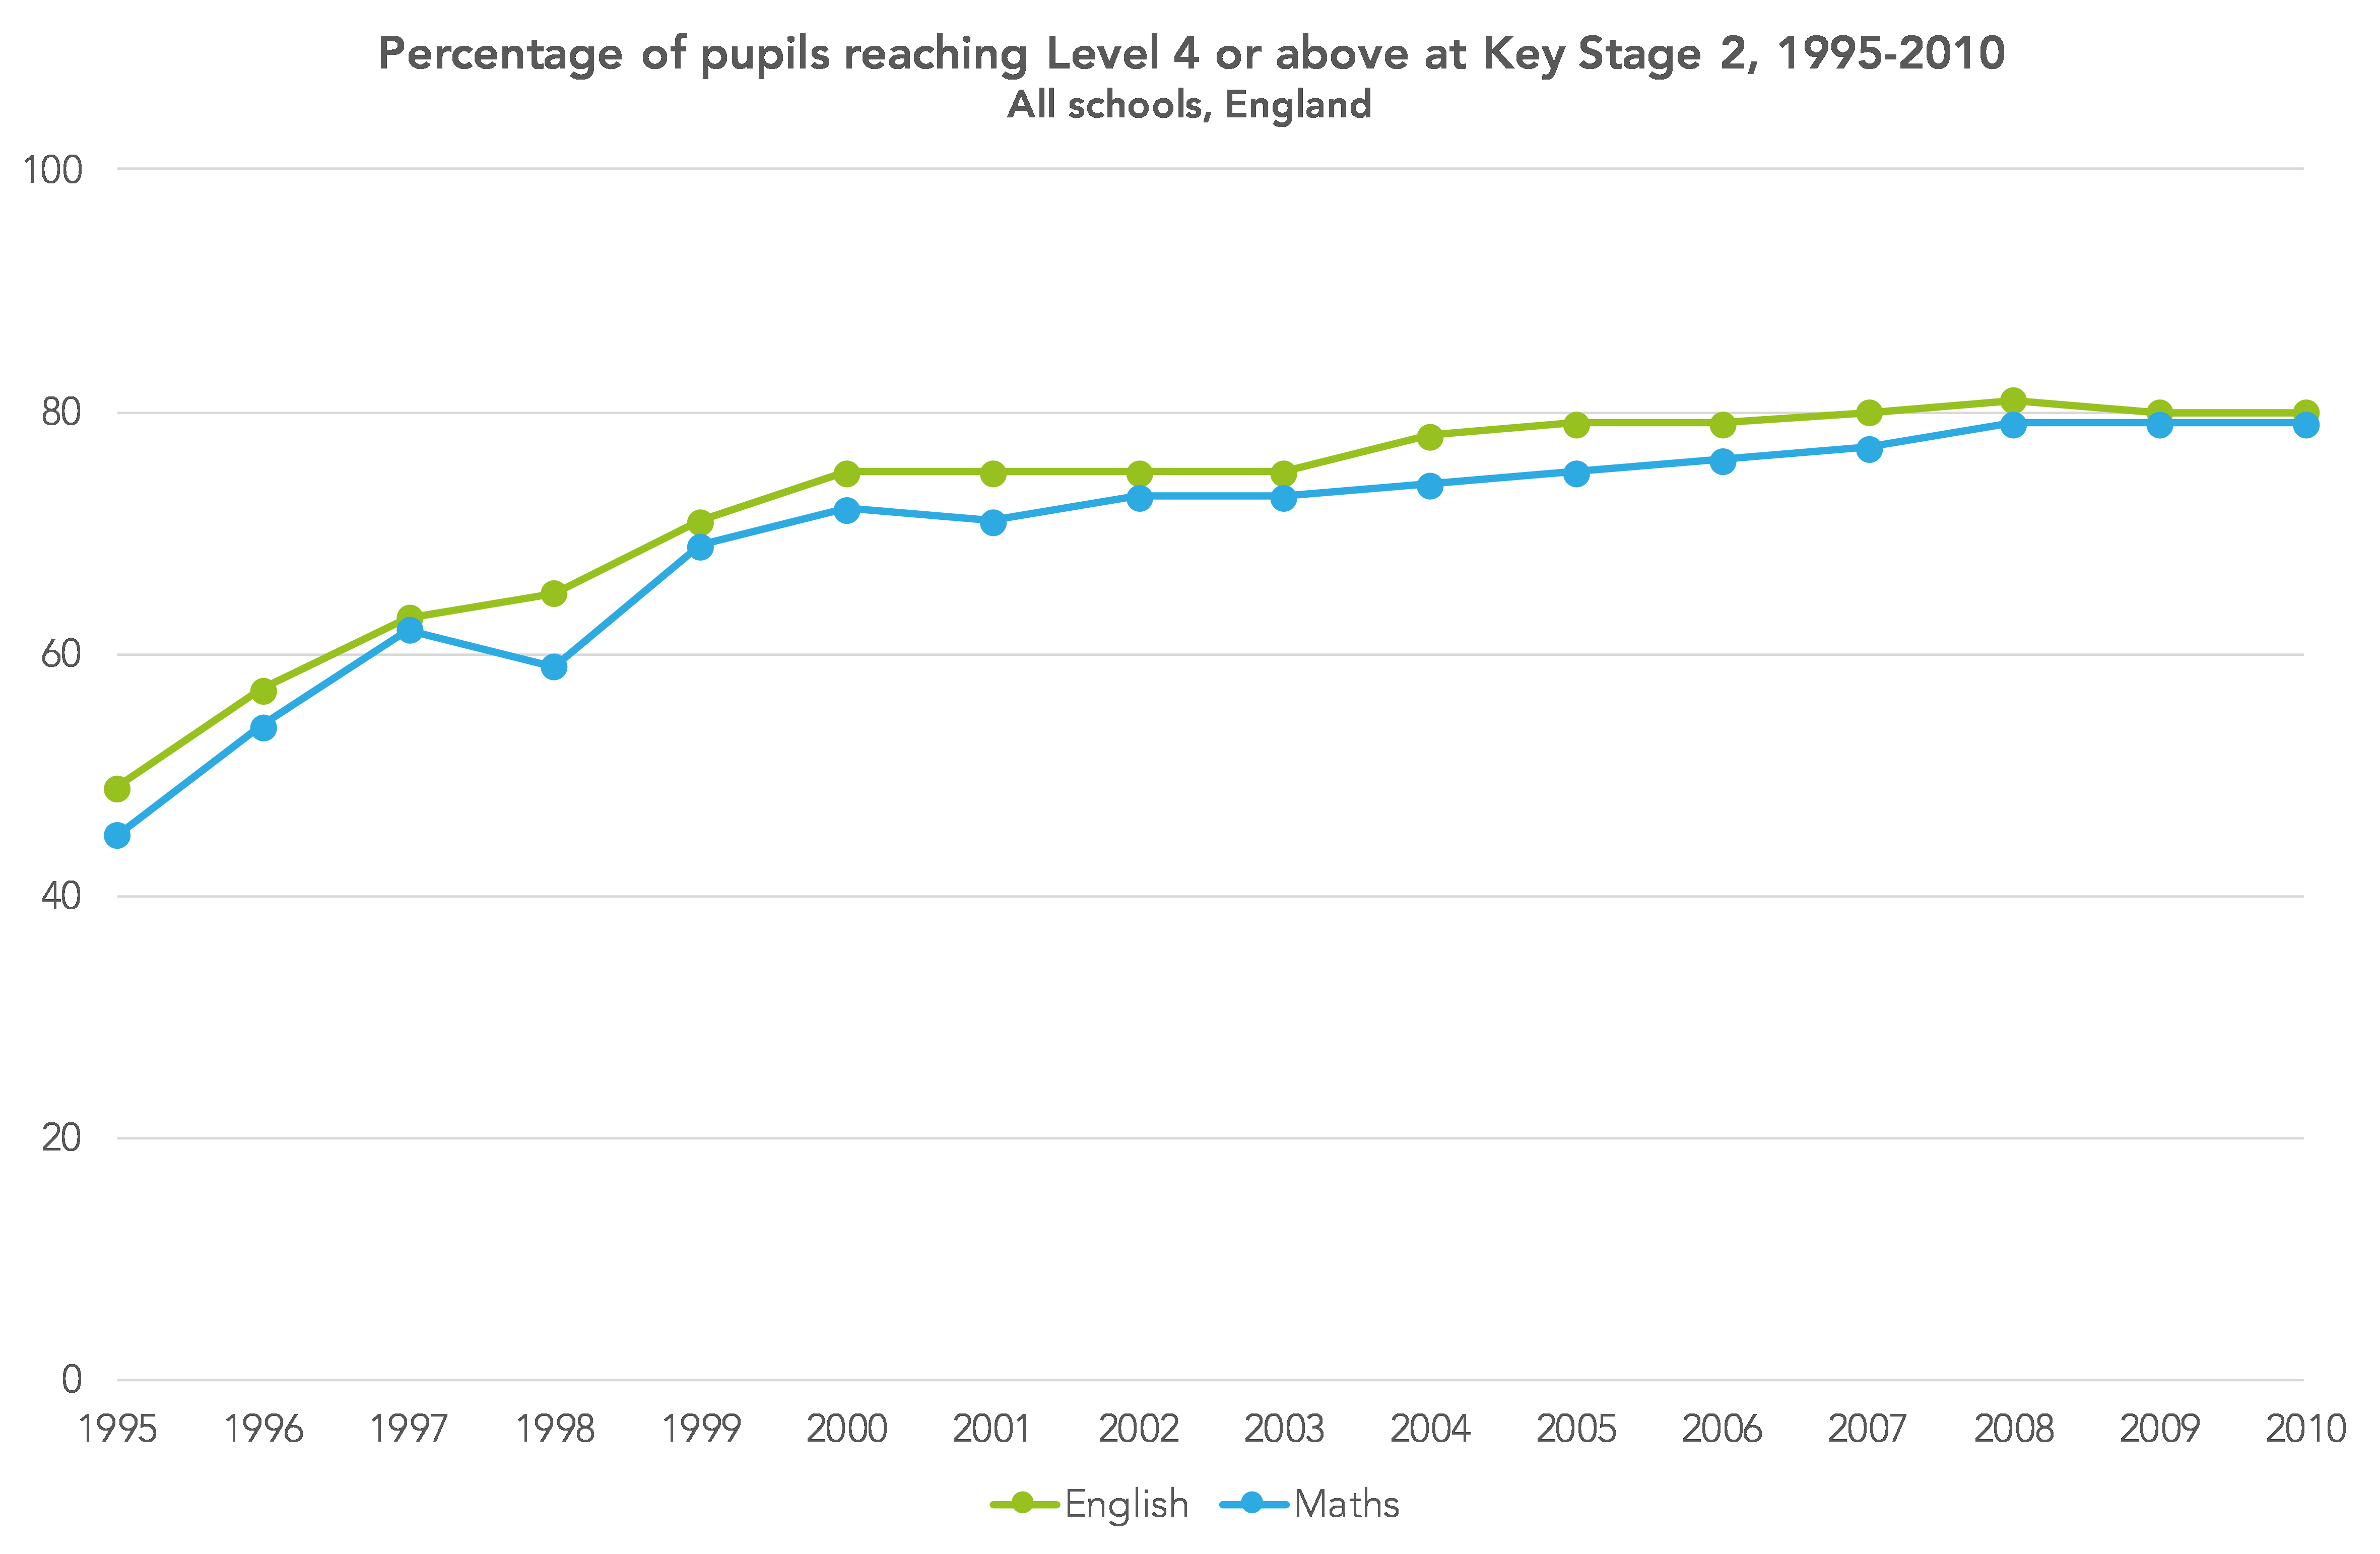
The same thing happened when KS2 tests were first introduced in the late 1990s, although the curriculum had been around for some time (subject to a number of reviews) and the tests had been piloted for a number of years.
The correlation between reading and writing results has increased again
In both of the last two years, we’ve looked at the relationship between reading and writing results at a local authority-level, expressing concern in 2016 about the moderation of writing.
Overall this year, local authorities had an average of 75% of pupils reaching the expected standard in the reading test (up from 73% last year), and 79% of pupils reaching the expected standard in writing teacher assessment (up from 77% last year).[1]
As the two charts below show, at an LA-level, reading and writing results are more closely bunched together this year than they were in 2017. The correlation between the two increased from 0.69 in 2017 to 0.80 in 2018.
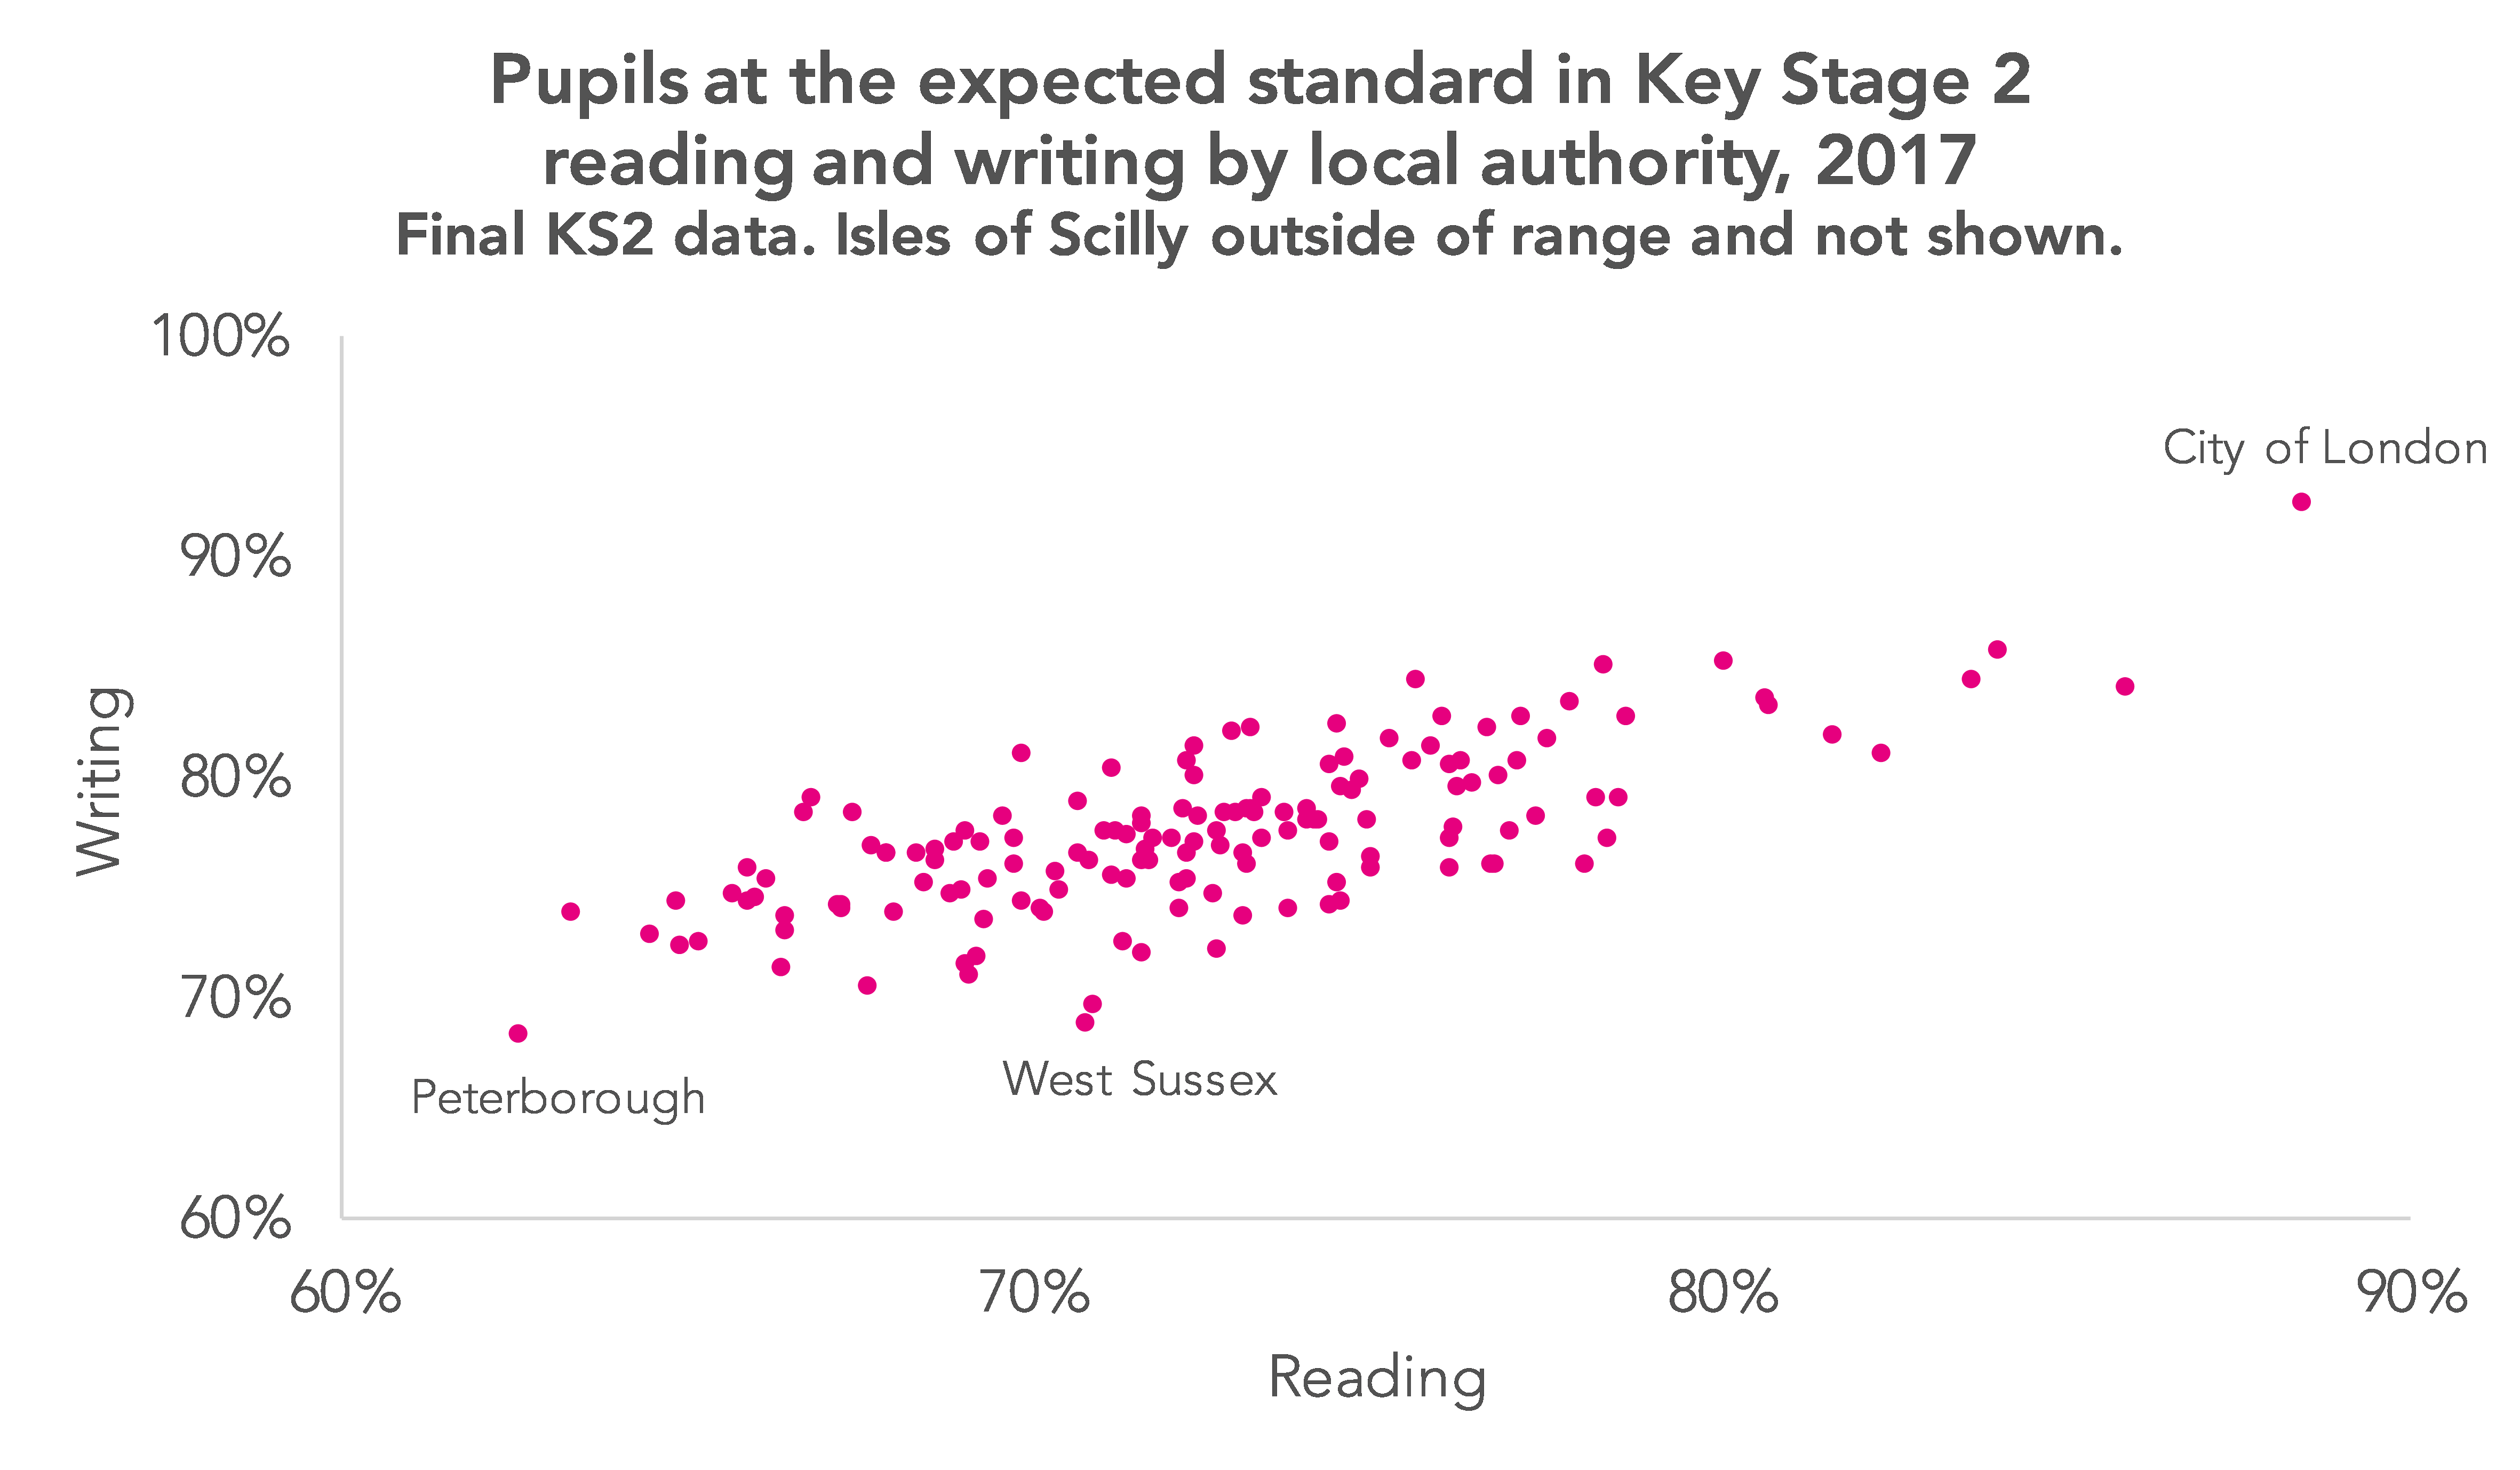
 Another simple way of seeing this is to look at the range of LA-level values in both reading and writing. In reading, there were 22 percentage points between the LA with the highest percentage of pupils reaching the expected standard in reading (87% versus 65%), when last year this figure was 26 percentage points (88% versus 63%).
Similarly, in reading, this year there was an 18 percentage point difference between the LA with the highest percentage of pupils reaching the expected standard in writing (87% versus 69%) – markedly down on the difference of 24 percentage points last year (92% versus 68%), excluding 2017 results for the Isles of Scilly, which were an extreme outlier.
This suggests that the trend that began last year – a reduction in the considerable variation in reading and writing results that was present in the first year of the new KS2 tests and teacher assessment standards – is continuing.
The number of junior schools continues to decline
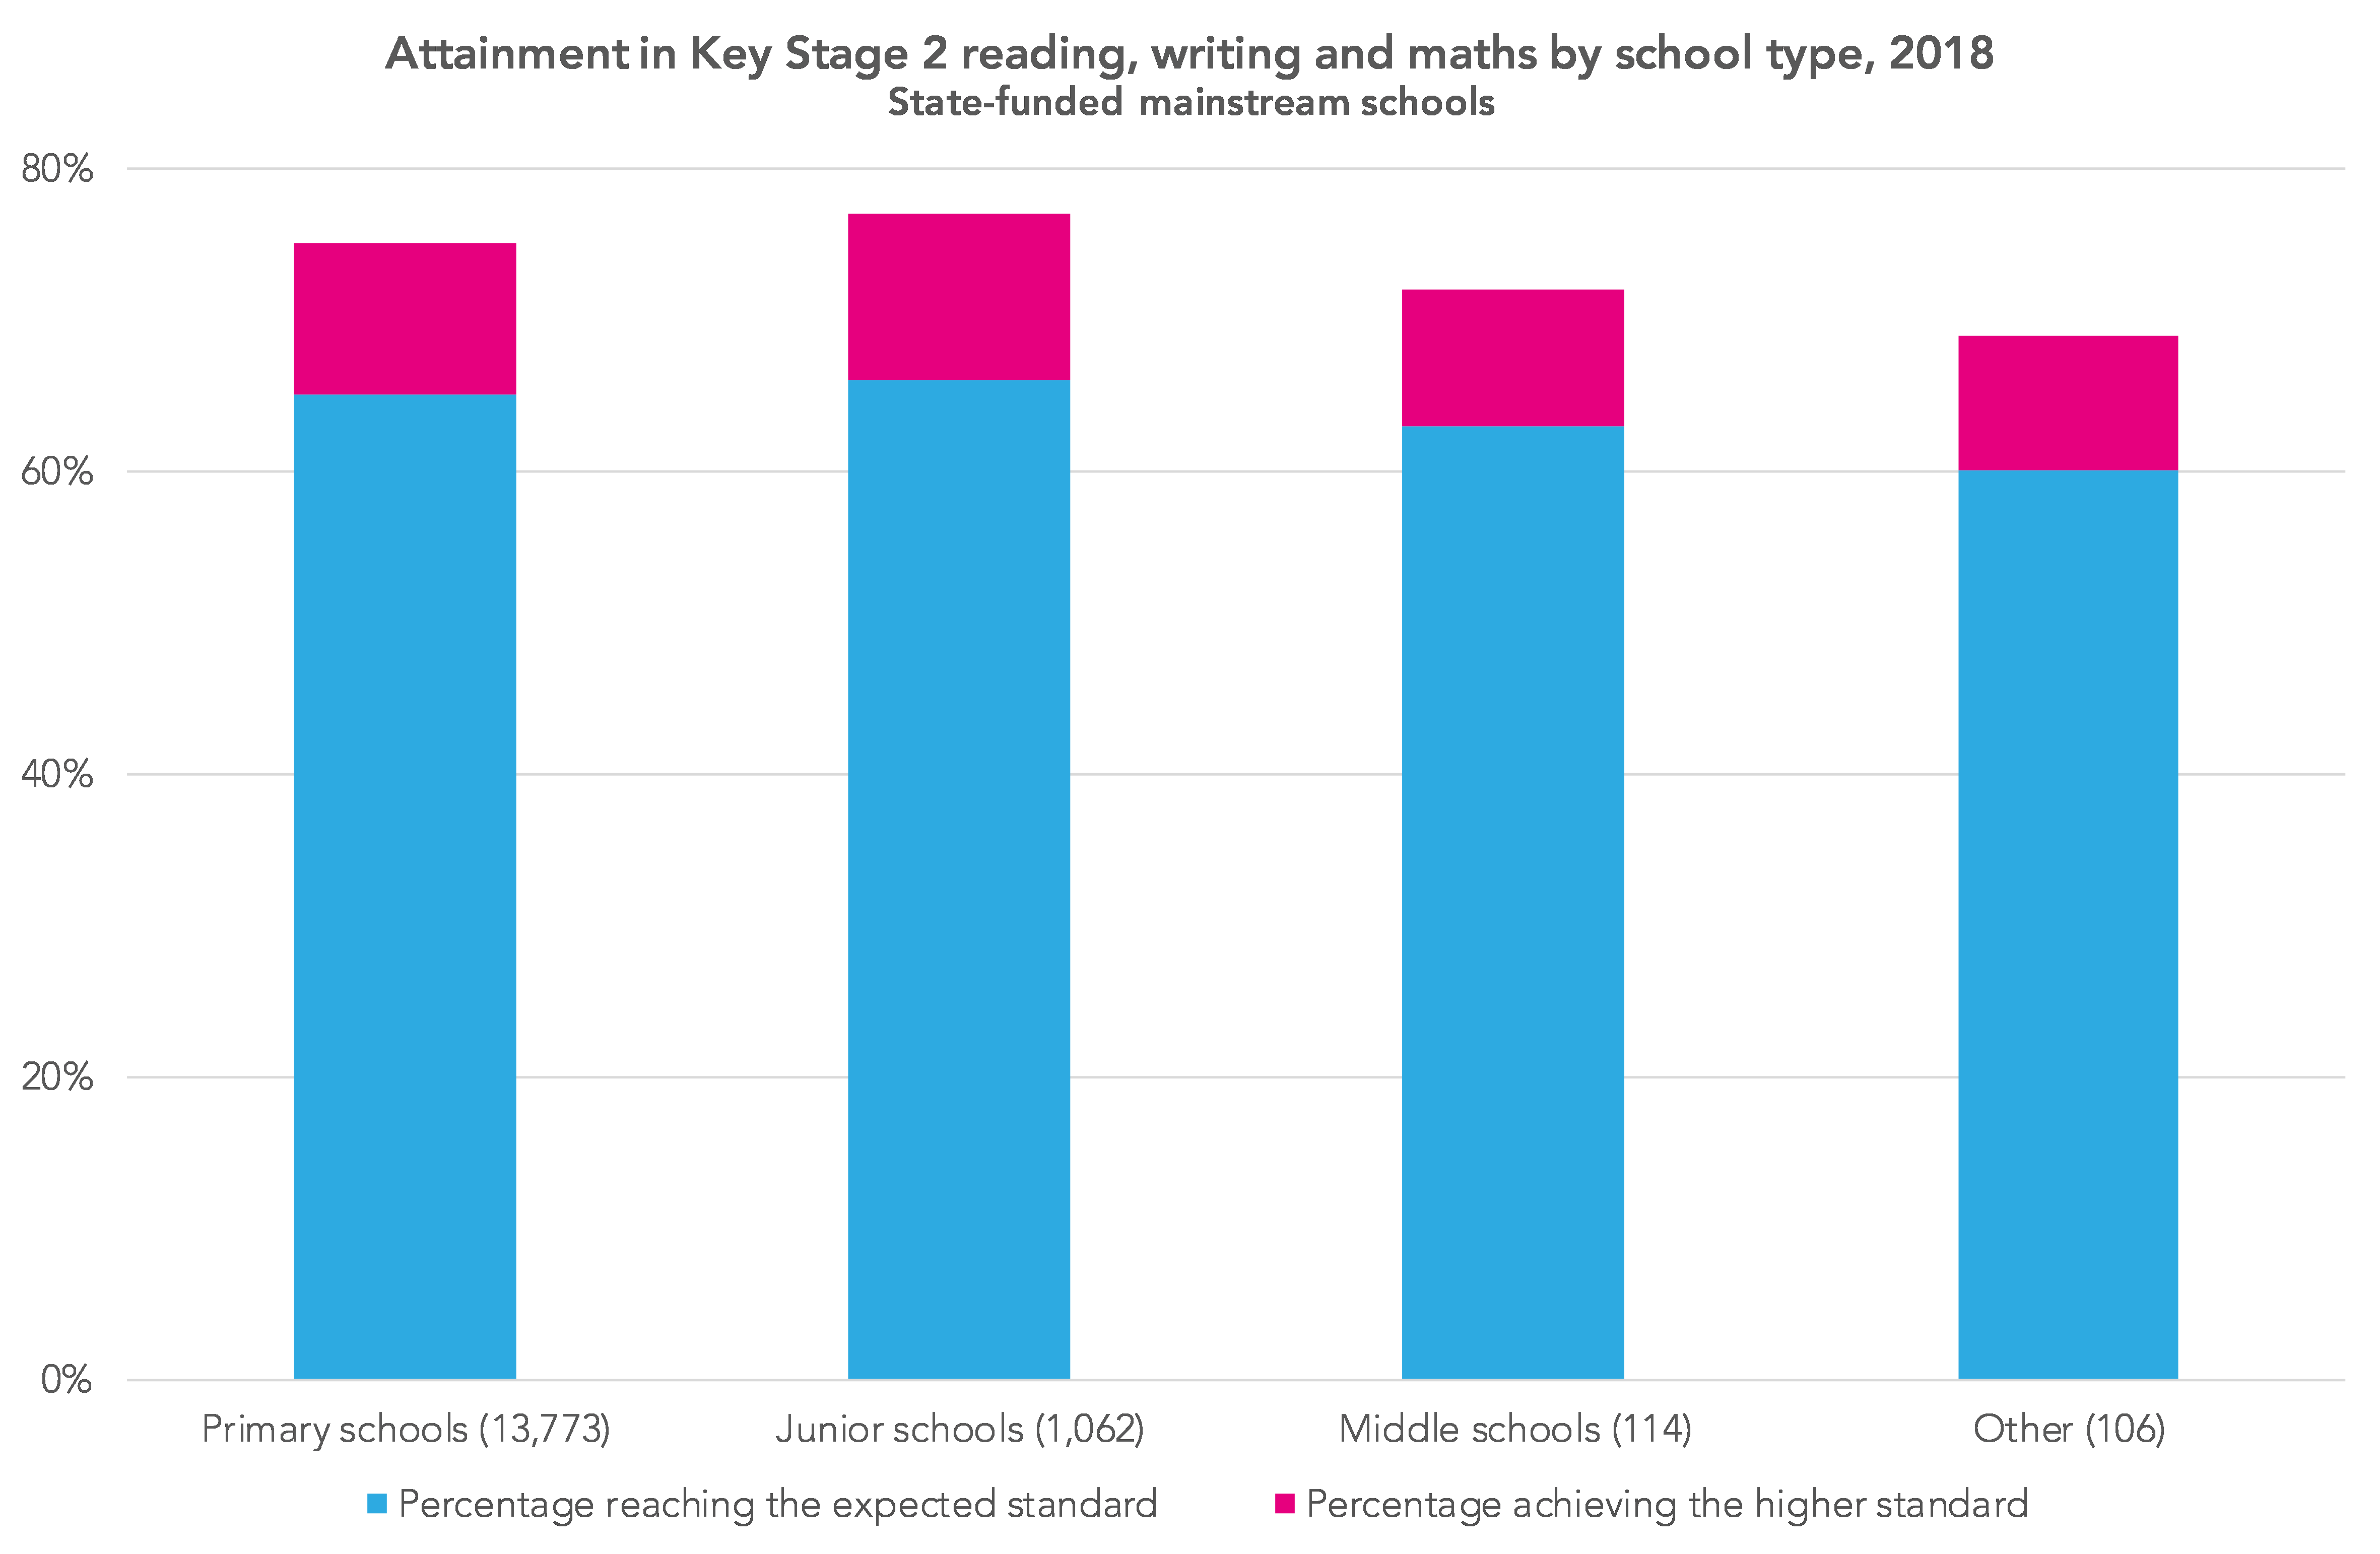
The SFR once again includes national averages for attainment in junior schools and, for the first time, in middle schools too.
As the chart below shows, attainment in junior schools was slightly higher than that in primary schools, and attainment in middle schools was slightly lower. (The ‘other’ category largely consists of all-through schools.)
For junior (and middle) schools, however, their problem has always been progress (value added) measures, which tend to look much worse than for primary schools, as we showed here. It is good to see that this issue will be recognised in both school performance tables and the Ofsted inspection data summary report (IDSR) next year.
But what the SFR does not show is the dwindling number of junior schools. There were 1,062 junior schools with Key Stage 2 results in 2018, 16 fewer than in 2017. If we look back over a longer period, their number has declined from 1,677 in 2005 as a result of mergers and amalgamations.
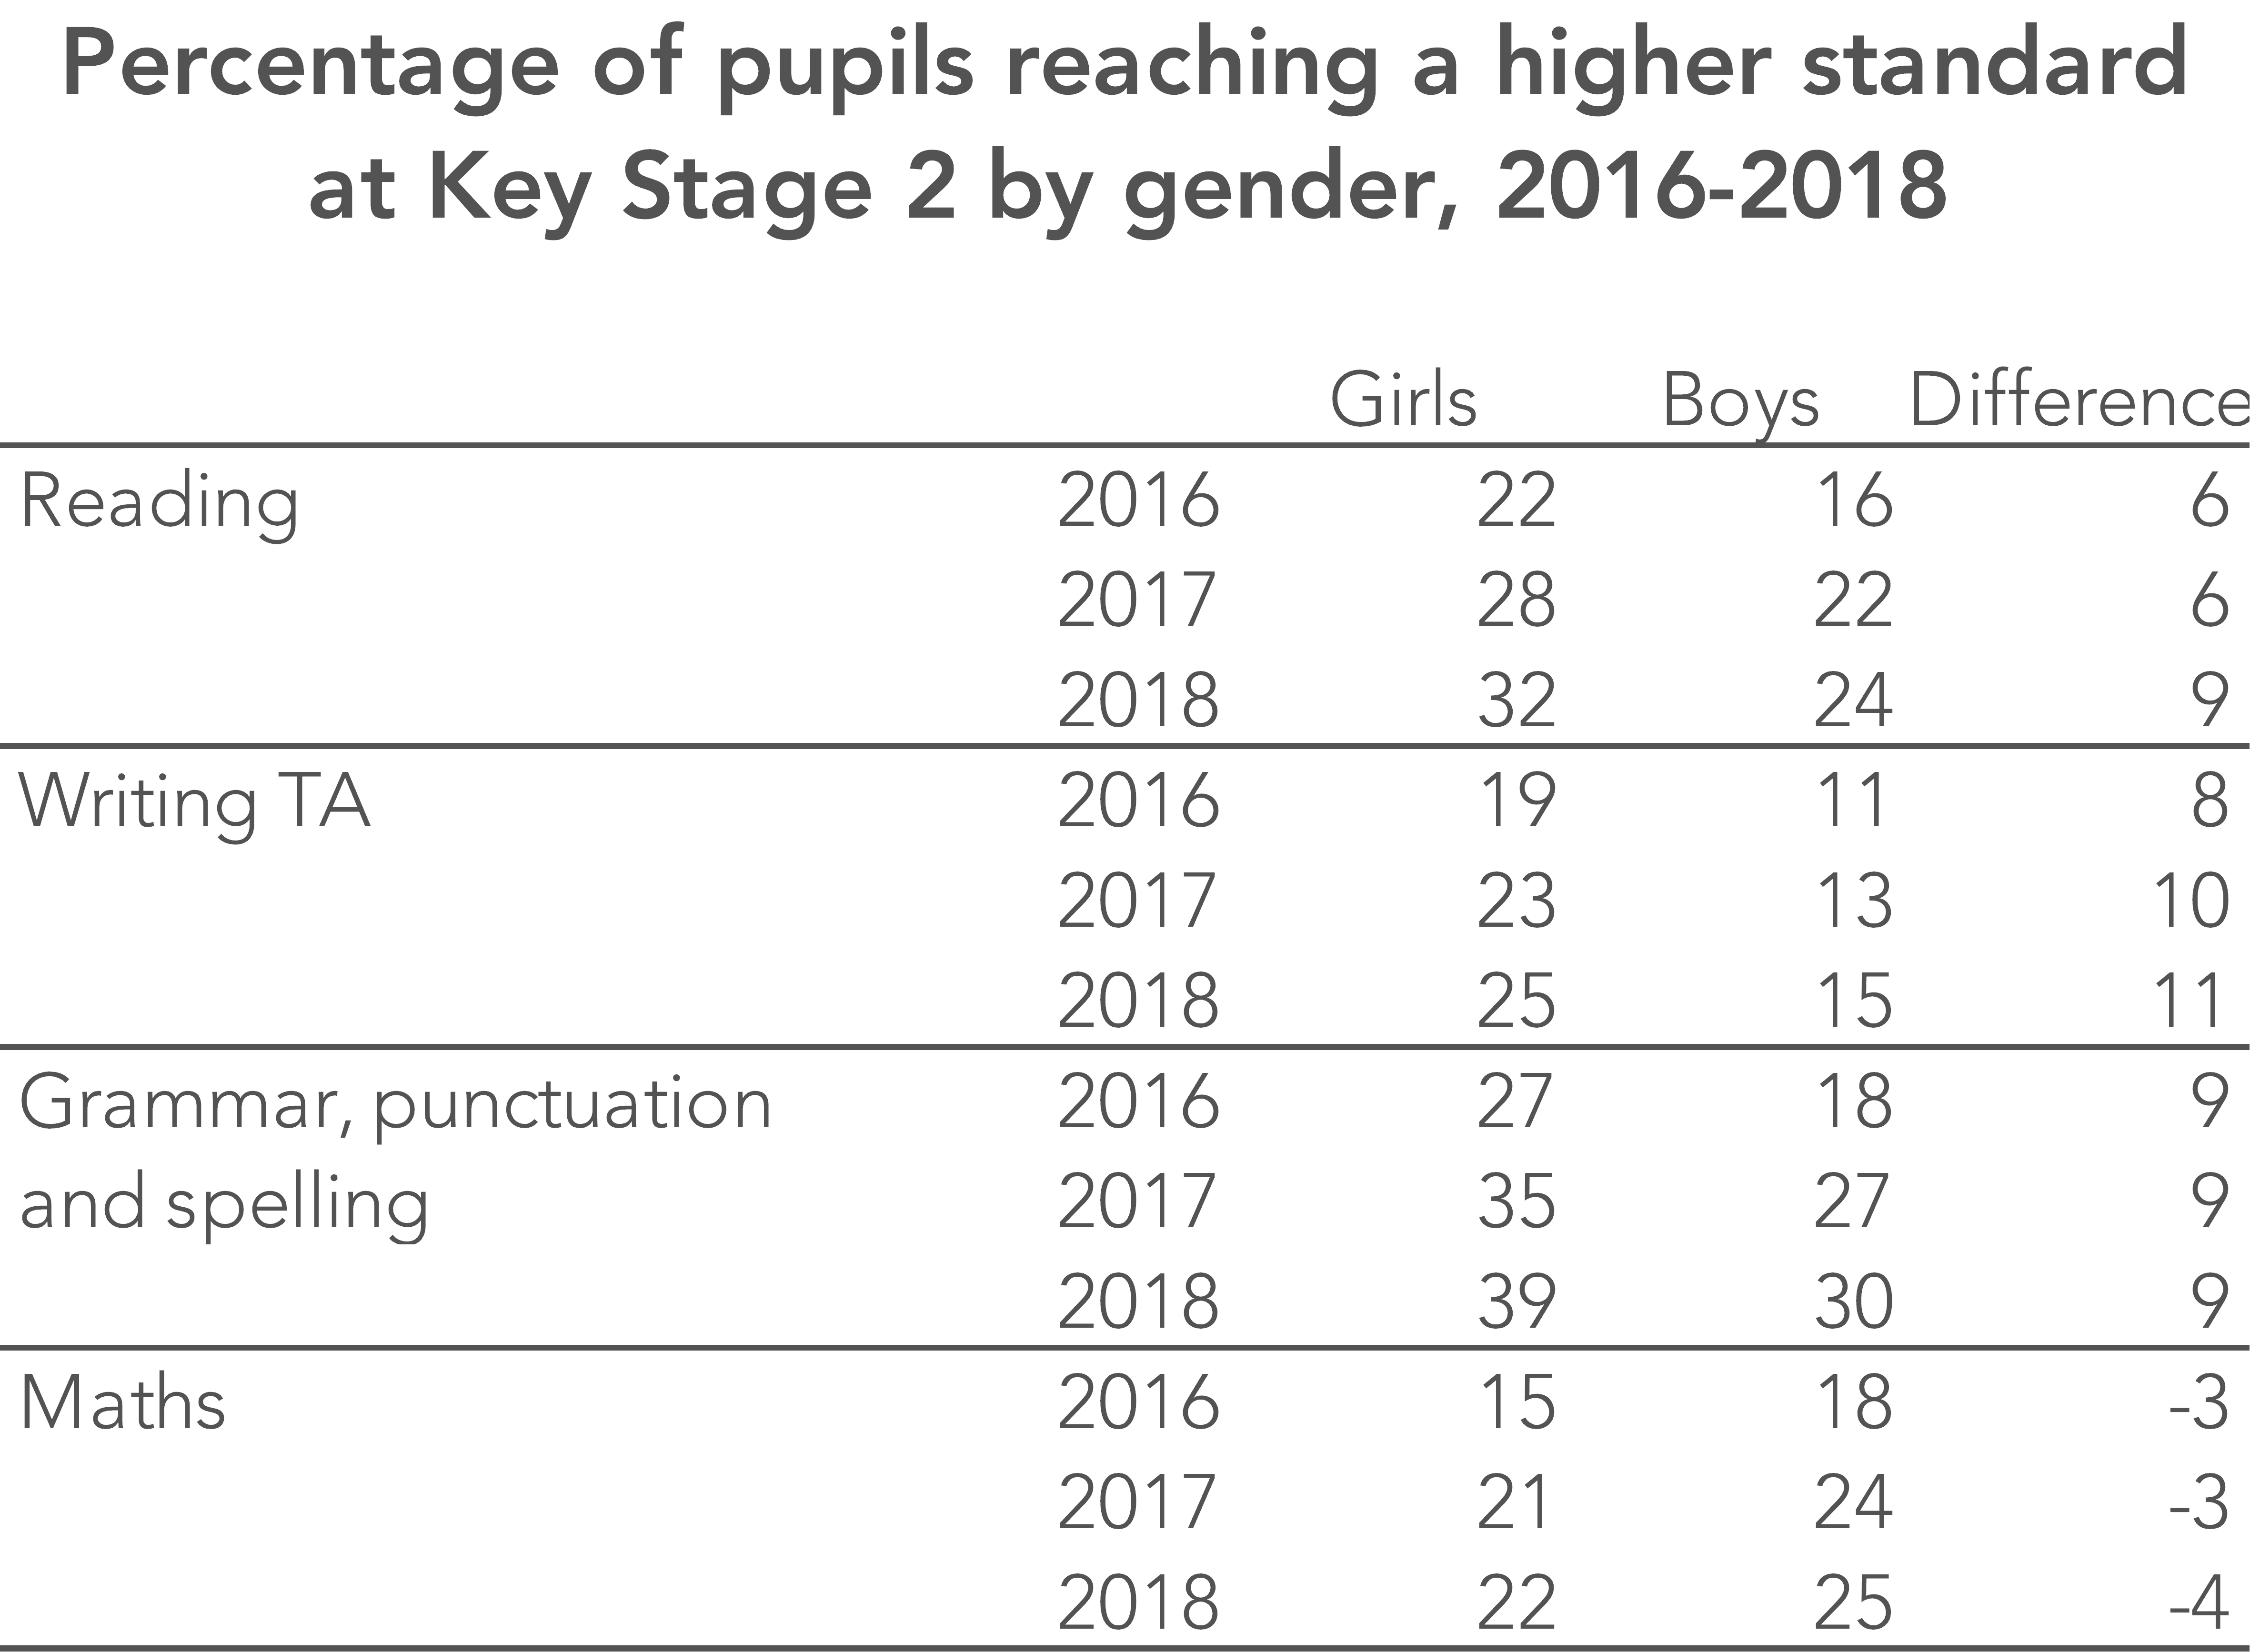
Gender gaps have widened in reading
The gaps in attainment between boys and girls in reading, writing teacher assessment (TA), and grammar, punctuation and spelling persist, and have widened at the higher standard in reading. Note that in the table below, the difference column may not tally with the figures for boys and girls due to rounding.
Want to stay up-to-date with the latest research from FFT Education Datalab? Sign up to our mailing list to get notifications about new blogposts, or to receive our half-termly newsletter.
1. The City of London and Isles of Scilly are not included in the 2018 provisional data as they only have one school each. Results for Bedford are also not included “because there are known changes to the data after the cut-off date for publication”, according to the data release.


Thank you for recognising the challenges that Junior schools face in regards to progress.