1. The percentage of pupils achieving the higher standard has increased
We already knew that the percentage of pupils achieving the expected standard in reading, writing and maths increased from 53% last year to 61% this year.
And today’s release of provisional Key Stage 2 data shows that the percentage reaching the higher standard increased from 5% to 9%.
Whenever assessments are introduced or reformed, we typically see rapid improvement in the first few years before they begin to stabilise.
The same thing happened when Key Stage 2 tests were first introduced in the mid-1990s, and when the new Early Years Foundation Stage Profile was introduced in 2013.
2. There is much greater consistency between local authorities’ reading and writing results
Last year we reported on the surprisingly low correlation (0.35) between the percentage of pupils achieving the expected standard in reading and in writing at local authority level.
This has improved this year to 0.7 when the outlier on the chart (Salford) is excluded.
3. Local authority data is broadly the same as last year
Overall the 2017 and 2016 local authority data is fairly similar. Places with a significant improvement in the proportion achieving expected level in reading, writing and maths are:
- Swindon
- Rutland
- Blackpool
- Dorset
- Cheshire East
- Hammersmith and Fulham
- Middlesbrough
- Shropshire
- Hartlepool
- Calderdale
Those places with the smallest improvements (excluding Salford where provisional data is incomplete) are:
- North Somerset,
- Reading,
- Hillingdon,
- Walsall,
- Barking and Dagenham,
- Trafford,
- Rochdale,
- Bolton,
- Brent,
- Darlington
What is more interesting is that the relationship between local authority performance in individual subjects continues to be so weak.
The chart shows that the London local authorities are very strong in maths, compared to reading. By contrast, places such as the Isle of Wight, Bracknell Forest, Herefordshire, West Berkshire, Brighton and Hove, Windsor and Maidenhead could all improve their overall performance by focussing on maths.
Similarly, London is very strong in grammar, punctuation and spelling (GPS), compared to reading.
4. Overall, the north-east continues to catch London
The north-east remains the second highest attaining region (64%), and caught up with London (66%) a touch. The east Midlands, the west Midlands and Yorkshire and the Humber were the regions with the lowest levels of attainment, with 58% of pupils achieving the expected standard in each.
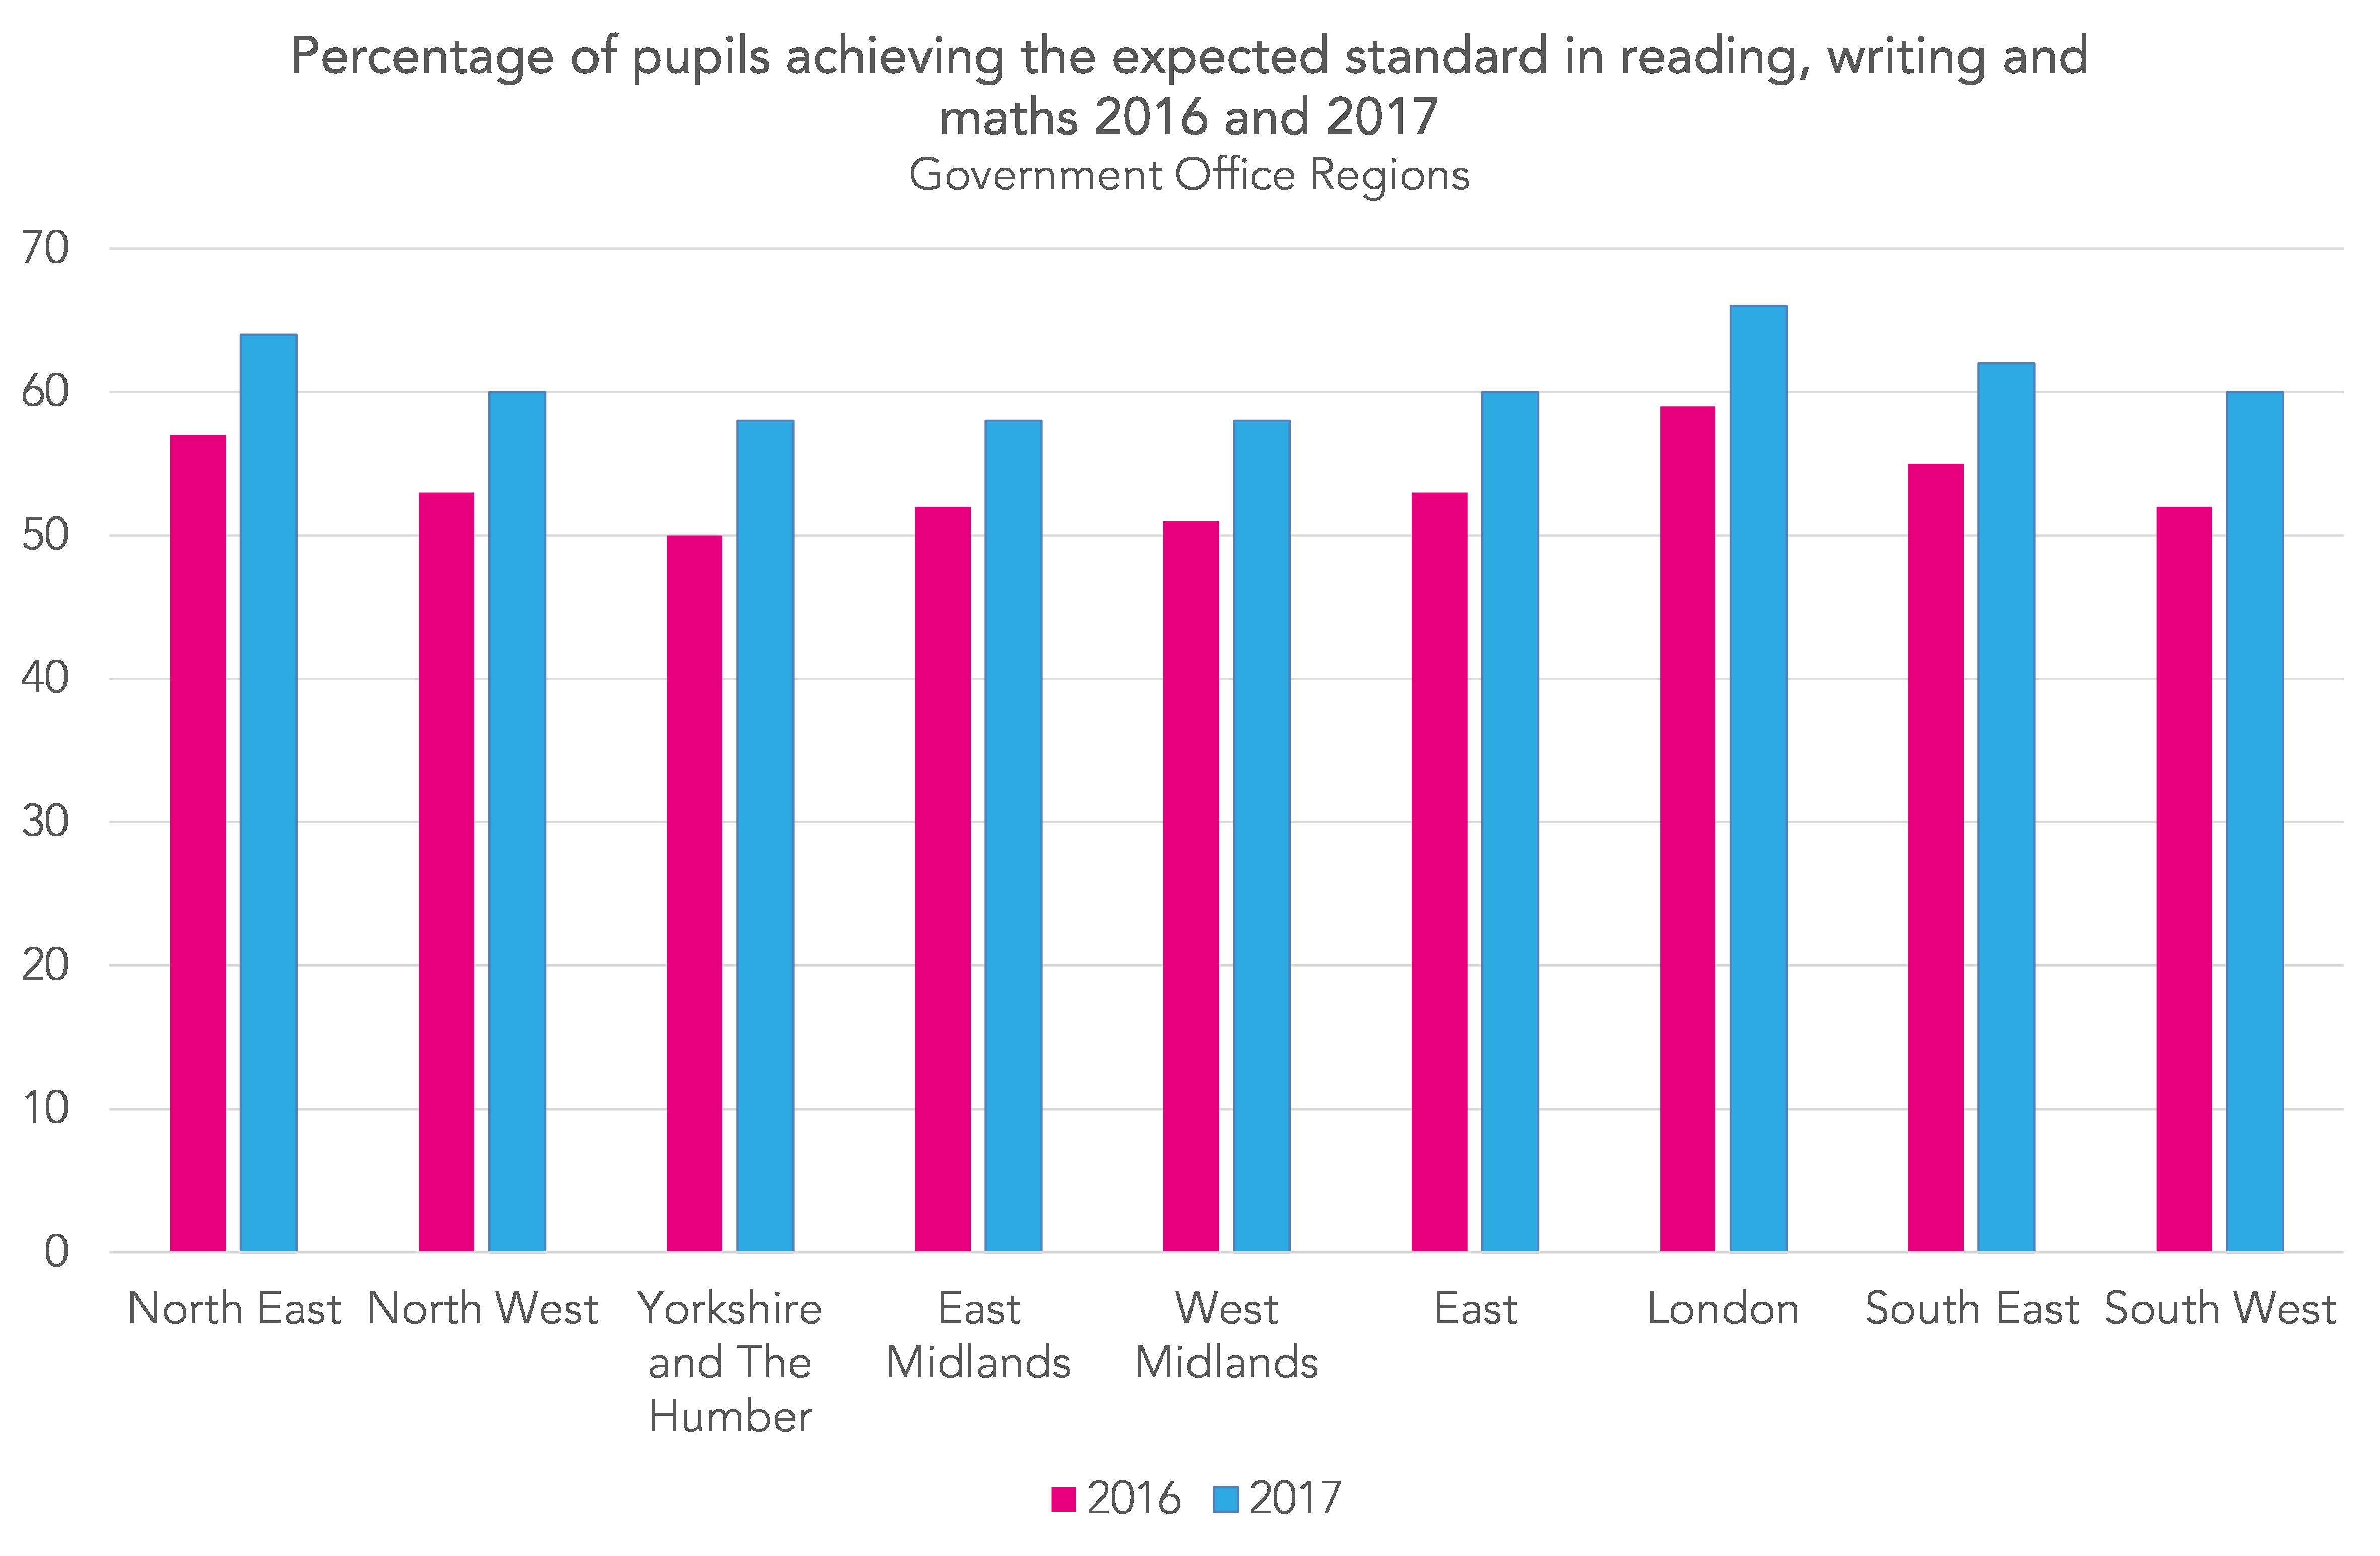
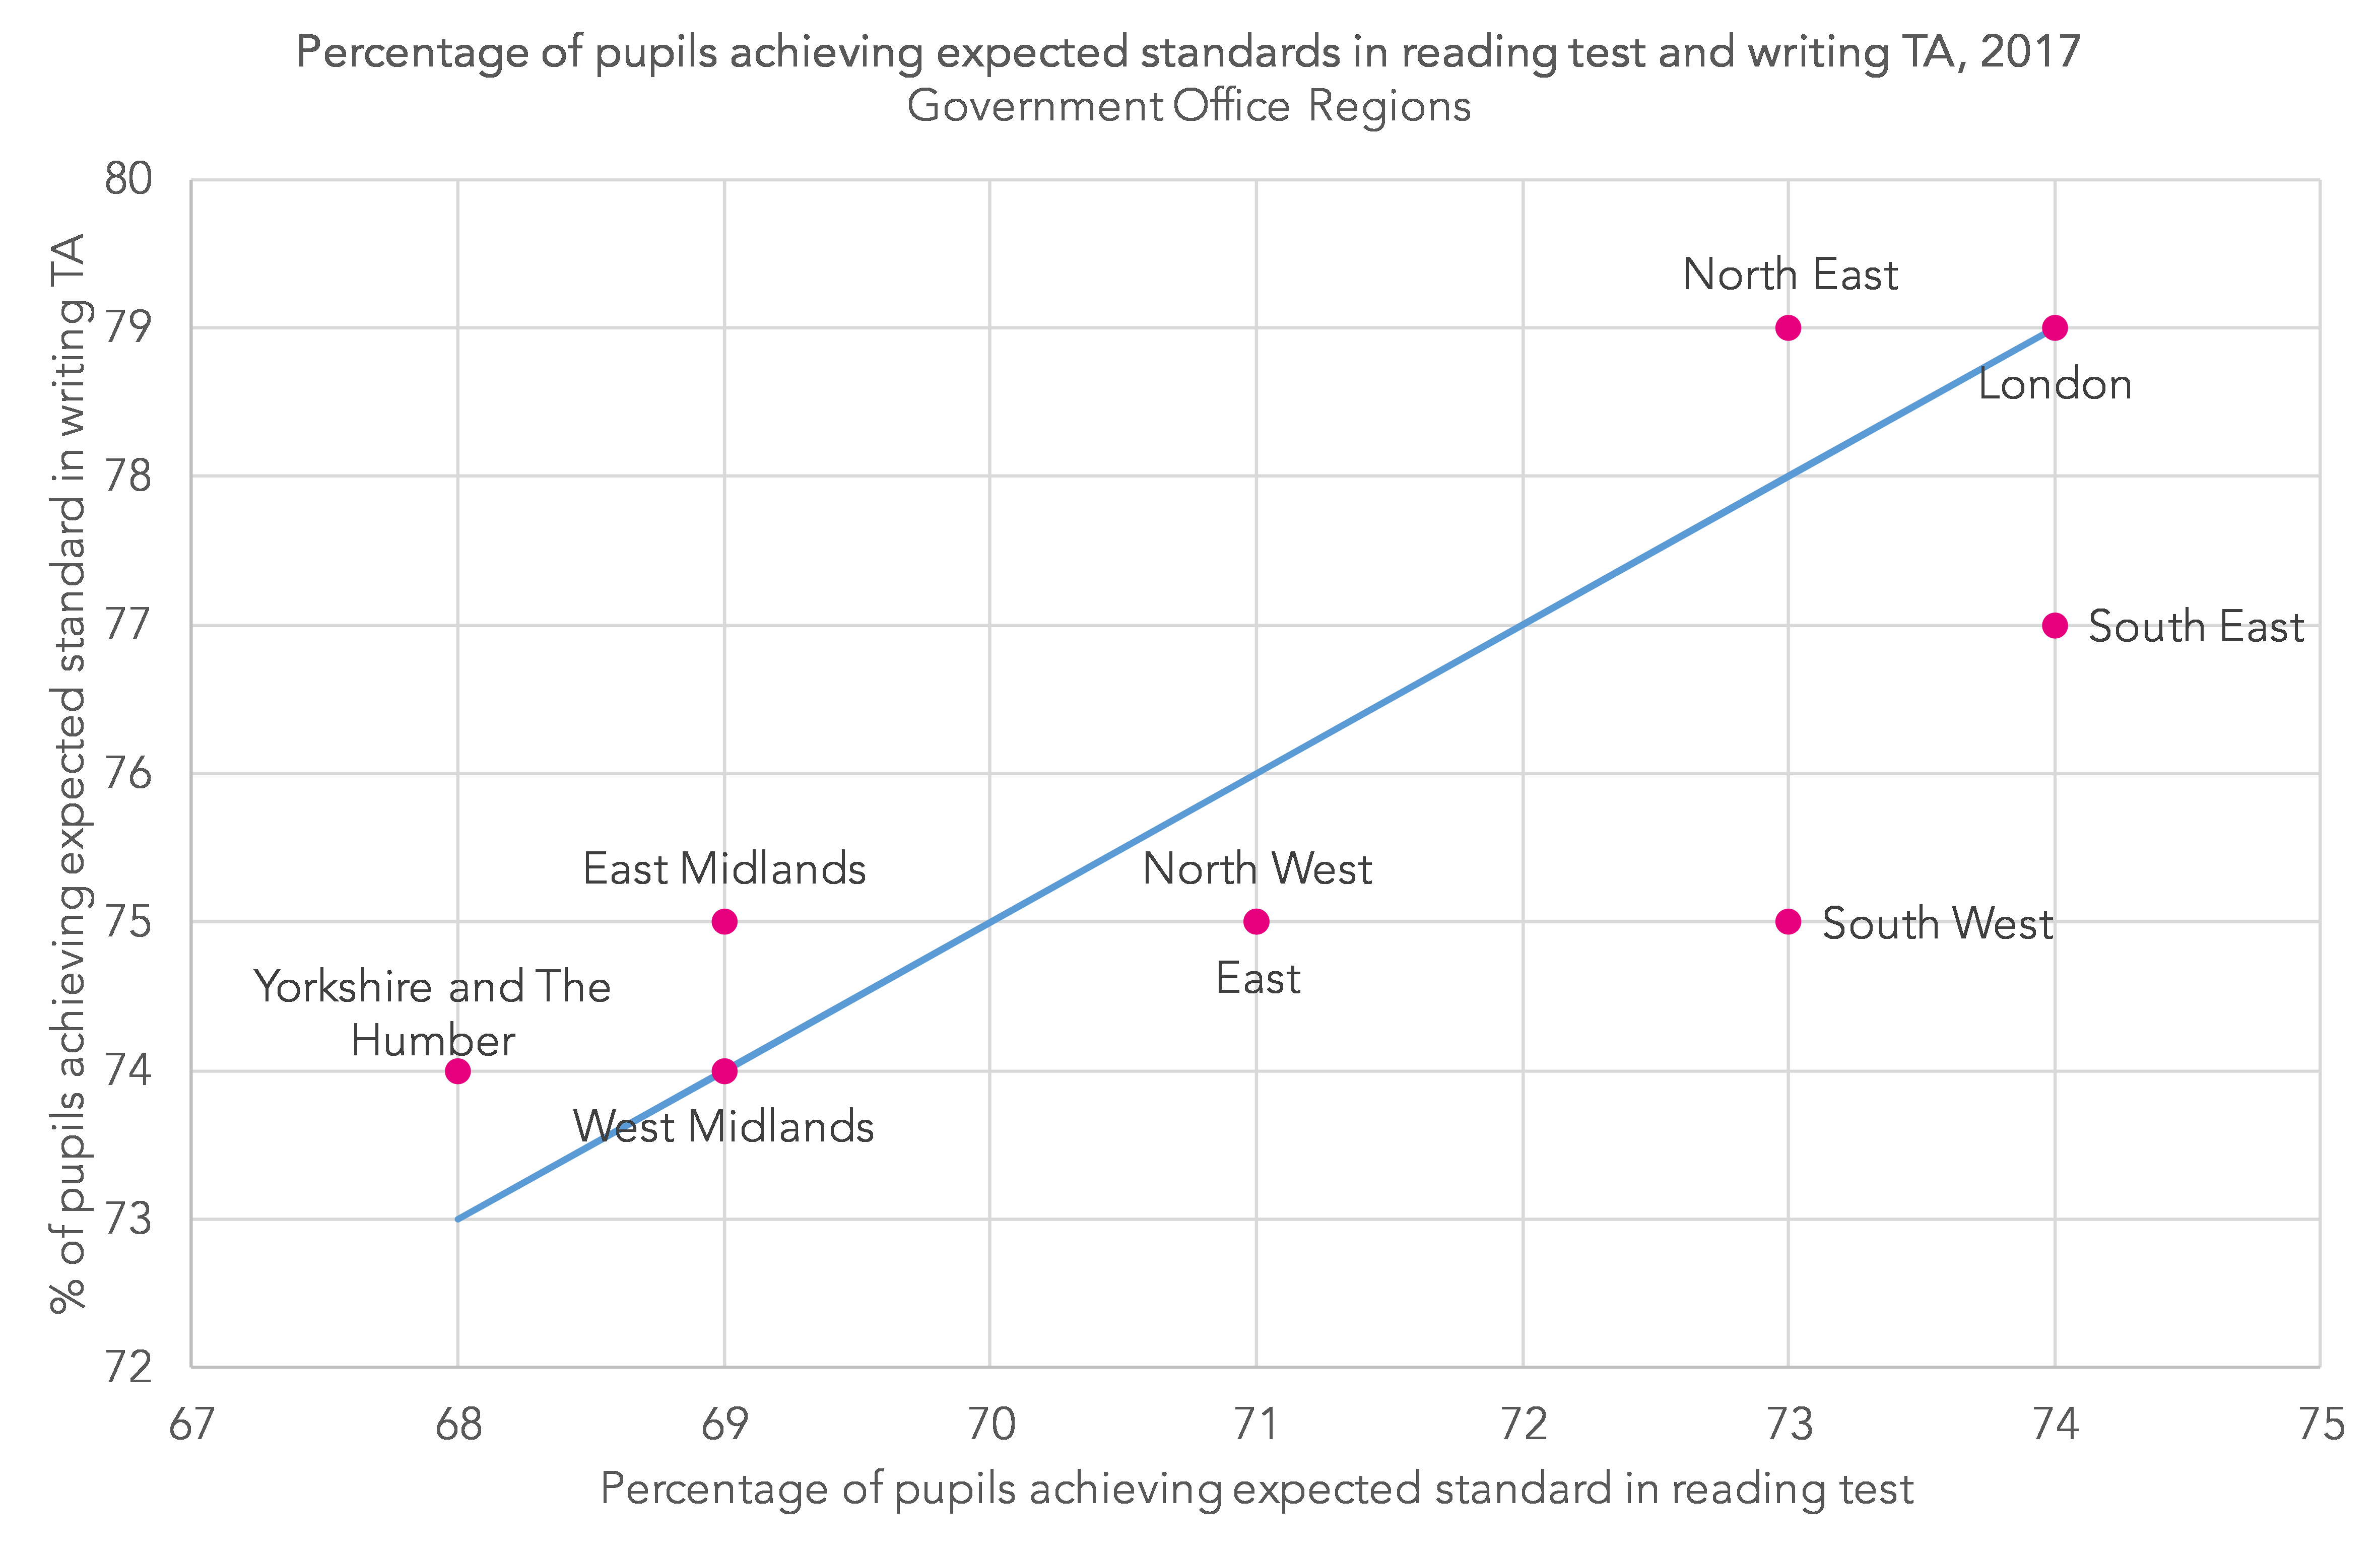
Nationally, more pupils reached the expected standard in the writing teacher assessment (76%) than in the reading test (71%), a gap of 5 percentage points. However, the gap was some way lower (2 percentage points) in the south-west.
5. There are changes to progress measures
FFT Aspire
If you are a school using FFT Aspire, why not check your results against estimates in Aspire?
Not an FFT Aspire user?
Today, schools get to see their provisional Key Stage 2 progress measures, on which floor standards are based. The technical documentation [PDF] shows that there have been some methodological changes, including allocating new Key Stage 2 scores to pupils working within the p-scales. Whereas last year such pupils were allocated a blanket score of 70, this year more granular scores in the range 60-70 have been used.
The chart below shows the mean Key Stage 2 score for reading and maths for each prior attainment group used in value added calculations. For the most part, mean scores in reading and writing are almost identical, although there are some slight differences, particularly for pupils with a Key Stage 1 average point score greater than 3 but below 9 (pupils working below Level 1 but above the p-scales). Maths scores tend to be between 1.5 and 2.0 points higher for these pupils.
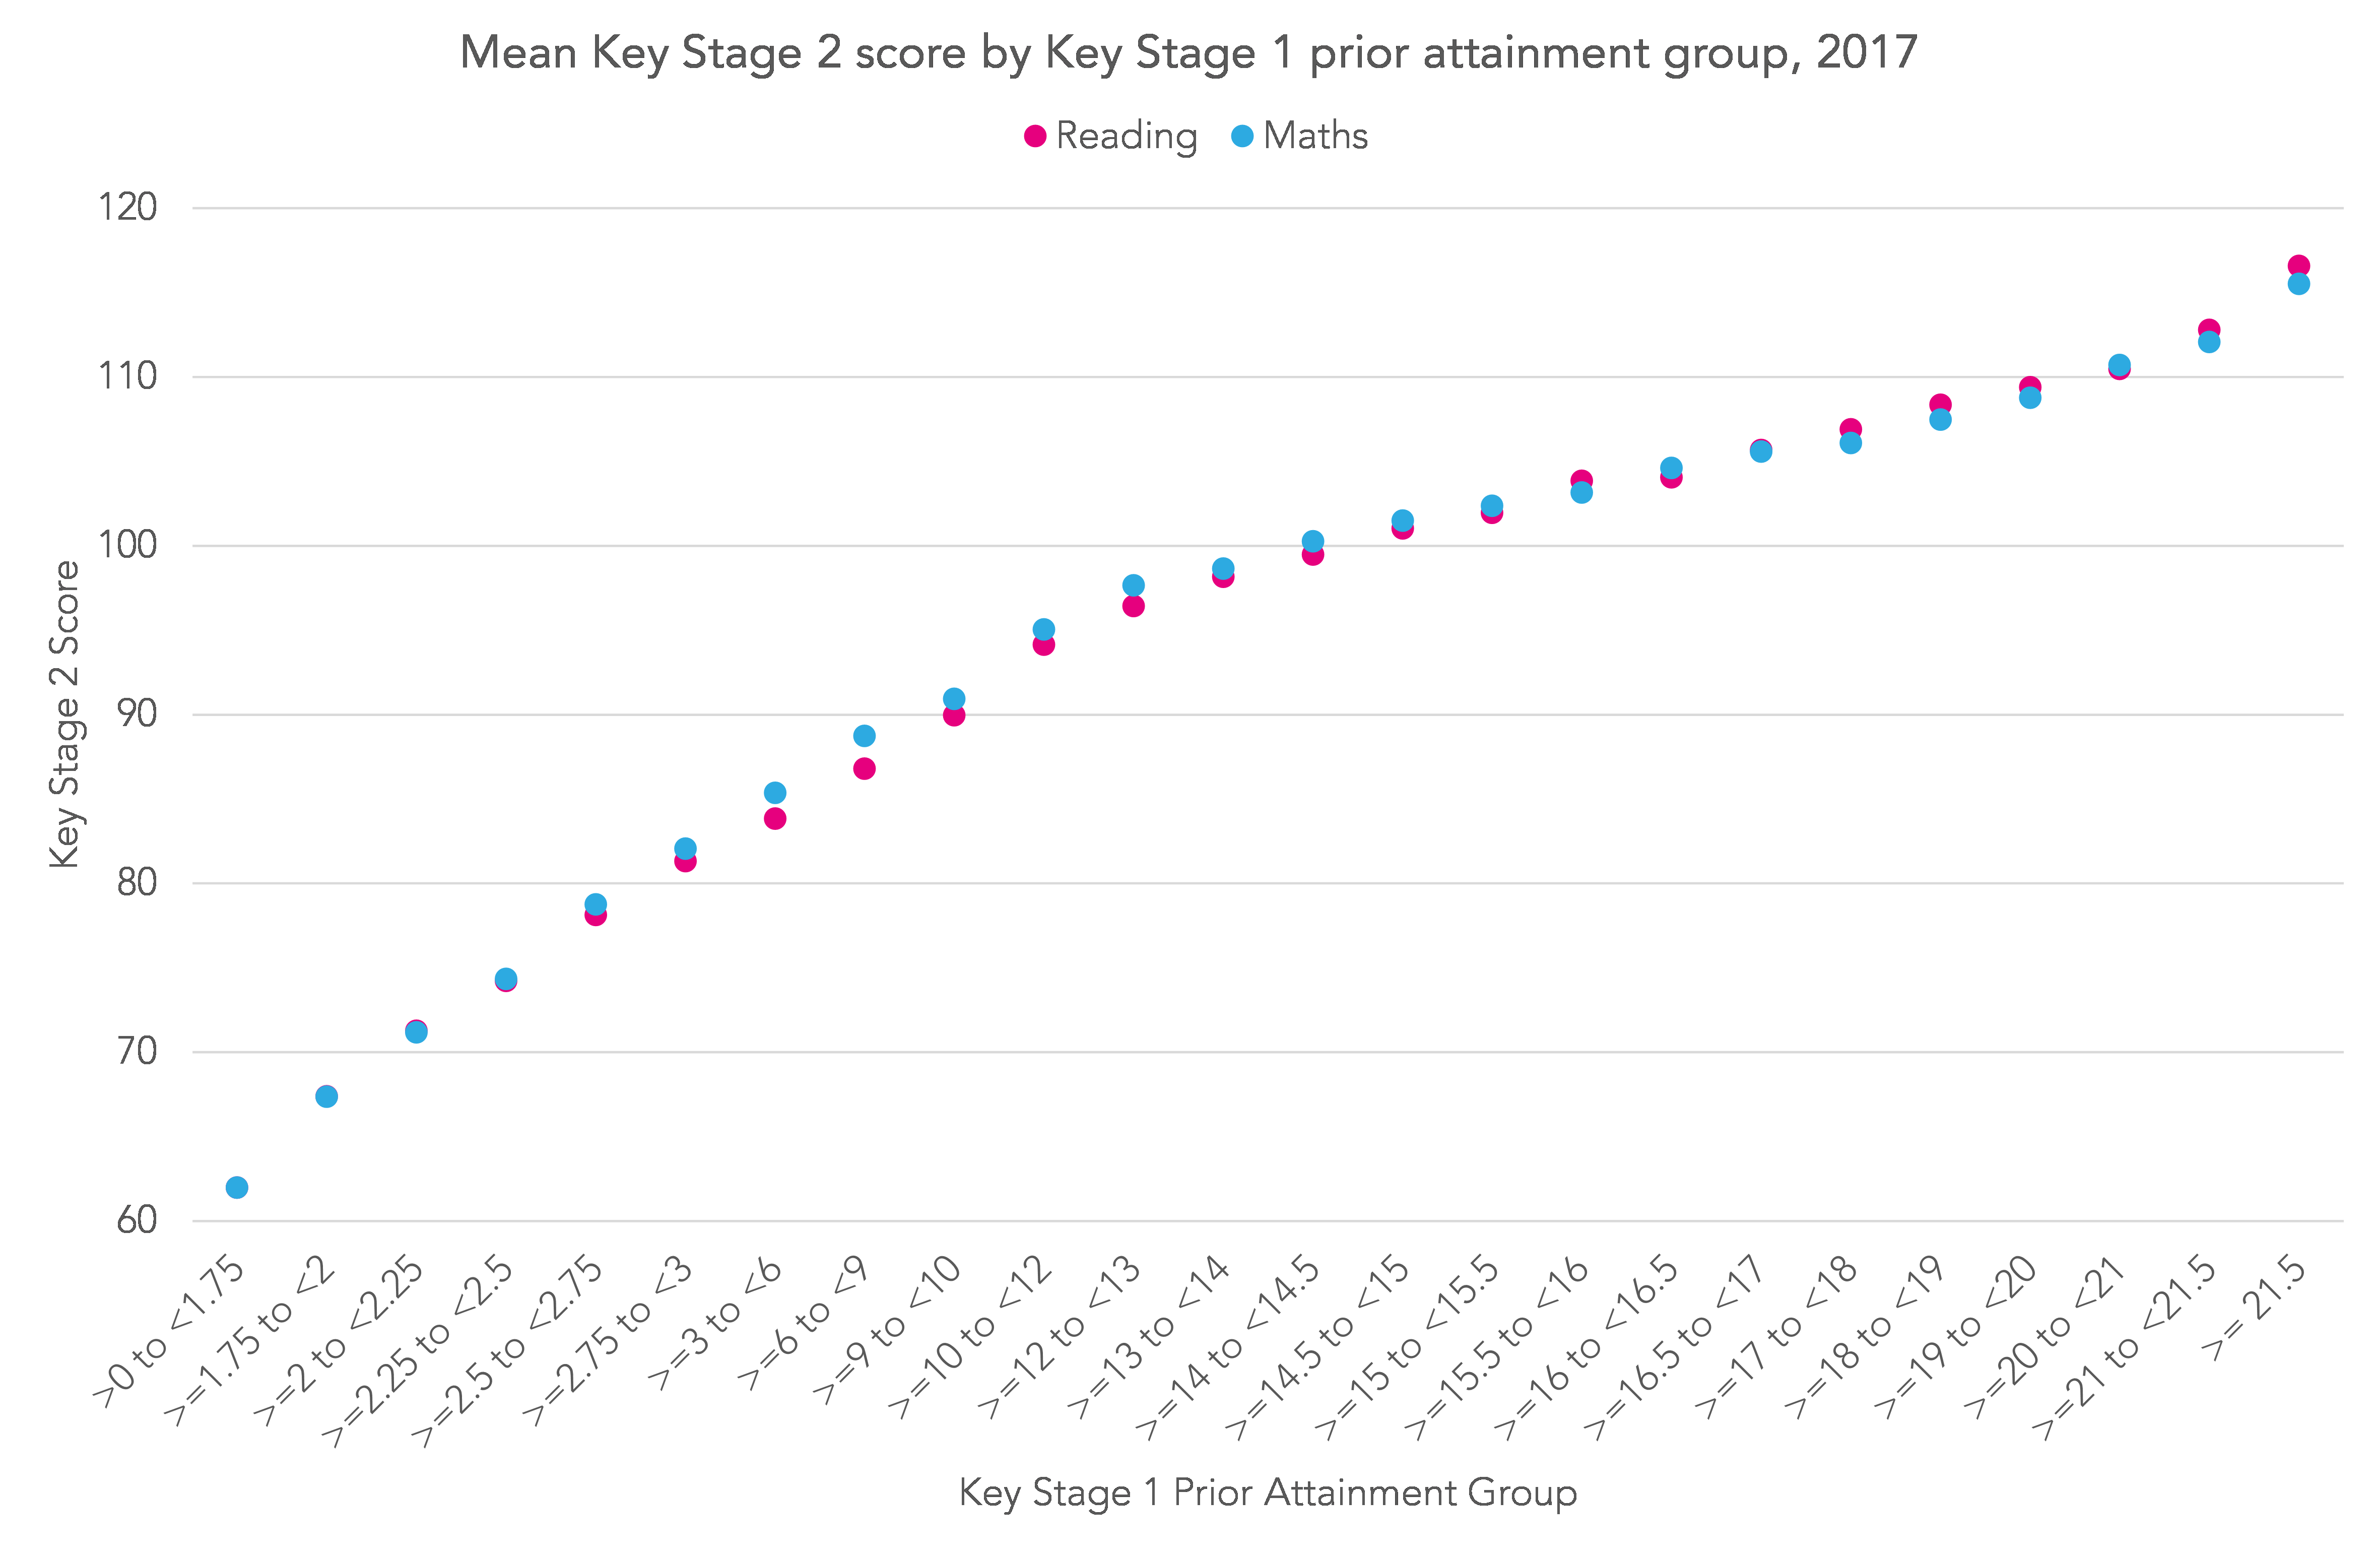
Whether the difference in learning between a pupil scoring 60 and a pupil scoring 70 is the same as that between a pupil scoring 90 and another scoring 100 (or pupils scoring 100 and 110) is, of course, open to debate.
Want to stay up-to-date with the latest research from Education Datalab? Sign up to our mailing list to get notifications about new blogposts, or to receive our half-termly newsletter.


Leave A Comment