I’ve recently started work on a very interesting Economic and Social Research Council-funded project with colleagues from the Universities of Westminster and Bath to examine the pathways of young people through the education system and into the labour market.
At present, we are examining the journeys of young people who turned 16 between 2002 and 2009. We have linked data on post-16 school enrolments, activity in the further education sector, higher education participation and achievement, benefits entitlements, employment histories, and earnings up until the end of the 2015/16 academic year.
This means we can examine the longer-term outcomes of young people with different types of qualification and different types of qualification choices.
In this blogpost, I’ll present a bit of work in progress about one type of qualification, the General National Vocational Qualification (GNVQ).
These were pretty controversial in the early part of the century. Back then, the headline measure in performance tables was achieving any five GCSEs at grades A*-C or equivalent. This threshold could be achieved by a pass in a full intermediate GNVQ plus a single A*-C GCSE (details on what GNVQs were are given in the box below).
One non-selective state school, Thomas Telford in Shropshire, adopted the GNVQ wholeheartedly and became famous for achieving a 100% pass rate. More schools followed and concerns were raised about gaming the system by entering pupils in GNVQ to boost their performance.
But how did it work out for those that took them?
What were GNVQs?
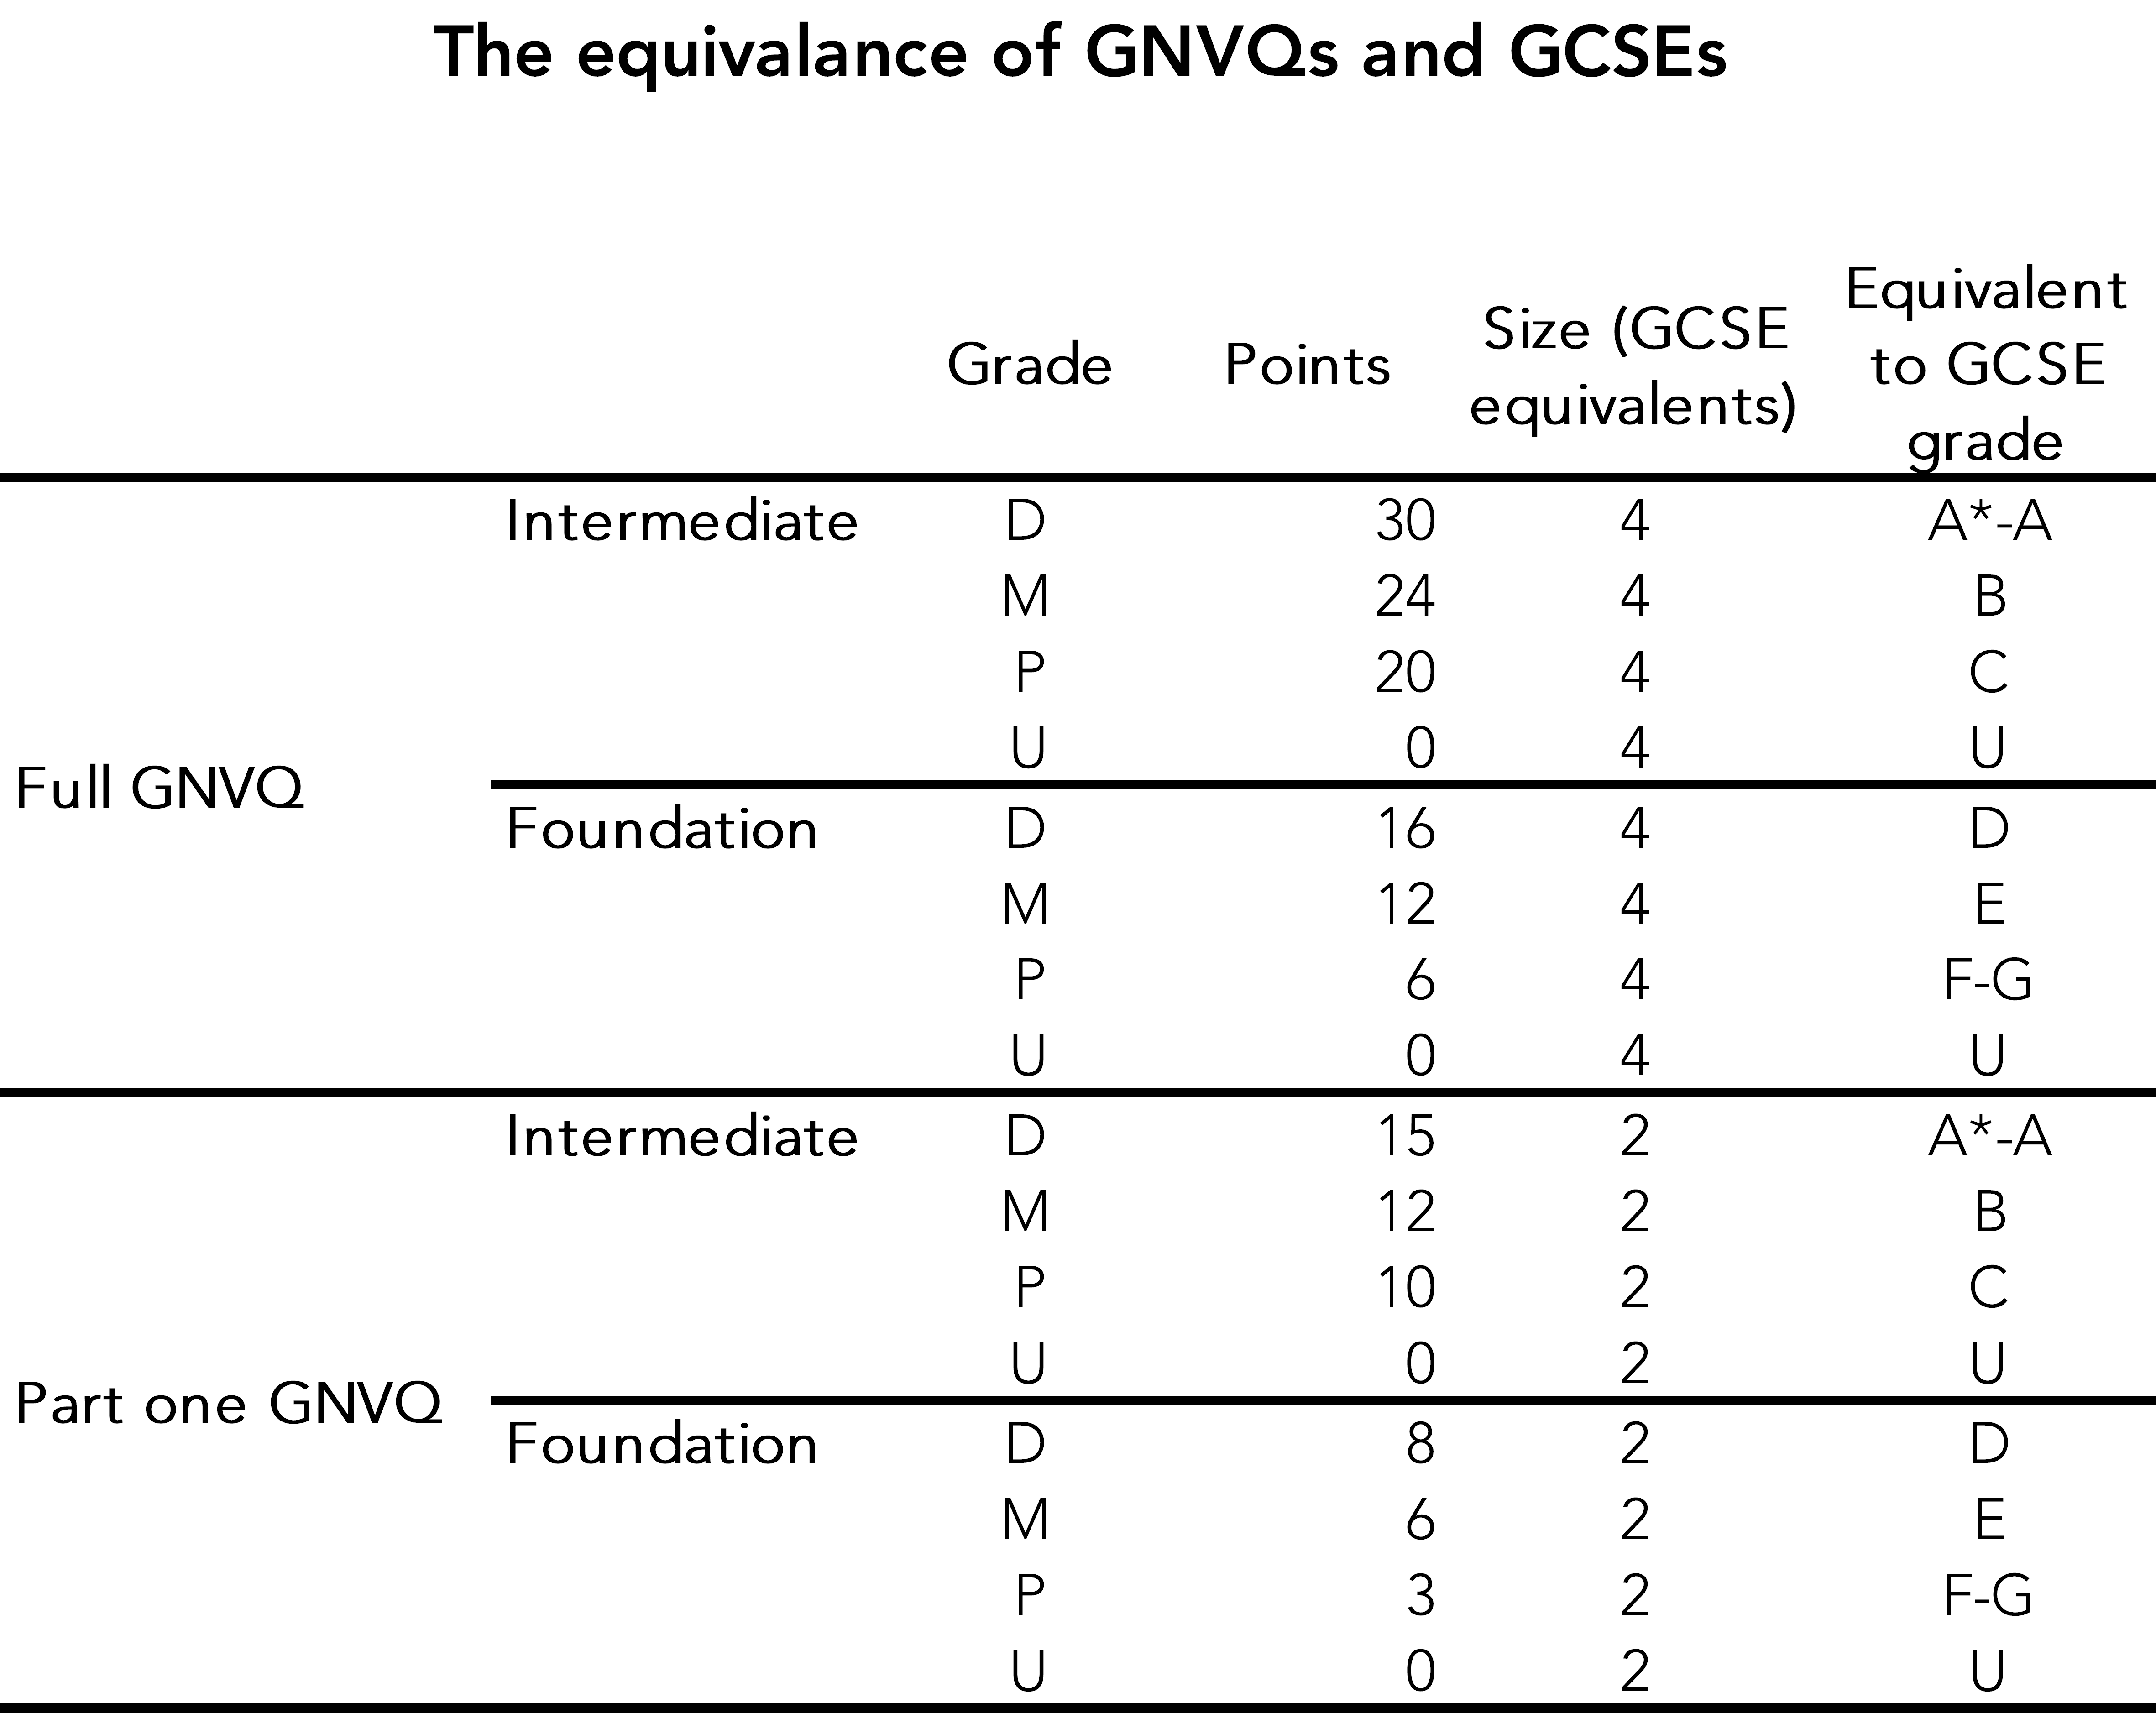
GNVQs were introduced in the early 1990s to provide experiences and education relevant to working life, but stopped short of providing training for a specific job. They could be studied at foundation level (equivalent to GCSE grades D-G), intermediate level (equivalent to GCSE grades A*-C) and advanced level (equivalent to A-Level), and were available in 15 broad vocational areas.
The full GNVQ consisted of six modules, each of which had a recommended guided learning time of 60 hours, or else a qualification consisting of half this number of modules (a ‘part one GNVQ’) could be done. Two-thirds of the modules were internally assessed based on coursework. The full GNVQ was considered equivalent to four GCSEs and the part one GNVQ equivalent to two GCSEs.
By 2003, pupils at the end of Key Stage 4 were entering some 135,000 foundation and intermediate GNVQs. Over 60% were in applied information and communication technology.
For those interested, this table shows the equivalence of GNVQs and GCSEs in school performance indicators.
The data
We start off with all pupils in state-funded mainstream schools who turned 16 during the 2002/03 academic year. Of 544,000 pupils in total, 121,000 entered at least one GNVQ qualification.
For each GNVQ entrant, we identify their ‘highest’ GNVQ. Intermediate GNVQs are favoured over foundation GNVQs, and full GNVQs over part one GNVQs. In the case of ties, the qualification with the highest grade is chosen.
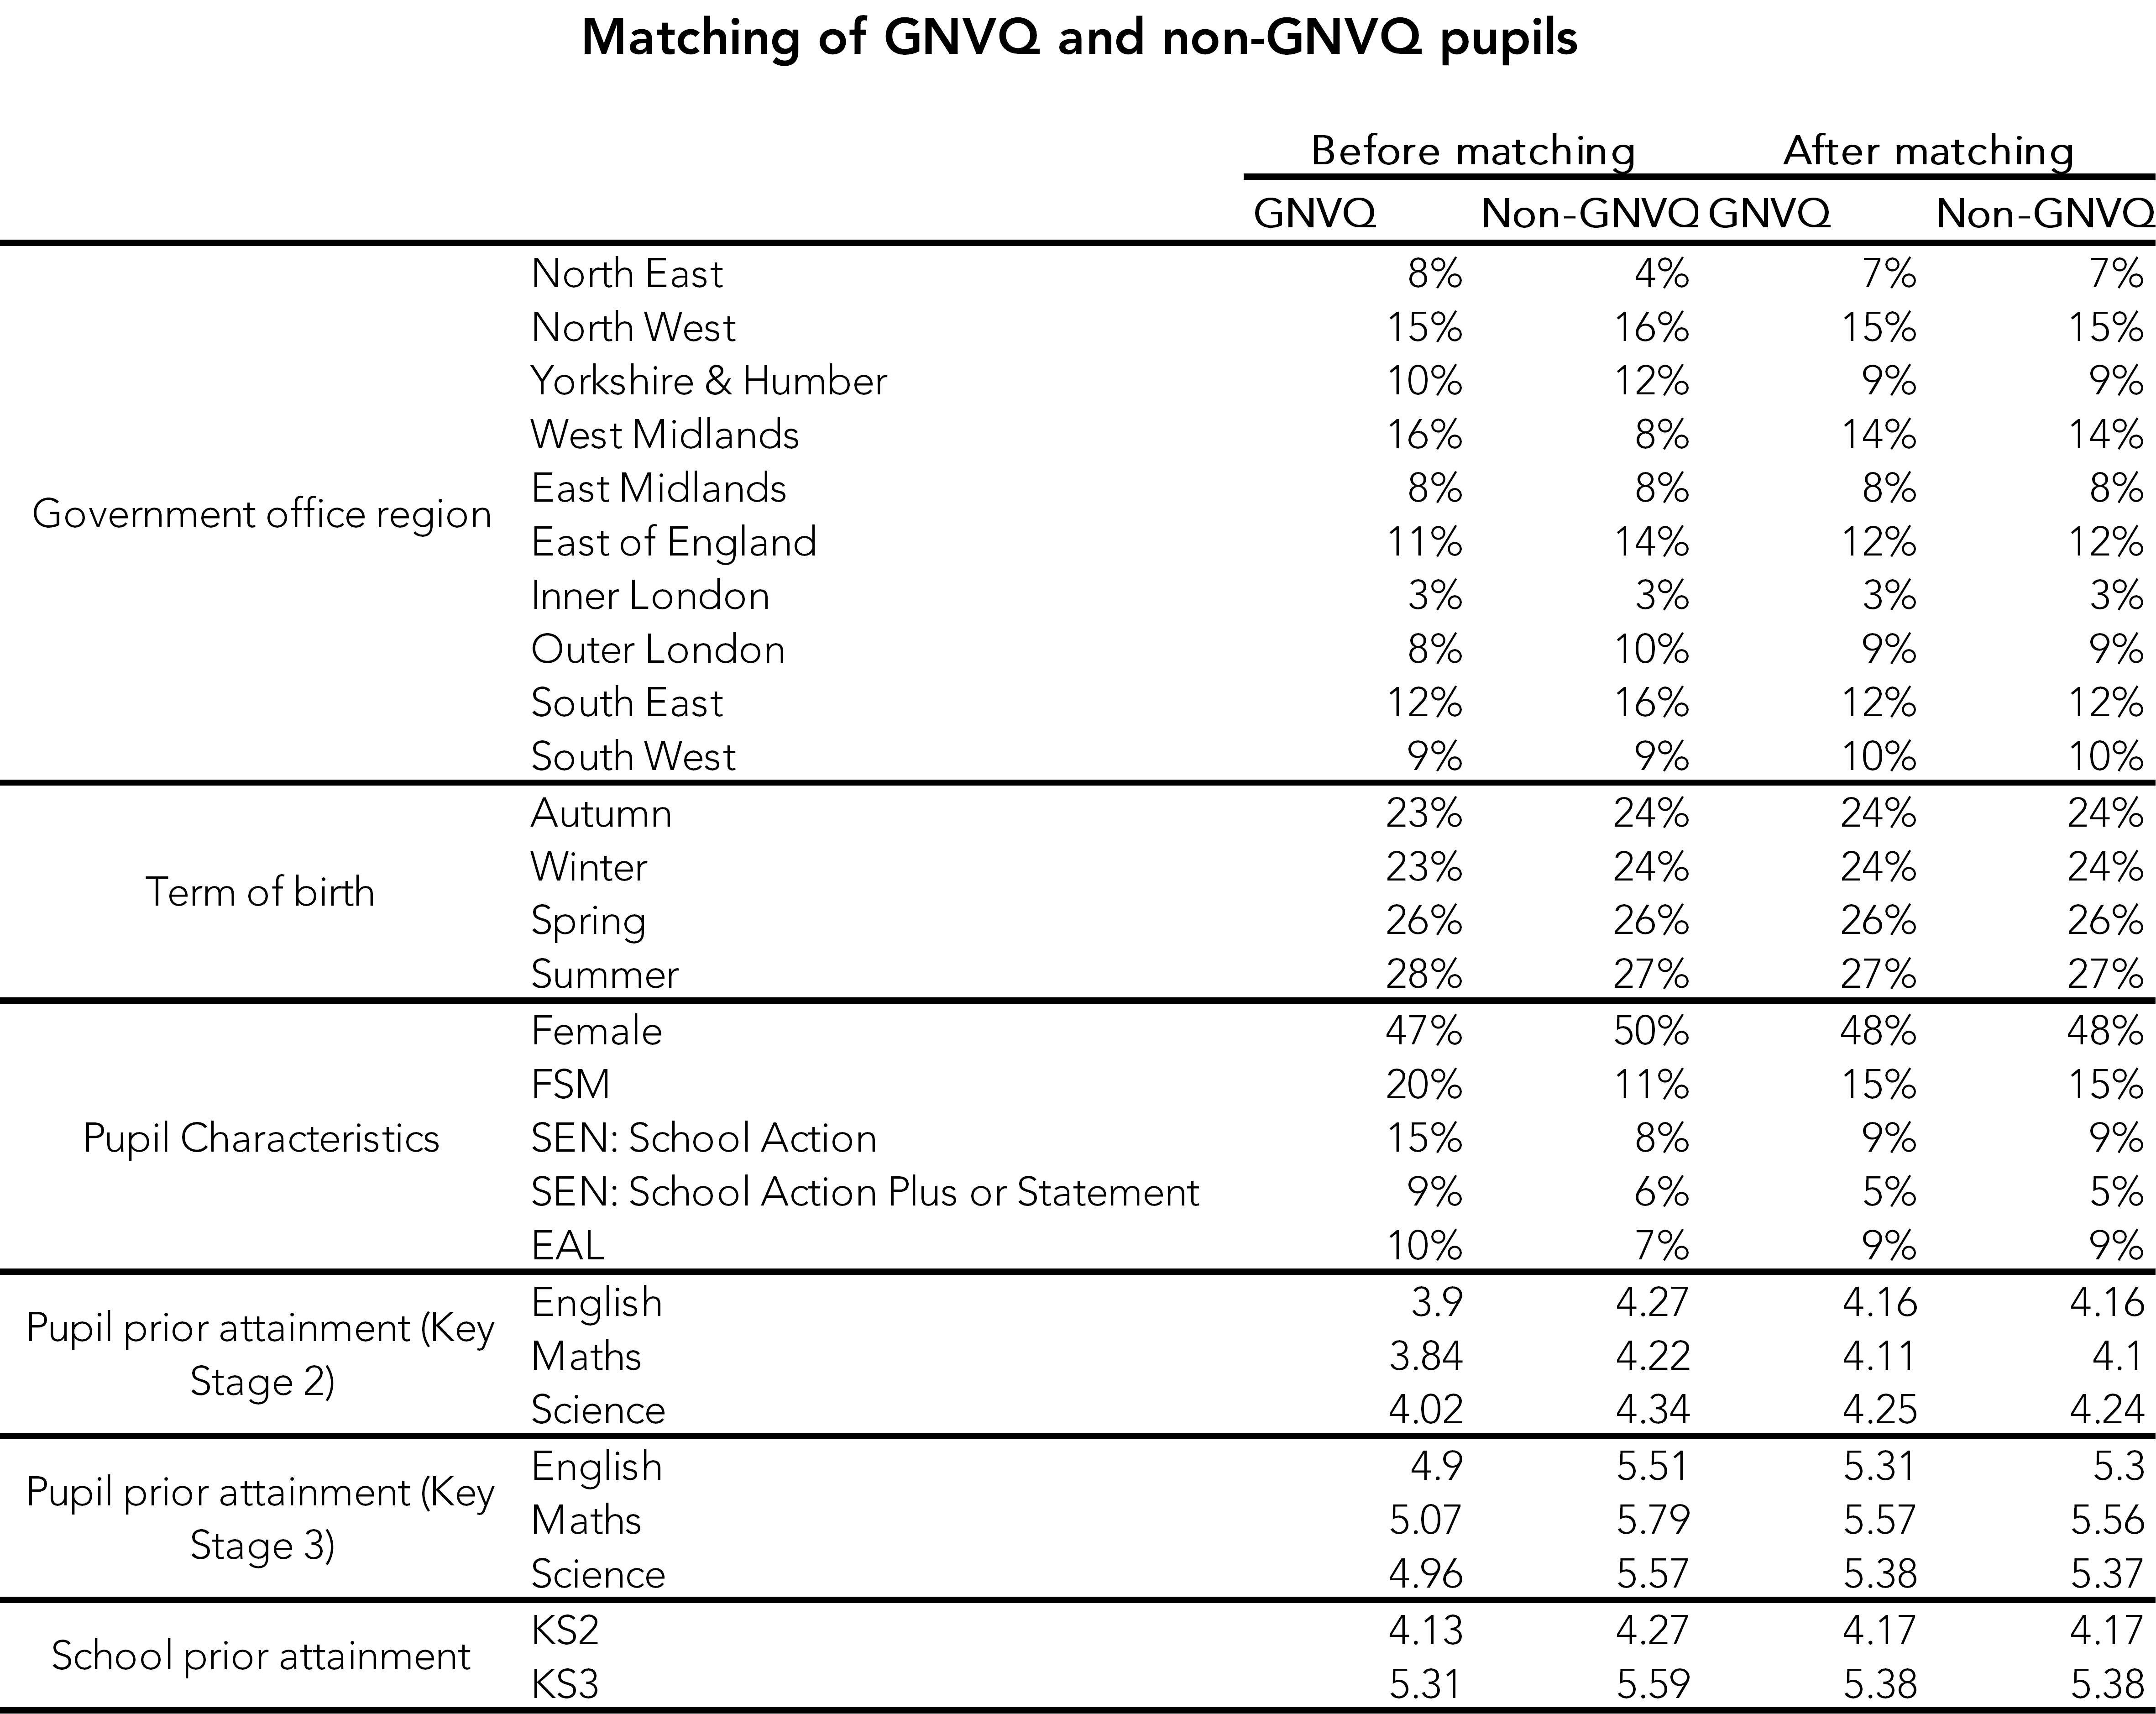
Then, again for each GNVQ entrant, we try to find a statistically similar pupil who did not enter a GNVQ to act as a comparison, using only pupils from schools that did not offer GNVQs. Comparison groups are calculated for each of the four types of GNVQ considered: full intermediate; part one intermediate; full foundation; part one foundation.
Statistical similarity is defined in terms of the variables listed in the table below. Pupils are matched exactly on region and free school meal (FSM) status and then by statistical similarity[1] on the other variables. So an FSM-eligible pupil in the north east entered for a GNVQ is matched with an FSM-eligible pupil in the north east from a school which did not enter any pupils for GNVQs.
Before matching, the GNVQ and non-GNVQ groups are somewhat unbalanced. The GNVQ group tends to have lower prior attainment, and a higher percentage of FSM and pupils with special educational needs (SEN). Those from the west Midlands are also over-represented. The matching process balances the two groups almost perfectly on average.[2]
Key Stage 4 outcomes
The chart below shows Key Stage 4 outcomes for the population of pupils we have built.
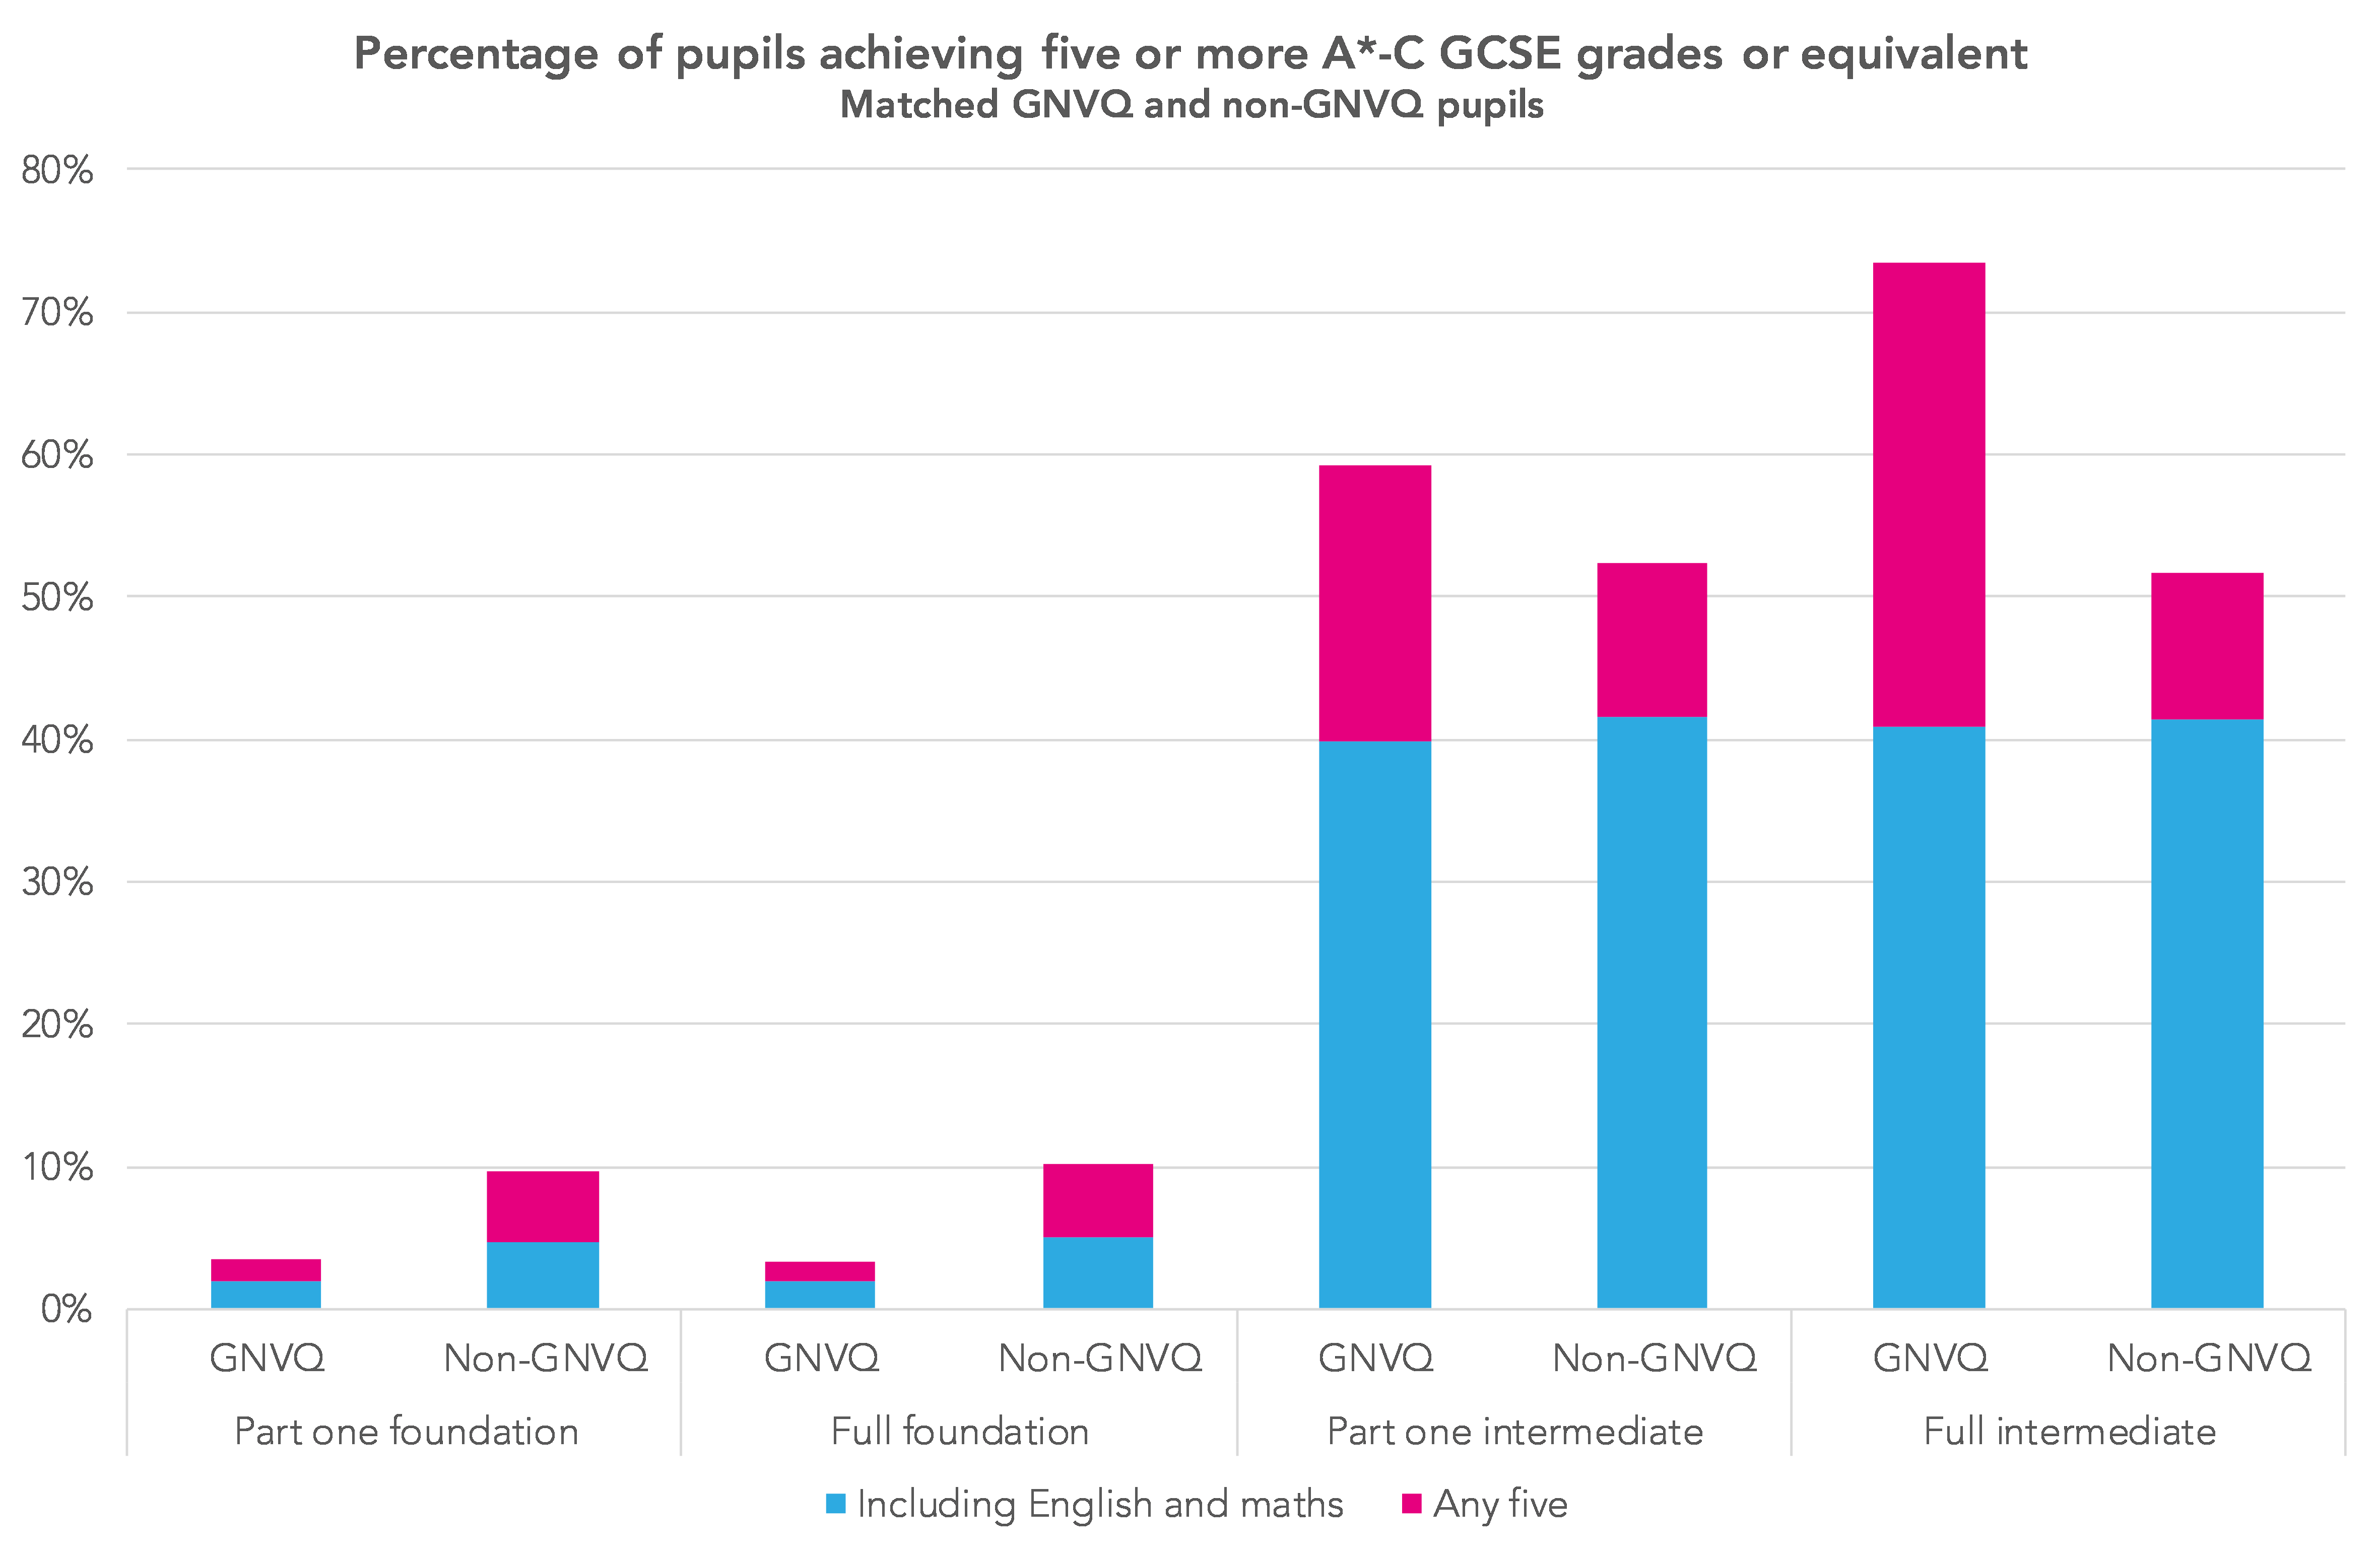
As the chart shows, those who entered intermediate GNVQs (equivalent to GCSE grades A*-C) at first glance appear to have stronger Key Stage 4 attainment – at least in terms of the percentage achieving five or more A*-C GCSE grades or equivalent, the headline measure in performance tables at the time.
However, when grade C passes in English and maths are included in the measure, the apparent advantage of the GNVQ group disappears.
Subsequent outcomes
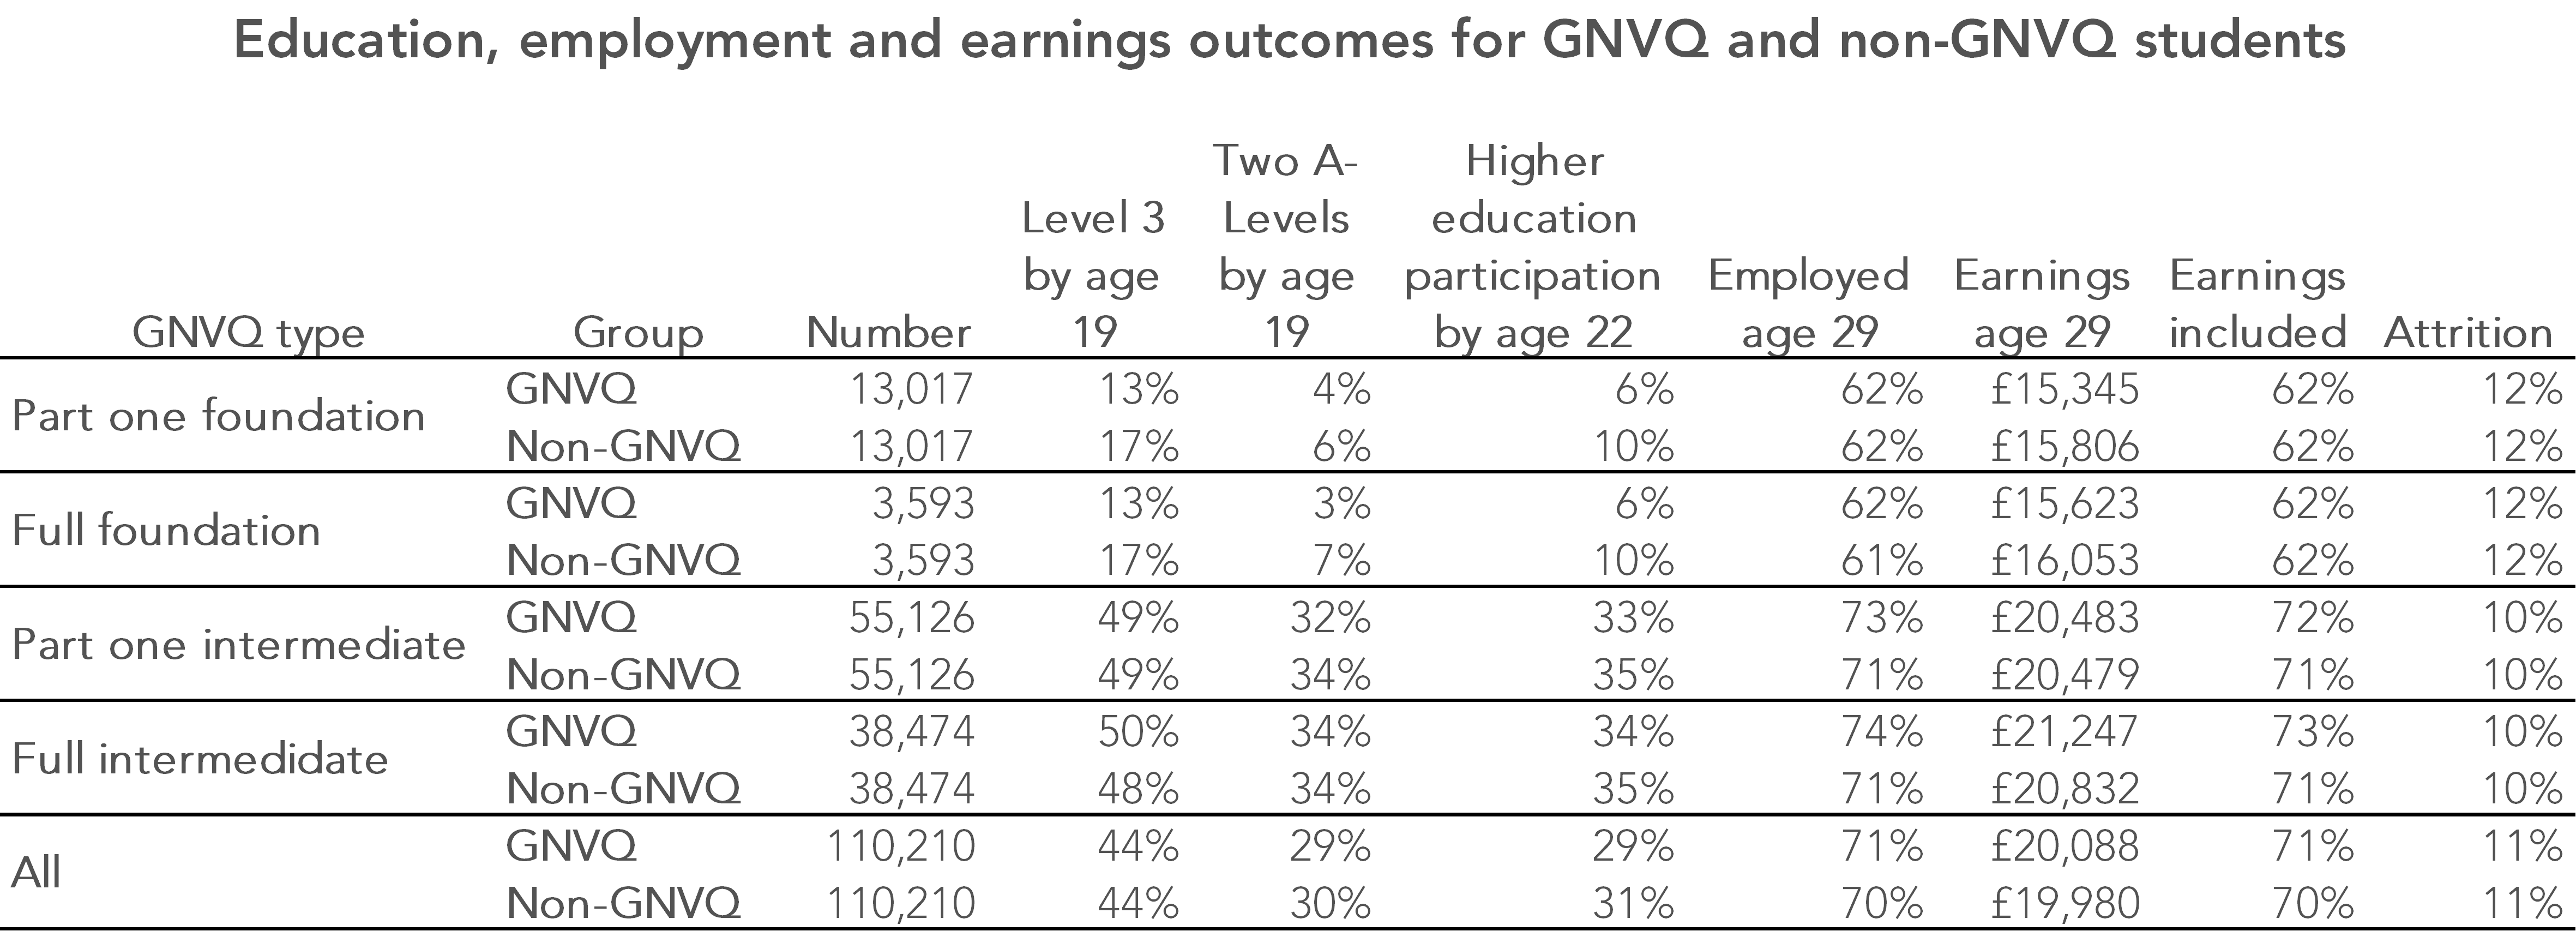
We look at five subsequent outcomes:
- Achievement of NQF Level 3 (two A-levels or equivalent) by age 19. Source: National Pupil Database post-16 achievement data
- Achievement of two A-levels by age 19. Source: National Pupil Database post-16 achievement data
- Higher education participation by age 22. Source: Higher Education Statistics Agency student record
- Employed for at least 180 days in 2015/16 (age 29). Source: matched HMRC employment (P45) data
- Earnings at age 29. Source: matched HMRC earnings (P14) data
There are some limitations, however. None of the data sources captures emigration or death. The HMRC data excludes those who are self-employed. As the earnings data contains some implausible values, we drop the top and bottom 1% of values.
Some young people drop out the various data sources we use. We therefore calculate an attrition indicator, measuring the proportion of individuals who we do not observe in any source after age 25.
We also report the percentage of 16-year-olds for whom we have earnings data in 2015/16. When earnings are reported, we only include those for whom we have earnings data.
The results
Overall, there was little difference between the GNVQ group and the comparison group on all outcomes, though the former were slightly less likely to have participated in higher education by age 22 and slightly more likely to be employed at age 29. The employment difference was slightly larger among those who had entered an intermediate GNVQ.
The table below shows the full details.
So overall there’s not much difference between those who did GNVQs and those who didn’t. On the surface it doesn’t seem to have hindered pupils’ longer-term outcomes and might have even helped (a bit) in the world of work.
Given that those who entered intermediate GNVQs appeared to have superior end of Key Stage 4 attainment, it does seem that they were over-valued in performance tables all those years ago. Would so many have taken them if they weren’t?
This is a question which still has relevance for the present even though GNVQs were phased out over ten years ago. There are clear parallels with the European Computer Driving Licence or ECDL, another IT qualification that was over-valued in performance tables and ended up being taken by 20-25% of pupils nationally. It seems we never learn.
Want to stay up-to-date with the latest research from FFT Education Datalab? Follow us on Twitter to get all of our research as it comes out.
The support of the Economic and Social Research Council is gratefully acknowledged.
![]()
1. Propensity score.
2. A table giving showing the full effect of carrying out this matching can be found here.


Leave A Comment