This is a joint blogpost from FFT Education Datalab and the Association of School and College Leaders (ASCL).
We recently took a look at the relationship between Progress 8 scores and Ofsted ratings.
But we might wonder – what kind of relationship exists between Key Stage 2 progress scores and inspection ratings?
How many inspections were there?
During the 2017/18 academic year, 3,815 inspections were carried out of schools that had Key Stage 2 progress scores in 2017. Specifically, here we’ve counted full, section 5 inspections and short, section 8 inspections.[1]
At the start of the last academic year, short inspections could convert into a full inspection where the inspection team suspected that the school had changed rating, but the process changed during the year, with short inspections no longer converting to full inspections in most cases. Full details are given in the box below.
How have short inspections changed?
For mainstream schools, short inspections are one-day inspections for those with good ratings.
Ofsted’s approach changed during the 2017/2018 academic year. Previously, mainstream schools that had a good rating would receive a short, one-day inspection, instead of a full inspection. This converted to a full inspection in those cases where Ofsted suspected that the school had either improved or declined, or where insufficient evidence could be gathered to confirm that the schools remained good. Otherwise, the good rating would be confirmed.
Now, however, a certain proportion of schools with good ratings receive full inspections from the outset, where pre-inspection evidence suggests the inspection would have been highly likely to convert. And, short inspections generally no longer convert to being a full inspection – rather, the school’s next inspection (usually 1-2 years later) becomes a full inspection in those cases where Ofsted believes an inspection rating other than good is likely to be warranted.
In total, 2,591 short inspections were carried out in 2017/18, with 183 converting to full inspection status.
And there were 1,224 full inspections that started as such – giving a total of 1,407 full, section 5 inspections (either starting as a full inspection, or starting as a short inspection and converting).
Progress scores
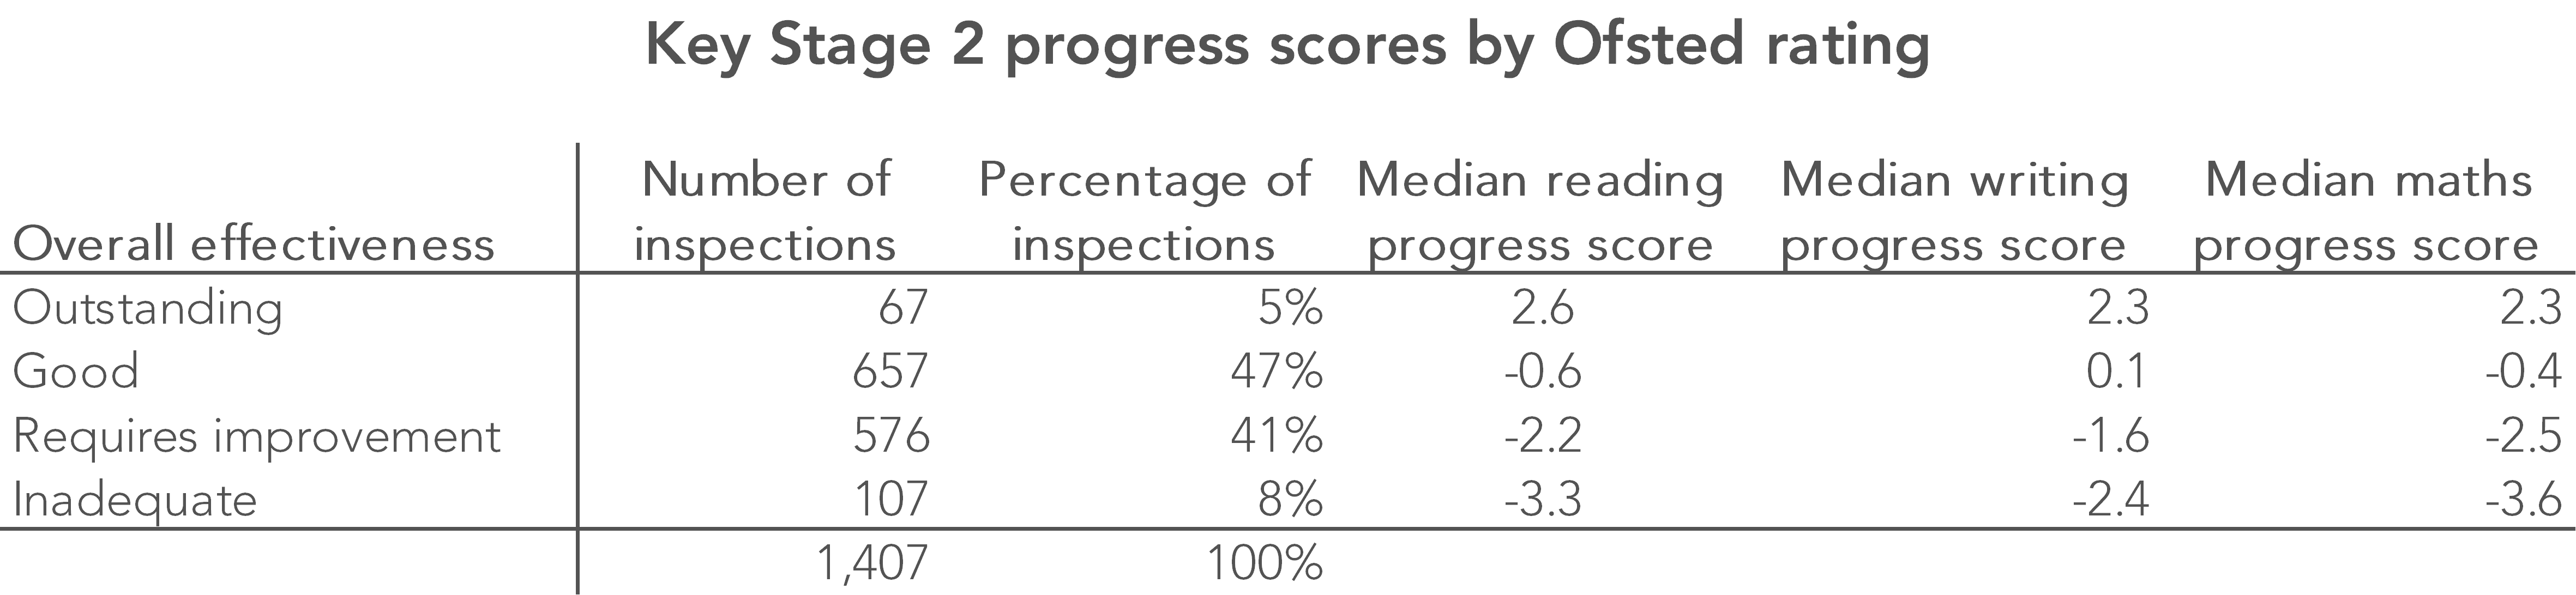
For these 1,407 inspections, the median 2017 reading progress score of the schools inspected was -1.3, while for writing it was -0.6, and for maths, -1.5. It is worth emphasising here that, because we’re not looking at short inspections that did not convert, we’re excluding the majority of schools that started off with a good inspection rating.
The table below shows the mix of overall effectiveness ratings awarded, together with median progress scores for each grade.
Looking at things another way, the charts below group schools into the progress score bandings used in the Department for Education’s league tables, and show the relationship between these progress scores and Ofsted ratings for each of reading, writing and maths.[2]
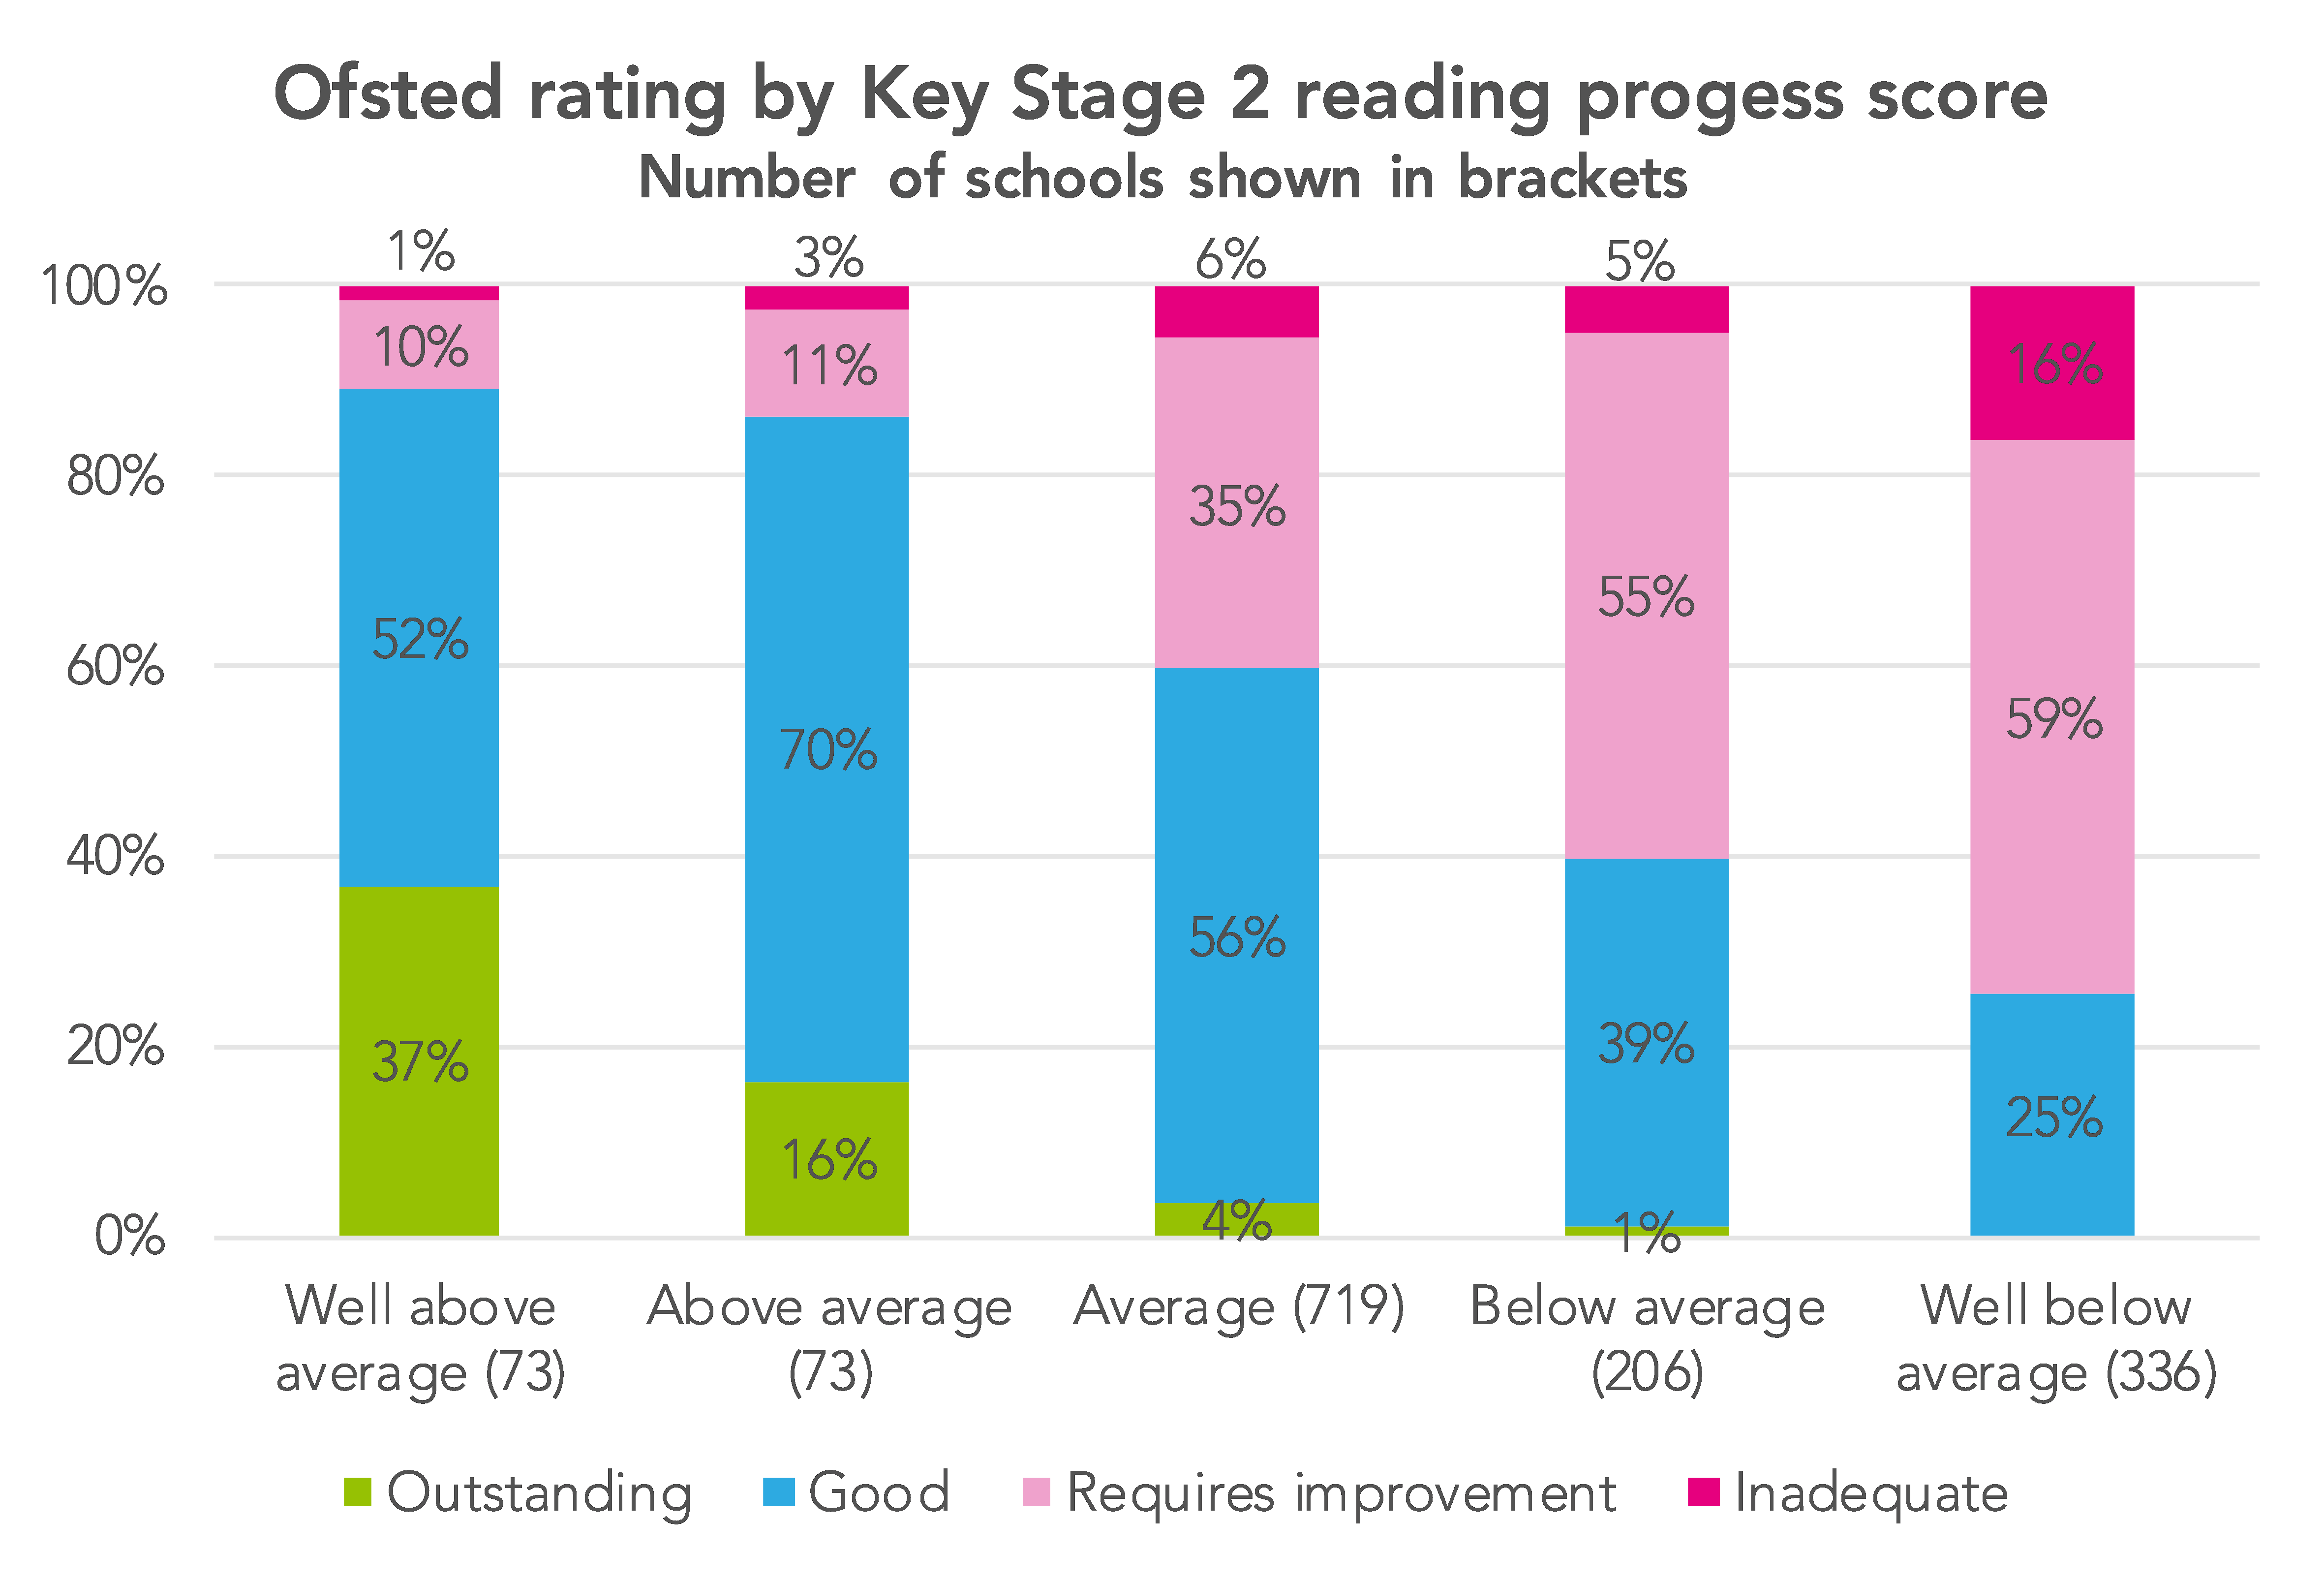
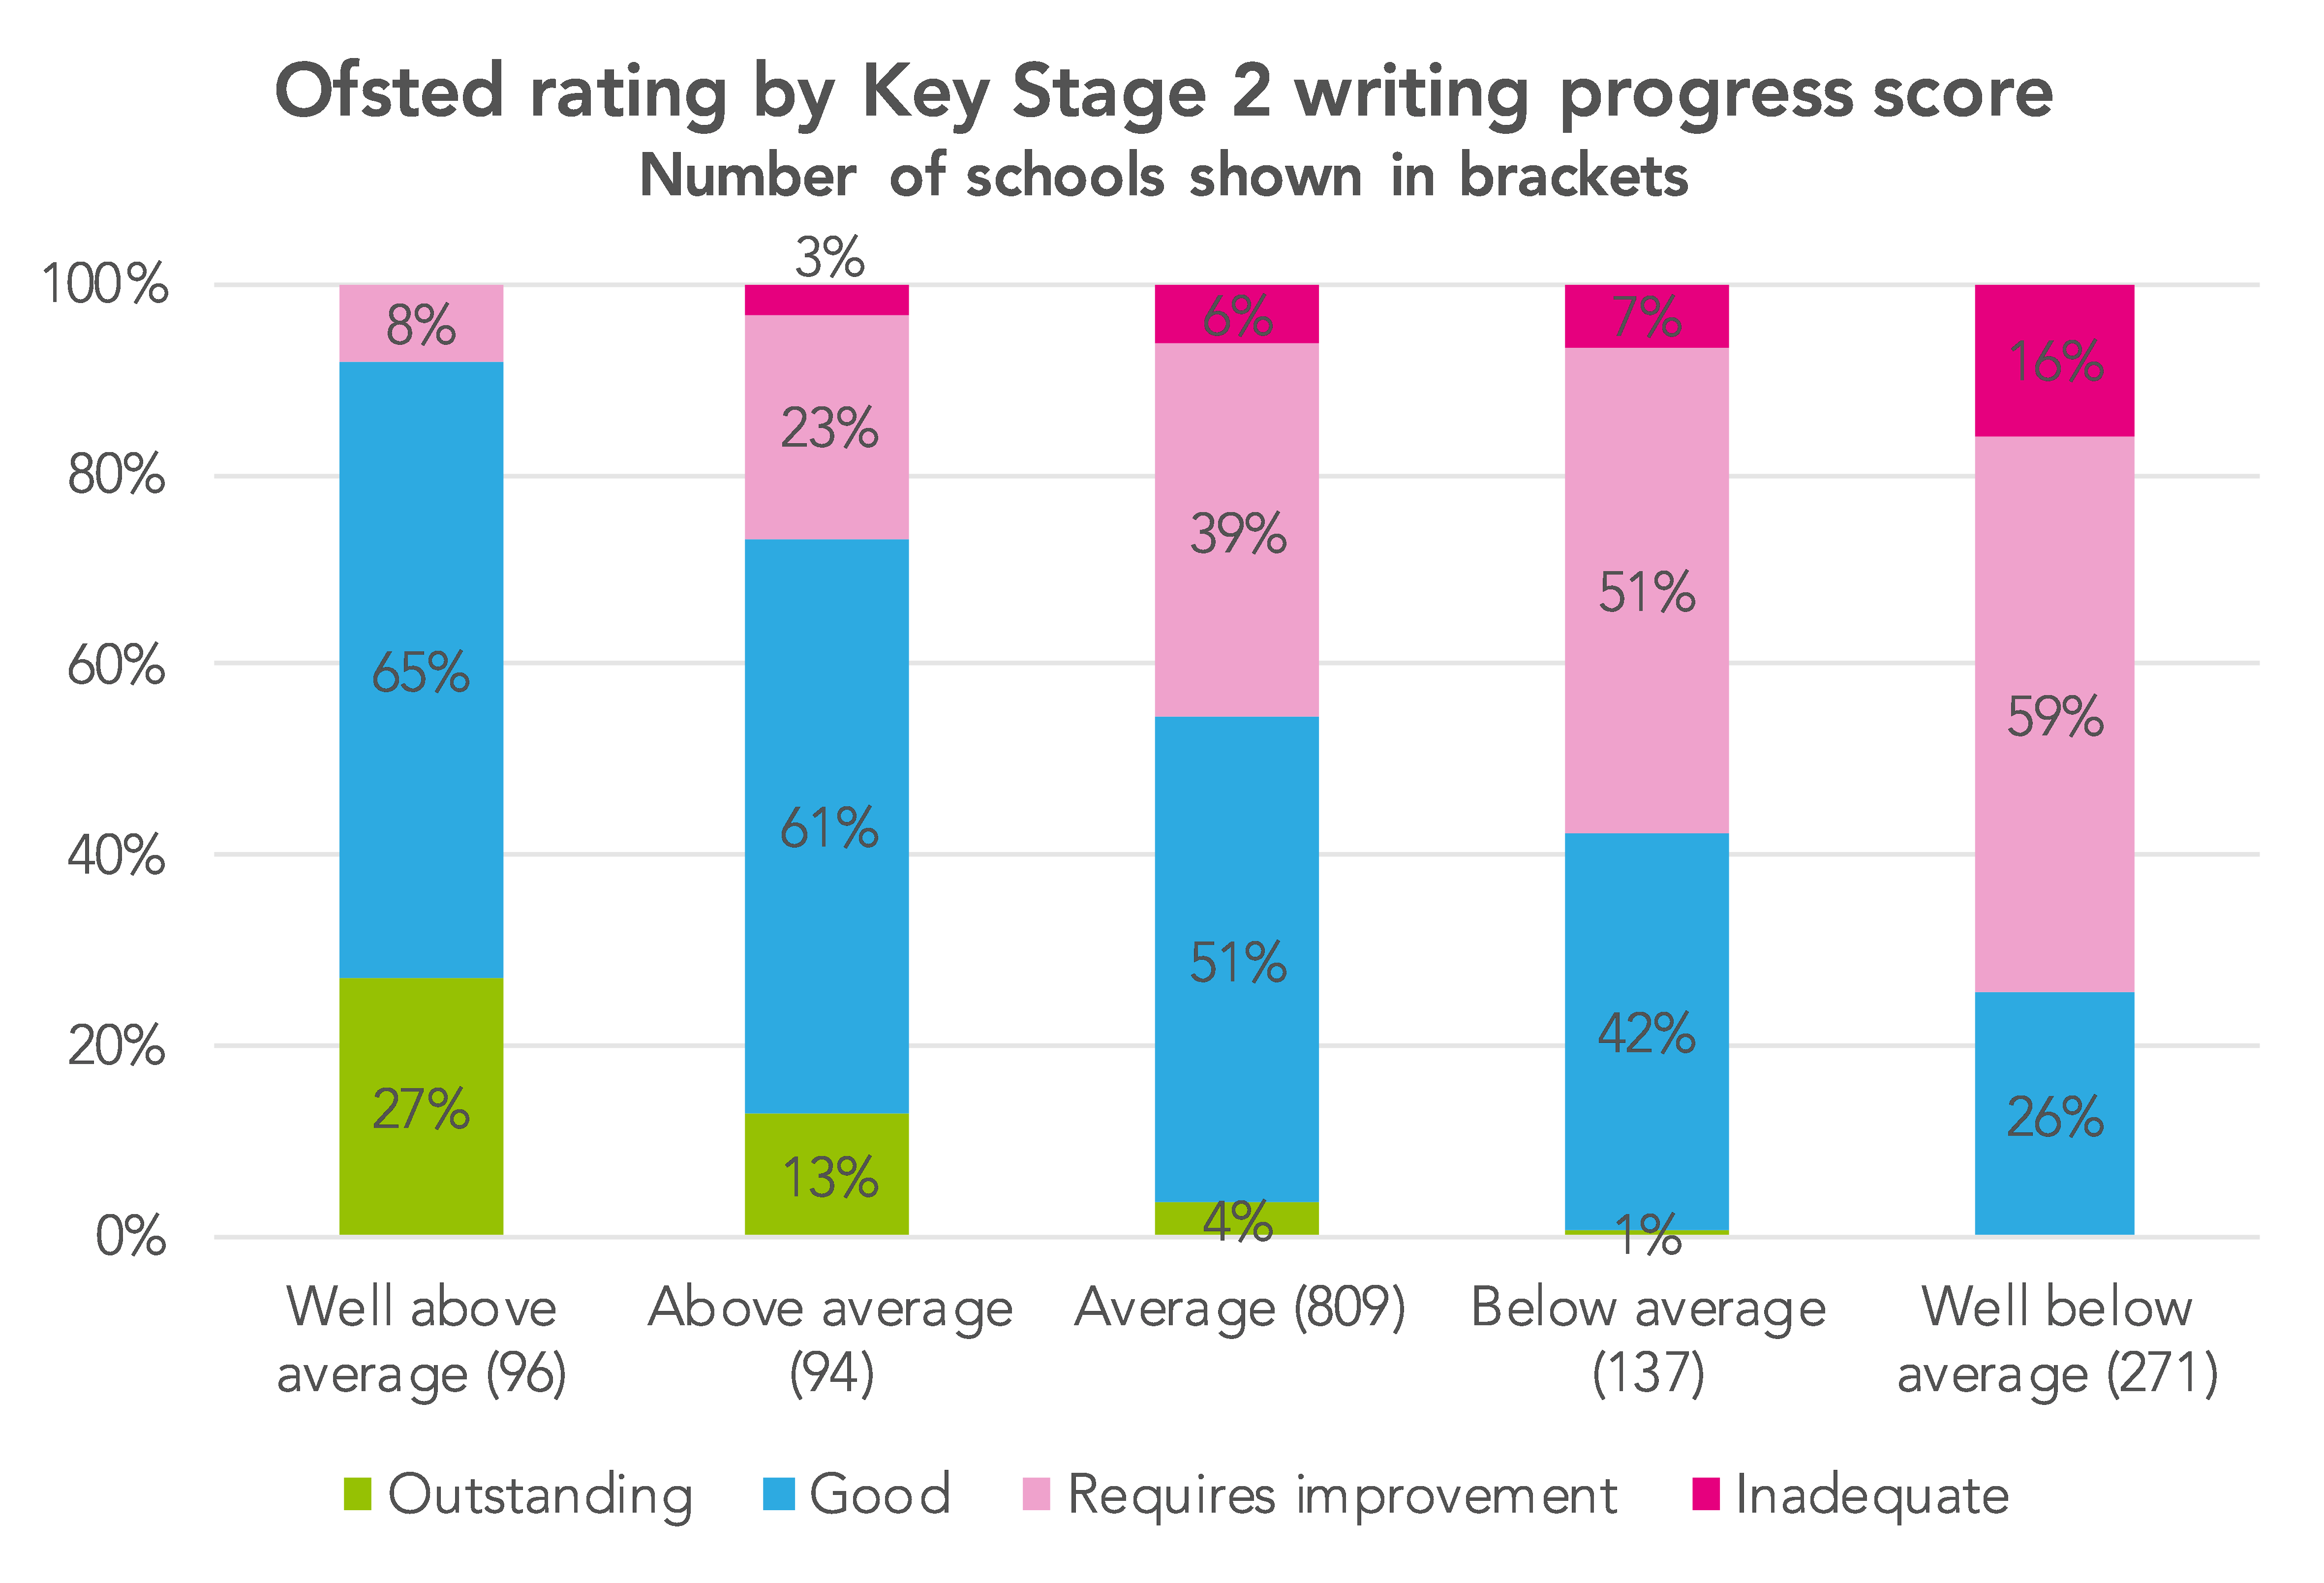
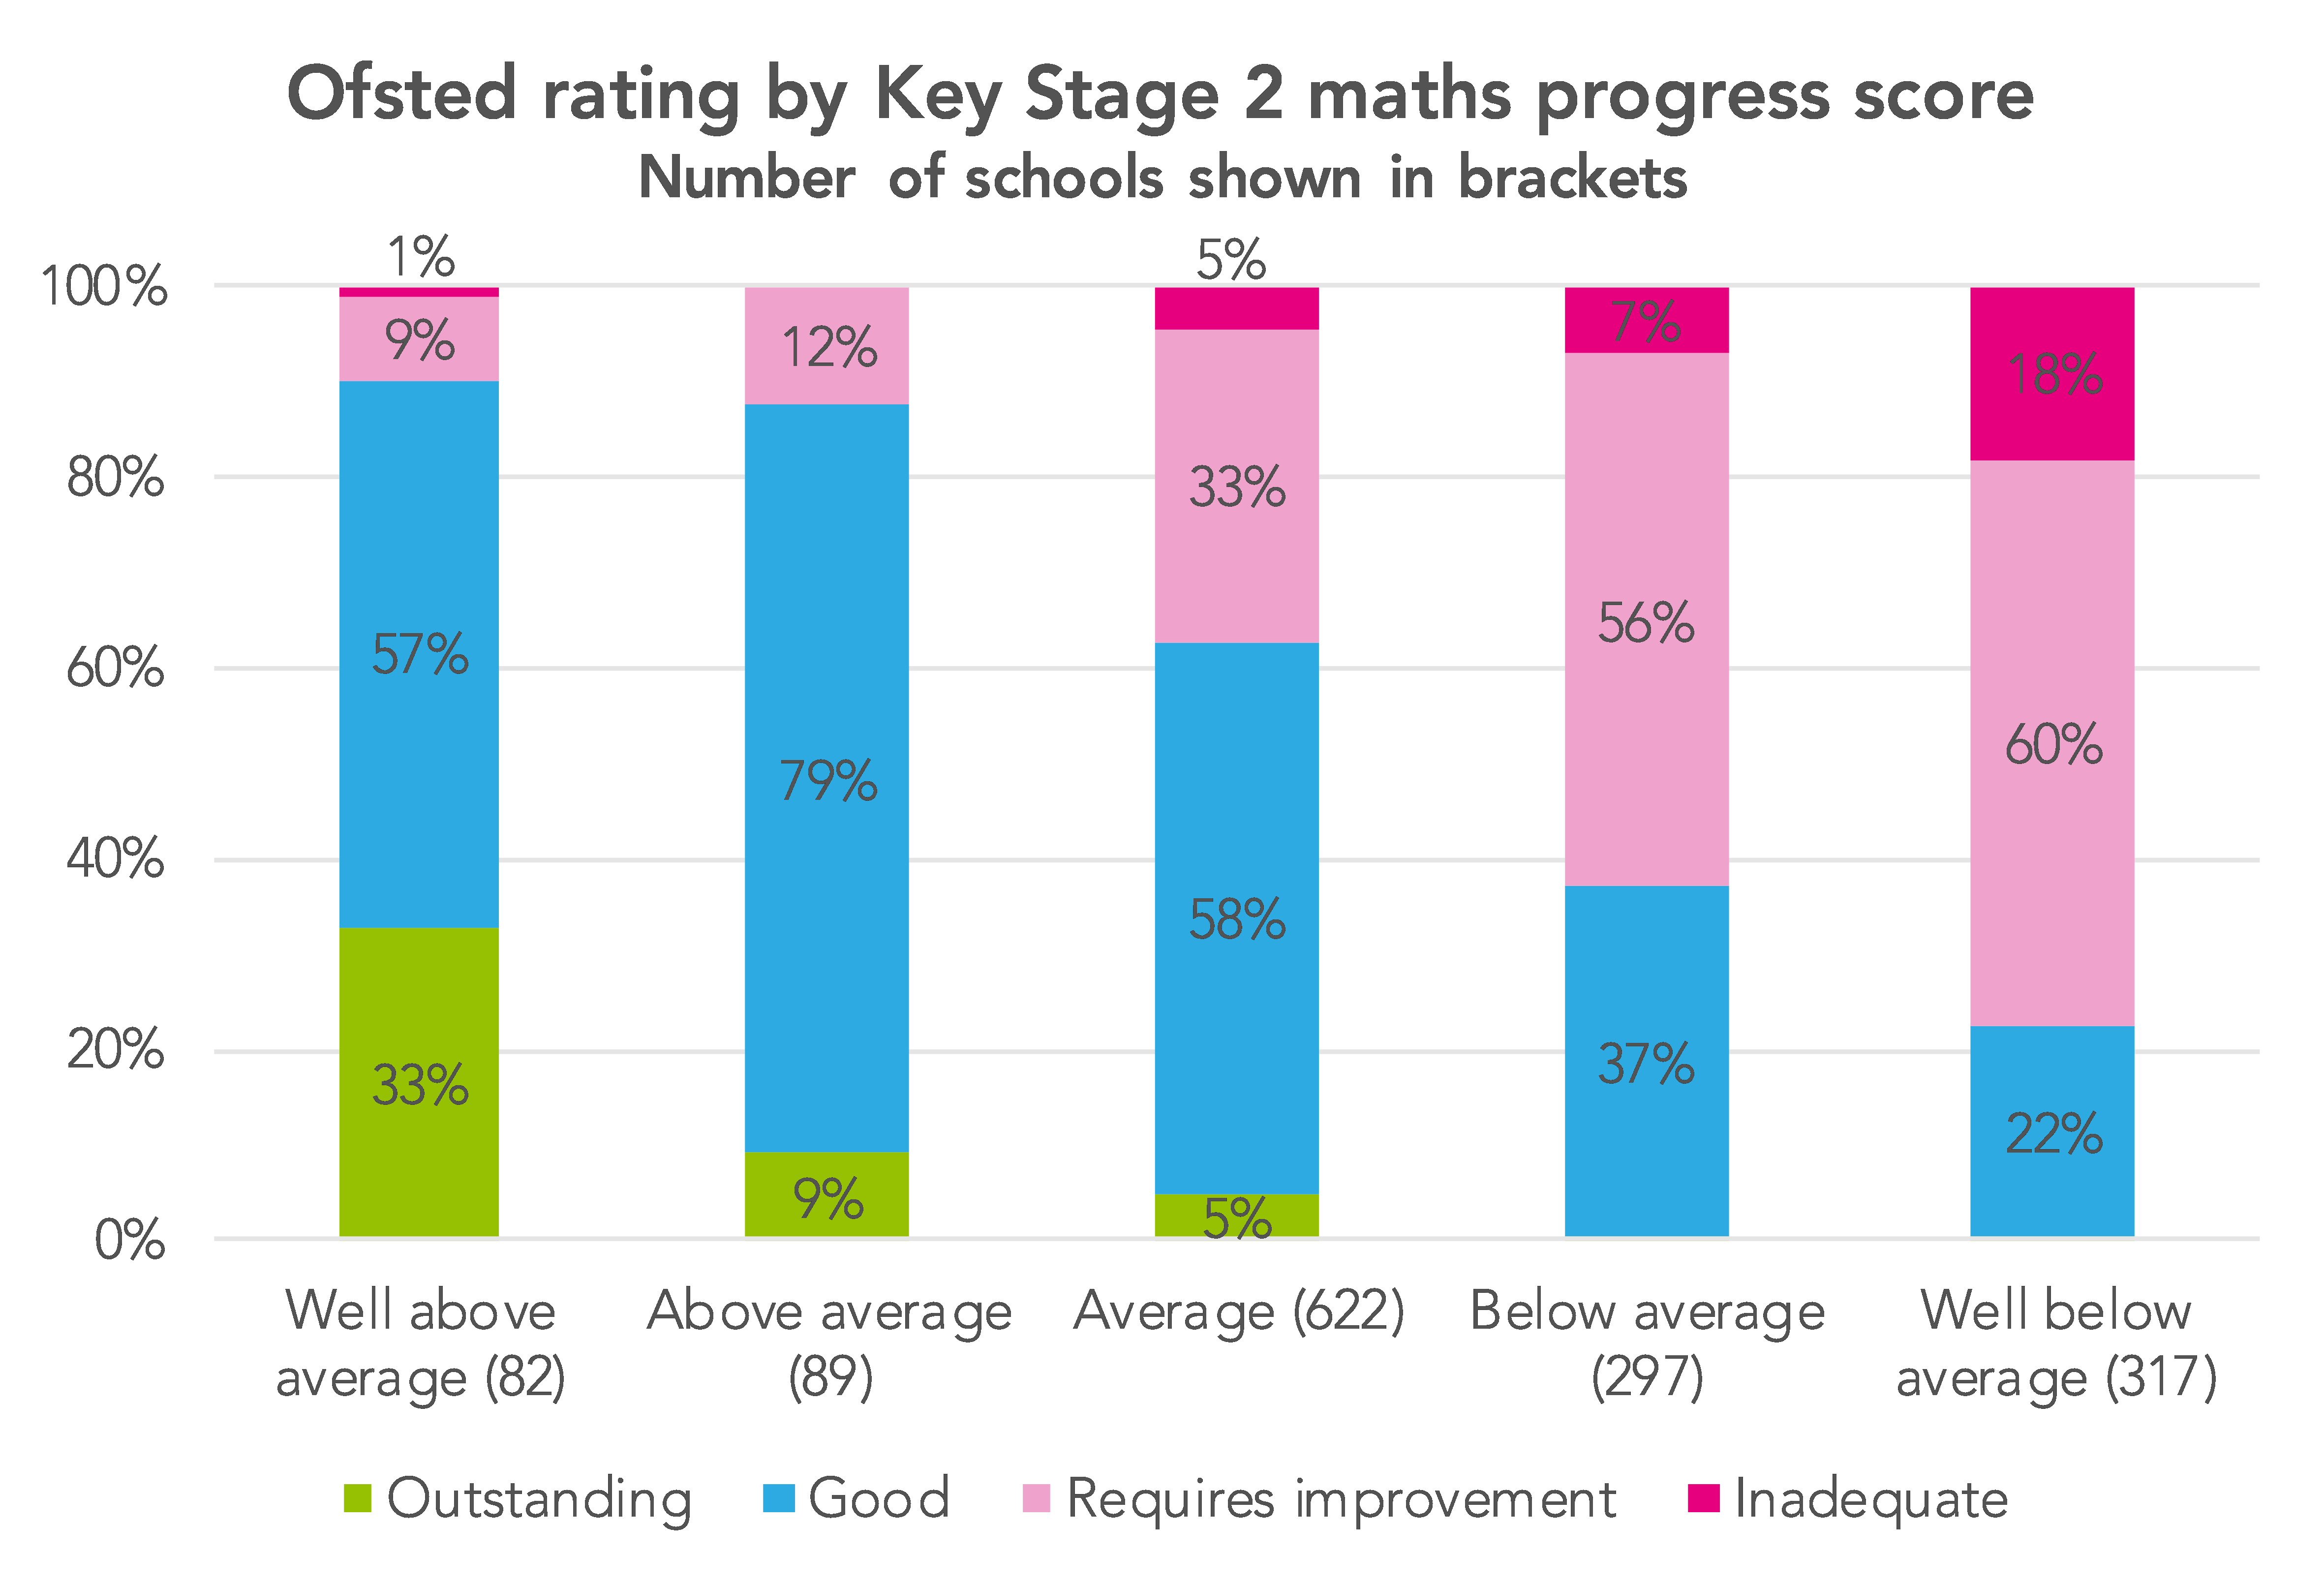
What’s clear is that there is a strong relationship between progress scores and inspection ratings: schools with ‘well below average’ progress scores are some way more likely to end up with inadequate inspection ratings, for example.
But, at the same time, of the 67 primary schools judged to be outstanding, 26 – more than a third – were not ‘well above average’ in reading, writing or maths, as the table below shows.
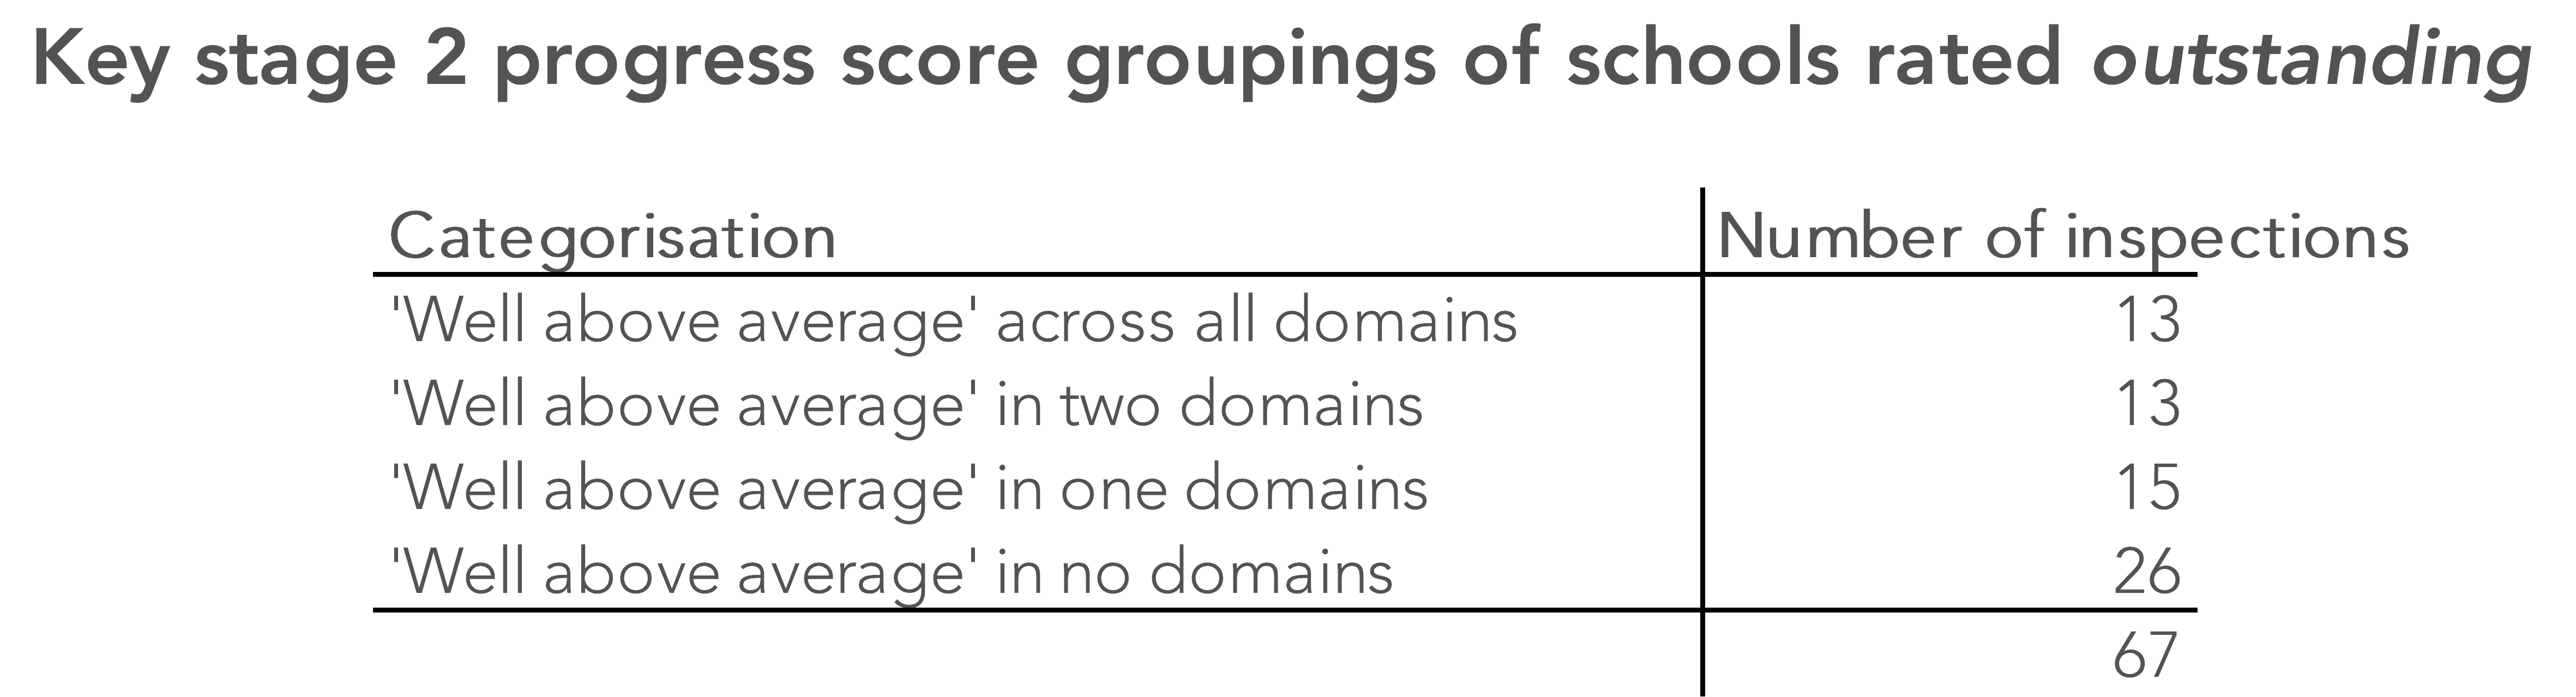
In fact, four of the schools rated outstanding had ‘below average’ progress scores in one or more of the three domains.
A new framework
Ofsted is developing a new inspection framework for September 2019, which we’re told will seek to rebalance the weight of the curriculum and performance data in inspection. However, as Ofsted’s chief inspector, Amanda Spielman, said at the recent Schools NorthEast conference, “that doesn’t mean there will be no link between what we find about the quality of education, and what the published data says”.
This is a helpful reminder that, despite the narrative around the new framework, Ofsted argues that it will be evolution rather than revolution. While the links between KS2 outcomes and Ofsted grades that our analysis identifies may be expected to shift a little, it is unrealistic, and arguably undesirable, for the data baby to be thrown out entirely with the framework bathwater.
Without sight of the detail underpinning the new framework it is difficult to offer more than a tentative view on Ofsted’s direction of travel. But it seems primary schools are already being encouraged to increase their focus on curriculum. For example, this year – under the existing framework – inspectors are already talking to schools about the ‘intent’, ‘implementation’ and ‘impact’ of their curriculum.
Whatever form the next framework takes, it will be important to monitor its impact. Even with what appears to be some support for Ofsted’s direction of travel, few in the system will want to see significant volatility in inspection outcomes. We’ll be keeping a close watch on what happens.
ASCL and Oxford University Press are holding a Primary Literacy Conference in Birmingham on 30th January 2019, at which we hope to hear from an Ofsted speaker. More details are available here.
Want to stay up-to-date with the latest research from FFT Education Datalab? Follow us on Twitter to get all of our research as it comes out.
- All data used in this post relates to mainstream, state-funded schools with reading, writing and maths progress scores in 2017.
Inspections are included if they took place between 1 September 2017 and 31 August 2018, with the inspection report published by 31 August 2018.
Data sources are Ofsted management information data files (giving inspection data as at 30 September 2017-31 August 2018) and final Key Stage KS2 performance tables for 2016/17.
- In 2017, these were as follows [PDF]:
- reading
- well above average (progress score of +3.4 or higher; lower confidence interval is higher than 0);
- above average (progress score of between 0 and +3.4; lower confidence interval is higher than 0);
- average (lower confidence interval is 0 or lower; upper confidence interval is 0 or higher);
- below average (progress score of between -3.1 and 0; upper confidence interval is lower than 0); or
- well below average (progress score of -3.1 or lower; upper confidence interval is lower than 0)
- writing
- well above average (progress score of +3.0 or higher; lower confidence interval is higher than 0);
- above average (progress score of between 0 and +3.0; lower confidence interval is higher than 0);
- average (lower confidence interval is 0 or lower; upper confidence interval is 0 or higher);
- below average (progress score of between -2.9 and 0; upper confidence interval is lower than 0); or
- well below average (progress score of -2.9 or lower; upper confidence interval is lower than 0)
- maths
- well above average (progress score of +3.4 or higher; lower confidence interval is higher than 0);
- above average (progress score of between 0 and +3.4; lower confidence interval is higher than 0);
- average (lower confidence interval is 0 or lower; upper confidence interval is 0 or higher);
- below average (progress score of between -3.4 and 0; upper confidence interval is lower than 0); or
- well below average (progress score of -3.4 or lower; upper confidence interval is lower than 0)


Absolutely fascinating data.
I also wonder how many inspection exempt “outstanding” primary schools are flying under the radar despite not being “well above average” or having “below average” progress scores?
Does the OFSTED risk assessment algorithm identify such schools and trigger a short inspection?
Having looked at the performance data for 2017-18, I reckon there are over 550 “Outstanding” primary schools that had progress scores of either “Below Average” or “Well Below Average” in at least one of the three domains (reading, writing, maths).
I have also counted 148 “Outstanding” primary schools that had progress scores of either “Below Average” or “Well Below Average” in ALL THREE domains.