Update 11:40, 11 October 2018: This post was updated to make clear that Progress 8 scores used in this analysis are those for 2017.
This is a joint blogpost from FFT Education Datalab and the Association of School and College Leaders (ASCL).
A year ago, we looked at the relationship between Ofsted ratings and Progress 8 scores in the 2016/17 school year.
With a new inspection framework on the horizon expected to change the amount of emphasis placed on exam results in an inspection (£), we thought we’d look at what happened on the ground in 2017/18.
How many inspections were there?
The first thing to say is that there were slightly more secondary school inspections carried out last year than in the previous year – 834 in 2017/18, versus 804 in 2016/17. (Specifically, here we’ve counted full, section 5 inspections and short, section 8 inspections of mainstream secondaries that had Progress 8 scores.)[1]
Last year also saw a change in how short inspections operate – some schools with good overall effectiveness ratings no longer receive short inspections, and short inspections no longer convert to full inspections in most cases. Full details are given in the box below.
How have short inspections changed?
For mainstream schools, short inspections are one-day inspections for those with good ratings.
Ofsted’s approach changed during the 2017/2018 academic year. Previously, mainstream schools that had a good rating would receive a short, one-day inspection, instead of a full inspection. This converted to a full inspection in those cases where Ofsted suspected that the school had either improved, or declined – and, if not, the good rating would be confirmed.
Now, however, a certain proportion of schools with good ratings receive full inspections from the outset, where pre-inspection evidence suggests the inspection is highly likely to convert. And, short inspections generally no longer convert to full inspections – rather, the school’s next inspection (usually 1-2 years later) becomes a full inspection in those cases where Ofsted believes an inspection rating other than good is likely to be warranted.[2]
This change led to fewer short inspections being carried out last year – 387, versus 441 in 2016/17 – and, as we’d expect, the number of short inspections converting to full inspection status dropped sharply, from 164 to 54.
Overall, the total number of full inspections (either full from the outset, or short inspections that converted) was a little lower last year than in 2016/17 – 501 versus 527.
A health warning
Before looking at the relationship between Progress 8 scores and inspection ratings in 2017/18, first a health warning.
We would strongly advise against trying to compare figures reported here with those from the blogpost we wrote last year. That’s for two reasons. Firstly, because a change in the points which each GCSE grade is considered to be worth means that 2016 P8 scores aren’t comparable with 2017 P8 scores. And the change in how short inspections work also affects comparability.
Progress 8 scores
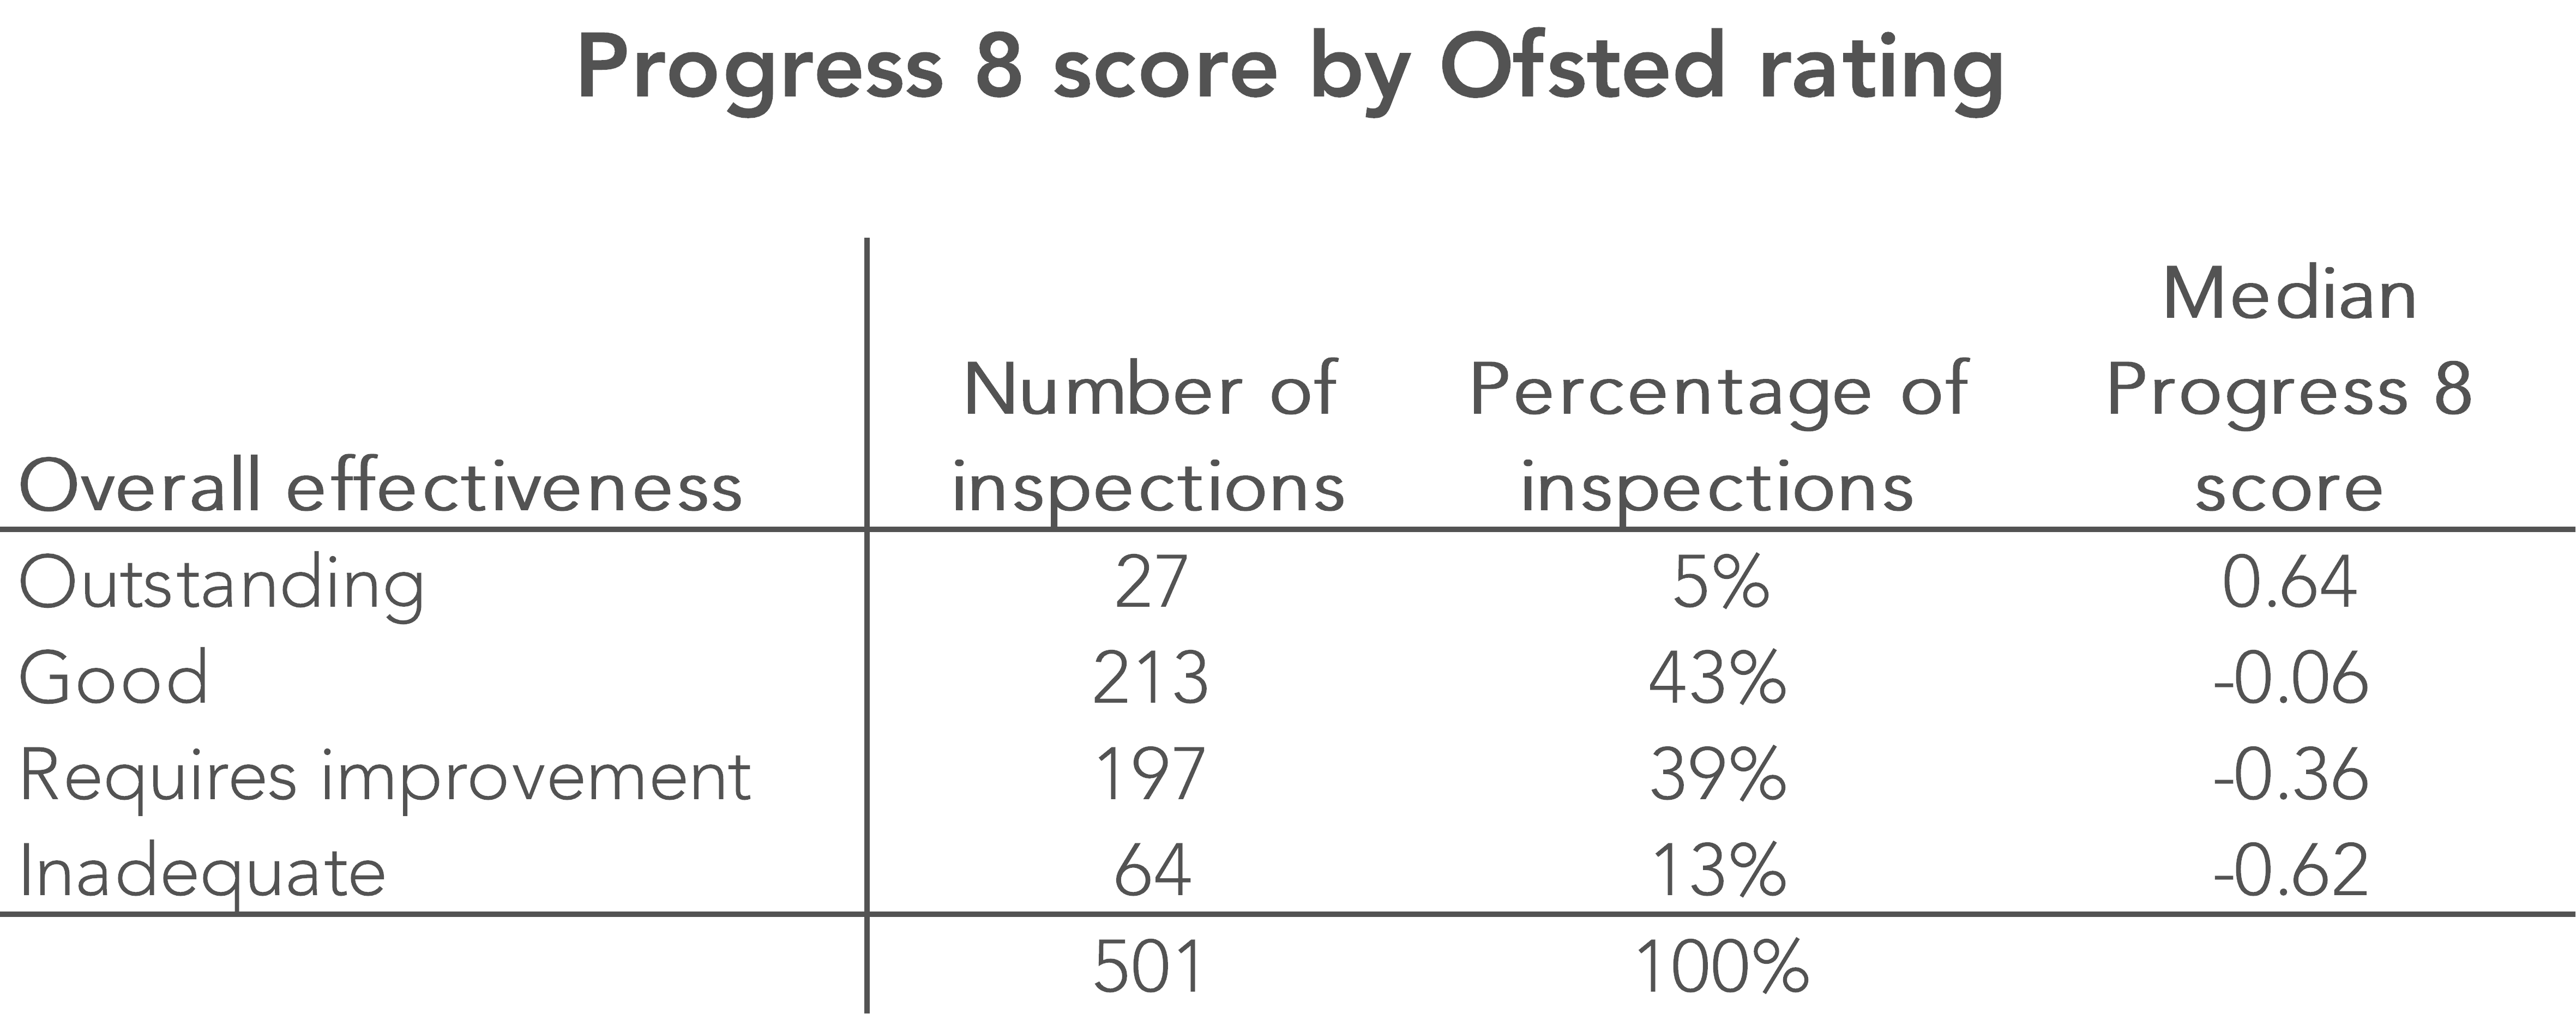
The average 2017 Progress 8 score of the 501 schools that received a full inspection (either full from the outset, or a short inspection that converted) in 2017/18 was -0.21.[3] It is worth emphasising here that, because we’re not looking at short inspections that did not convert, we’re excluding the majority of schools that started off with a good inspection rating.
The table below shows the mix of overall effectiveness ratings awarded, together with the median P8 score for each grade.
Looking at things another way, the chart below groups schools into the P8 categories used in the Department for Education’s league tables.[4]
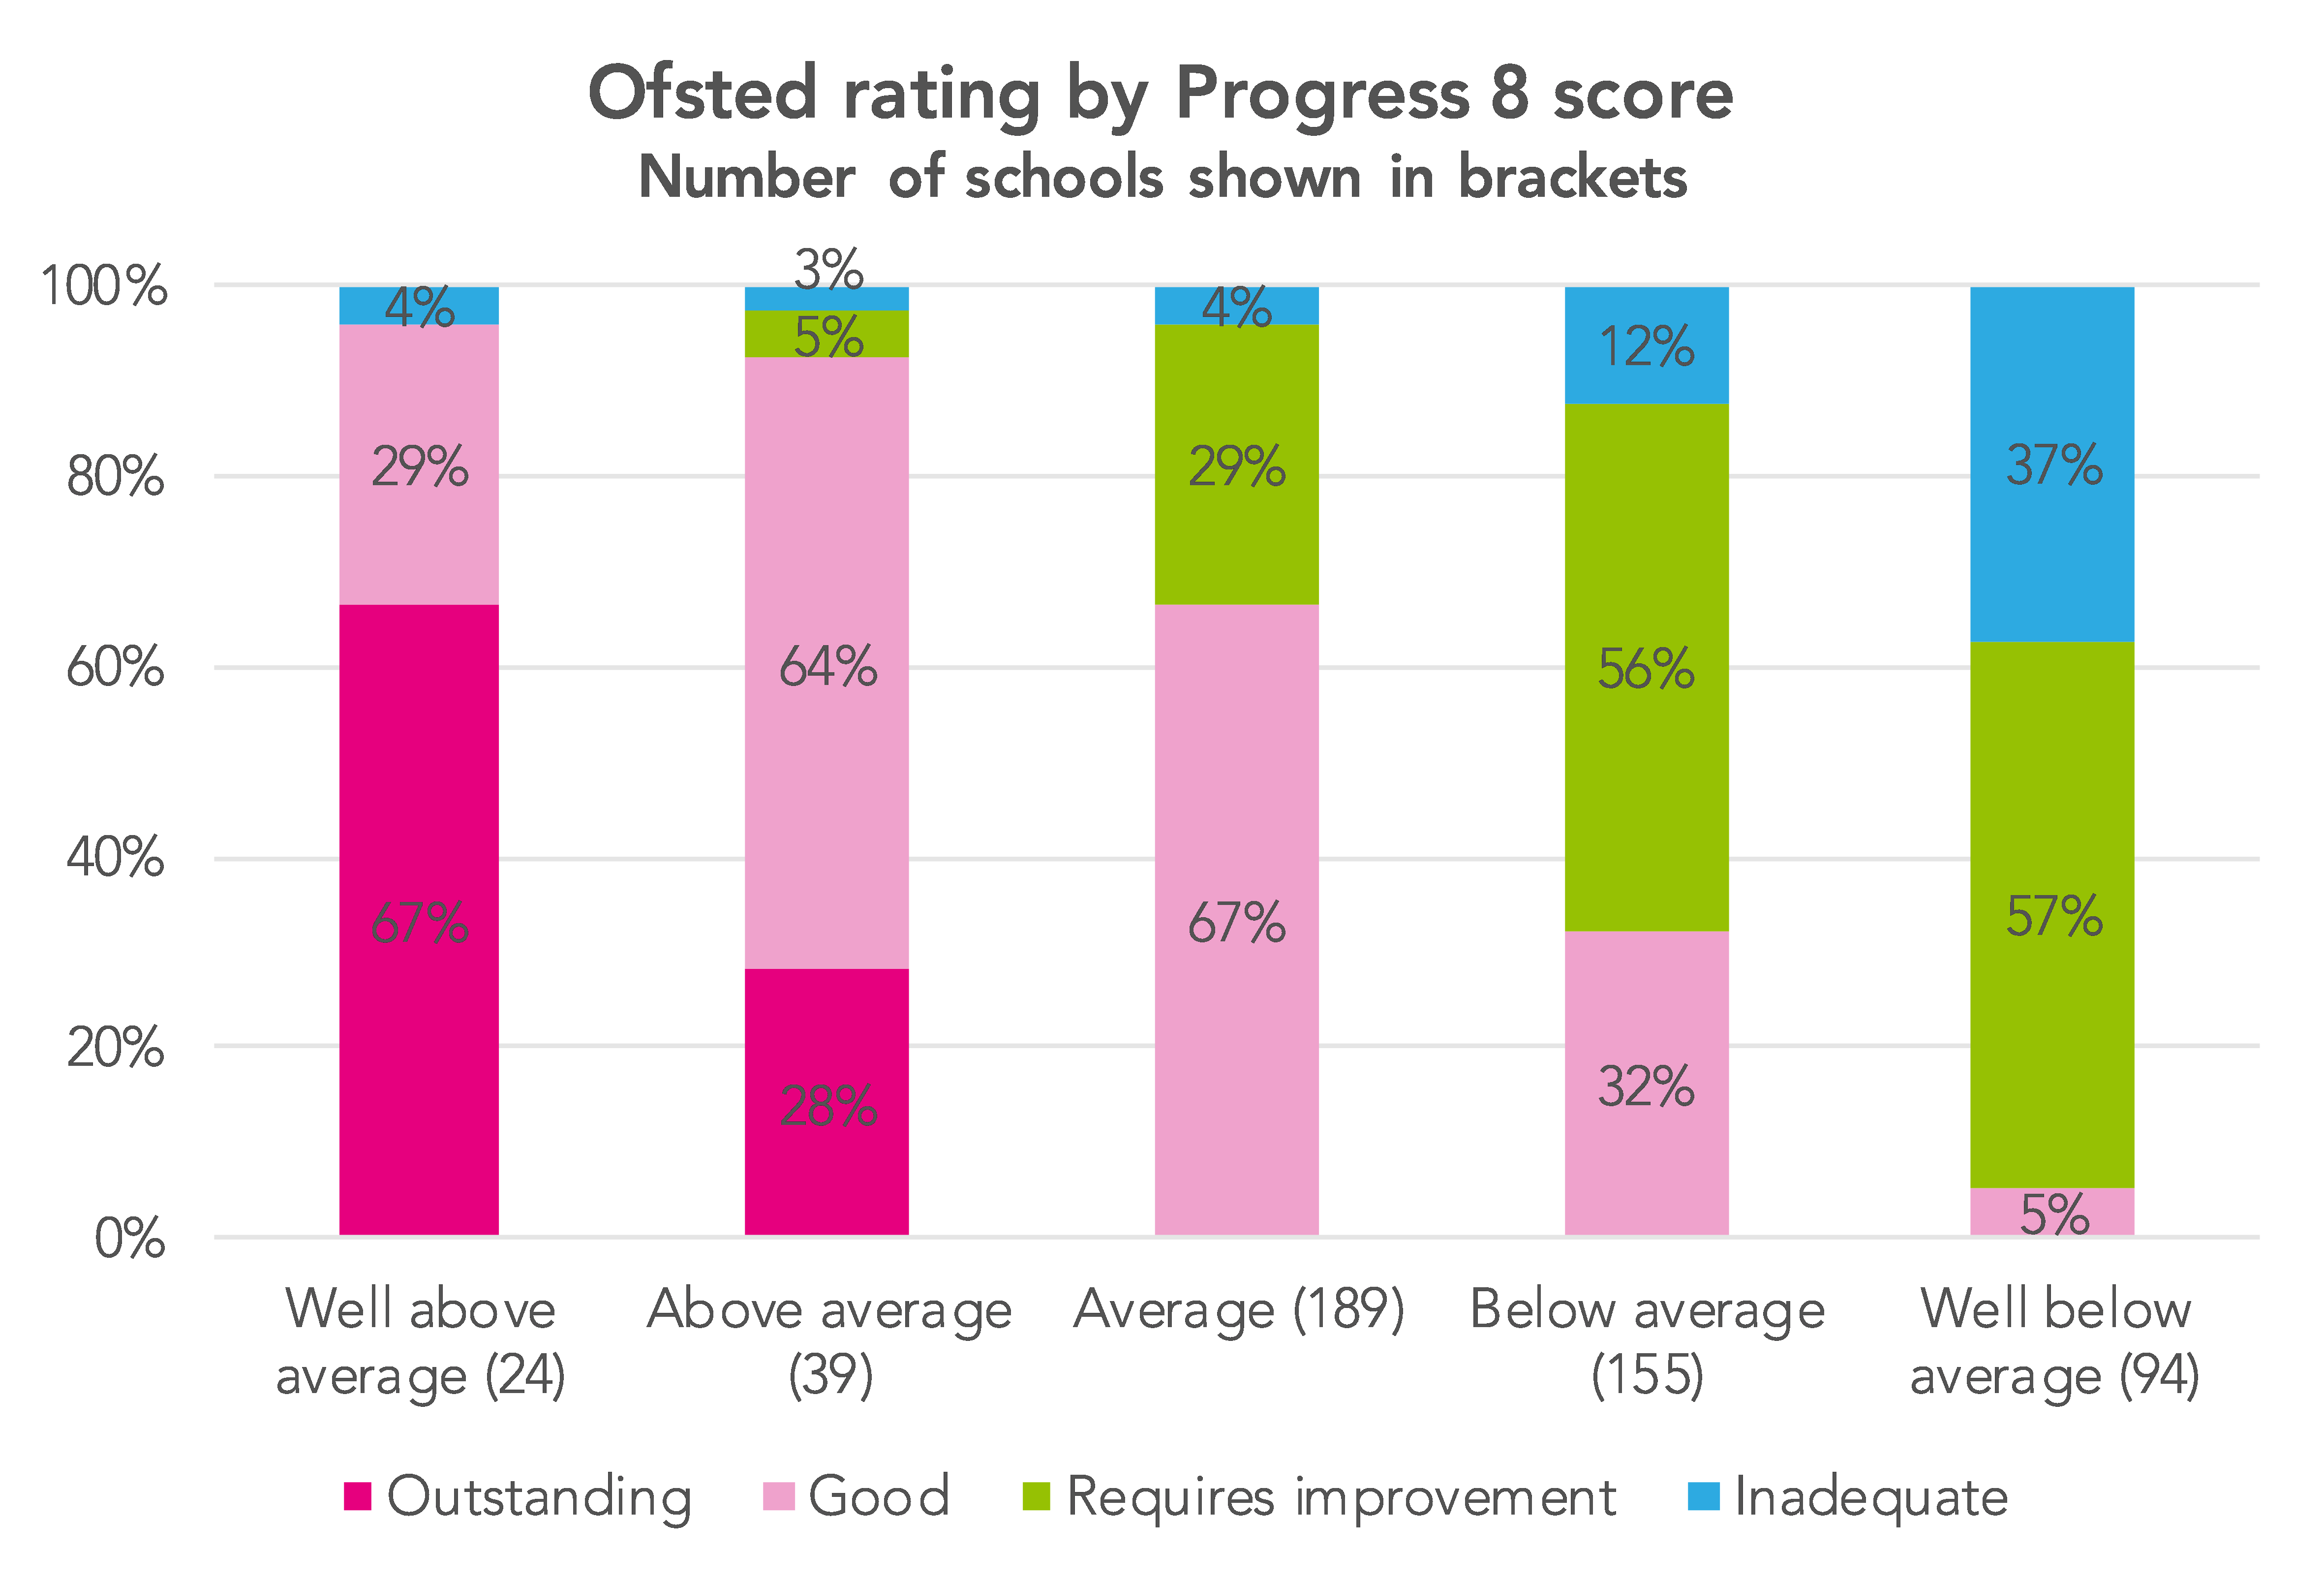
So – as we saw last year – there is a strong relationship between P8 scores and inspection ratings.
It seems to be the case that those with average P8 scores (per the DfE definition) won’t get outstanding ratings, for example, bar very exceptional cases.
A new framework
What does this all mean?
Ofsted is developing a new framework for September 2019, which we’re told will seek to rebalance the weight of the curriculum and performance data in inspection. This is something that Ofsted’s chief inspector, Amanda Spielman, has spoken about, saying in a speech in June that “inspection and performance tables should complement rather than intensify one another”.
Our analysis suggests historical data is still a key determining factor in inspections. However, there is evidence of Ofsted’s intention to change inspectors’ relationship with data: the latest inspection update included the following line:
[inspectors should] avoid over-focusing on detailed data, including data for groups or subgroups of pupils and move beyond the data as quickly as possible to ascertain how well the curriculum is being taught
What does this mean for schools that are inspected this year?
‘Moving beyond’ data does not mean inspectors will ignore data like Progress 8.
In 2018/19 schools will still be inspected under the same framework that’s been in place since 2015, so it’s unrealistic (and undesirable?) to expect Progress 8 data to be disregarded.
But, the increased focus on curriculum does give schools and inspectors another lens through which to explore how well pupils are making progress.
Want to stay up-to-date with the latest research from FFT Education Datalab? Follow us on Twitter to get all of our research as it comes out.
1. All data used in this post relates to mainstream, state-funded schools with a Progress 8 score in the relevant year (mainstream defined here as not including university technical colleges and studio schools).
Inspections are included if they took place between 1 September 2017 and 31 August 2018, with the inspection report published by 31 August 2018.
Data sources are Ofsted management information data files (giving inspection data as at 30 September 2017-31 August 2018) and 2016/17 final Key Stage KS4 performance tables.
2. As an aside, it’s worth noting that Ofsted’s decision to carry out a full inspection does not pre-determine the outcome. Among those starting out with a good rating, a full inspection resulted in around half of the schools retaining a good or better rating.
3. In cases where the inspection happened right at the start of the school year, in some cases the 2017 P8 score will not have been known at the time the inspection took place.
4. These are:
- well above average (P8 of +0.5 or higher; lower confidence interval is higher than 0);
- above average (P8 of between 0 and +0.5; lower confidence interval is higher than 0);
- average (lower confidence interval is 0 or lower; upper confidence interval is 0 or higher);
- below average (P8 of -0.5 to 0; upper confidence interval is lower than 0); or
- well below average (P8 below -0.5; upper confidence interval is lower than 0).


Interesting and very helpful. Is there a similar exercise that could be undertaken for Primary Schools using the end of KS2 progress measure?
Thanks, Jim. Good idea – will look to do something on that soon.