I’m not normally inclined to say “I told you so” but, in this case, it might be justified.
Back in 2015, when the Department for Education announced the scores for old style GCSEs in 2017, Dave Thomson and I did some calculations to look at ‘what if’ the DfE 2016 and 2017 scoring systems were applied to 2014 data.
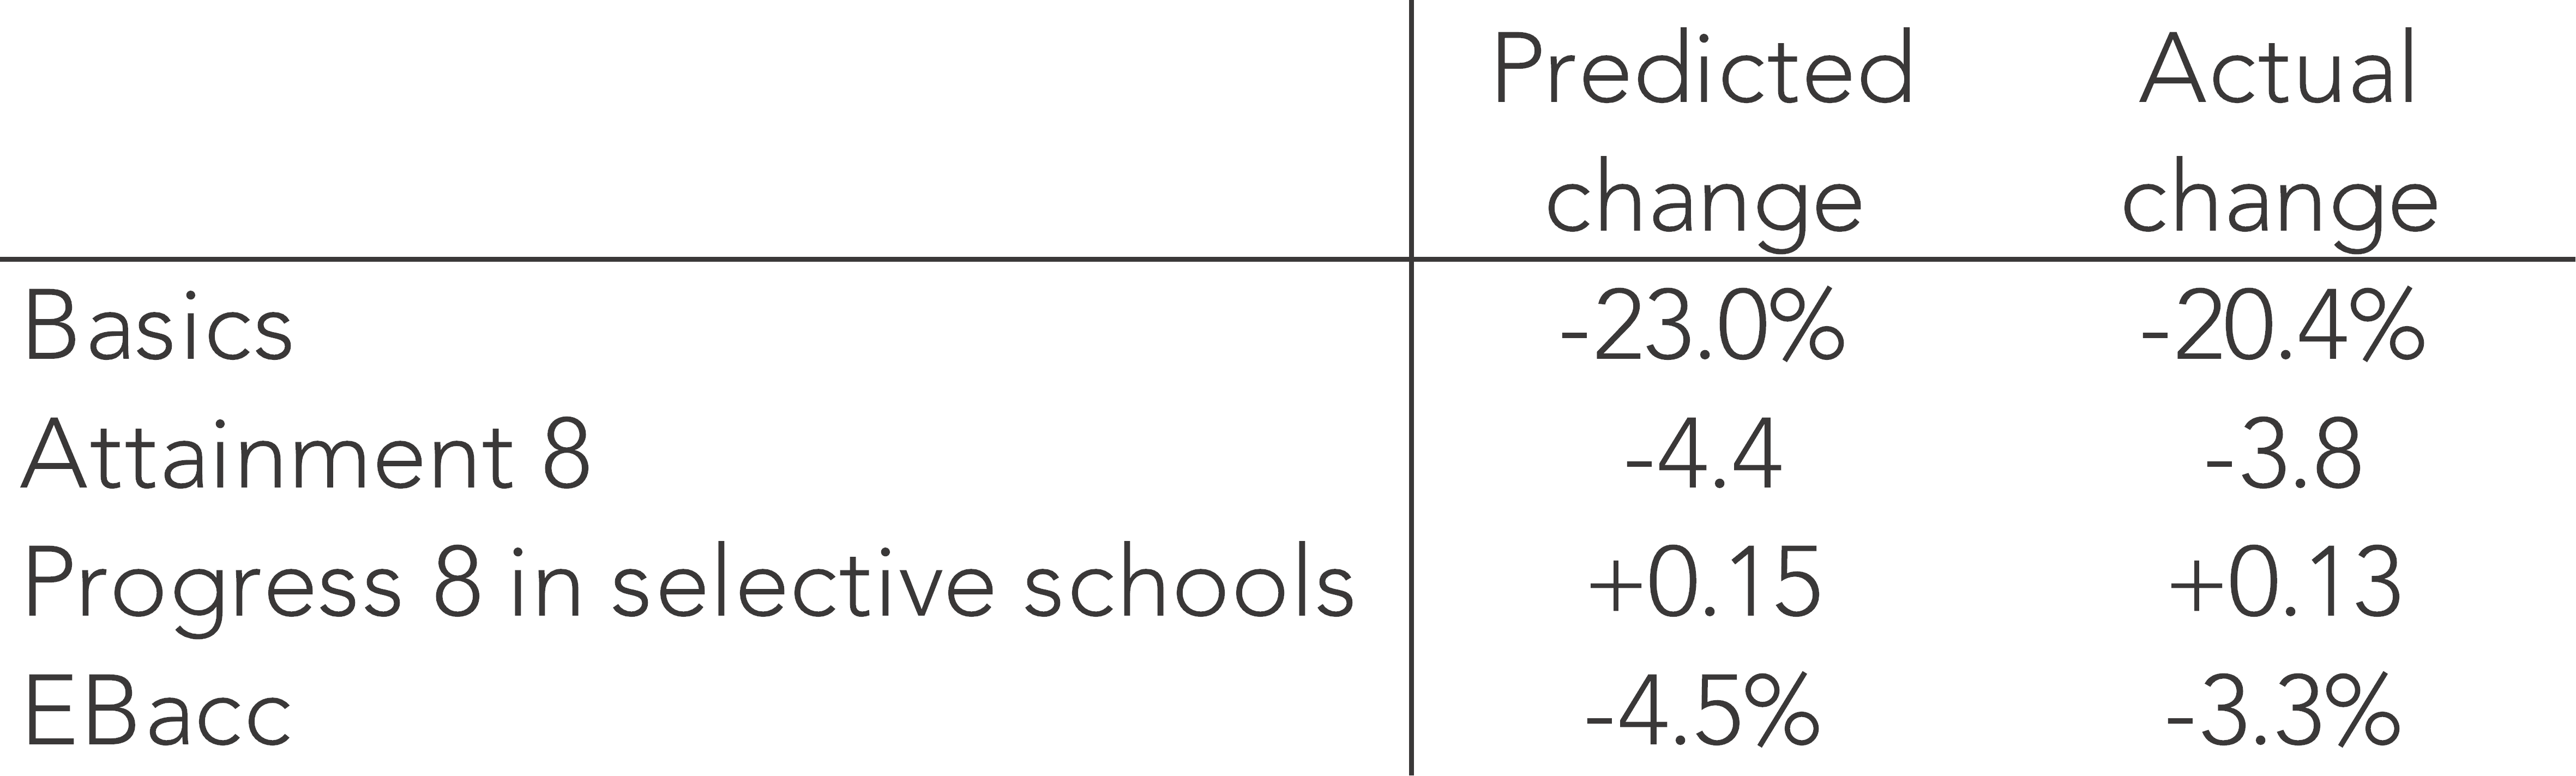
We predicted that, when compared to 2016, outcomes in 2017 would show:
- substantially lower attainment in the basics measure (English and mathematics);
- lower Attainment 8 scores;
- higher Progress 8 for selective schools;
- lower EBacc attainment.
Some of these changes – basics and EBacc – are because the measure changes from grade C or higher to grade 5 or higher. Changes in Attainment 8 and Progress 8 arise because top grades are, relative to other grades, given more points in 2017 than in 2016.
This table summarises what we found – and compares it with the actual outcomes published by DfE.
So how can schools compare their Progress 8 score in 2017 with what it was in 2016?
If a selective school sees an increase of 0.1 in their Progress 8 score, have they improved – or have they got worse because they have gone up less than the average for selective schools?
And what about other schools? If selective schools have gone up, then, because Progress 8 has a national average of zero, other schools must have gone down.
To look at this further, let’s revisit some of our previous analysis of 2016 data – specifically schools’ Progress 8 scores calculated using:
- the 2016 points system; and
- the 2017 points system.
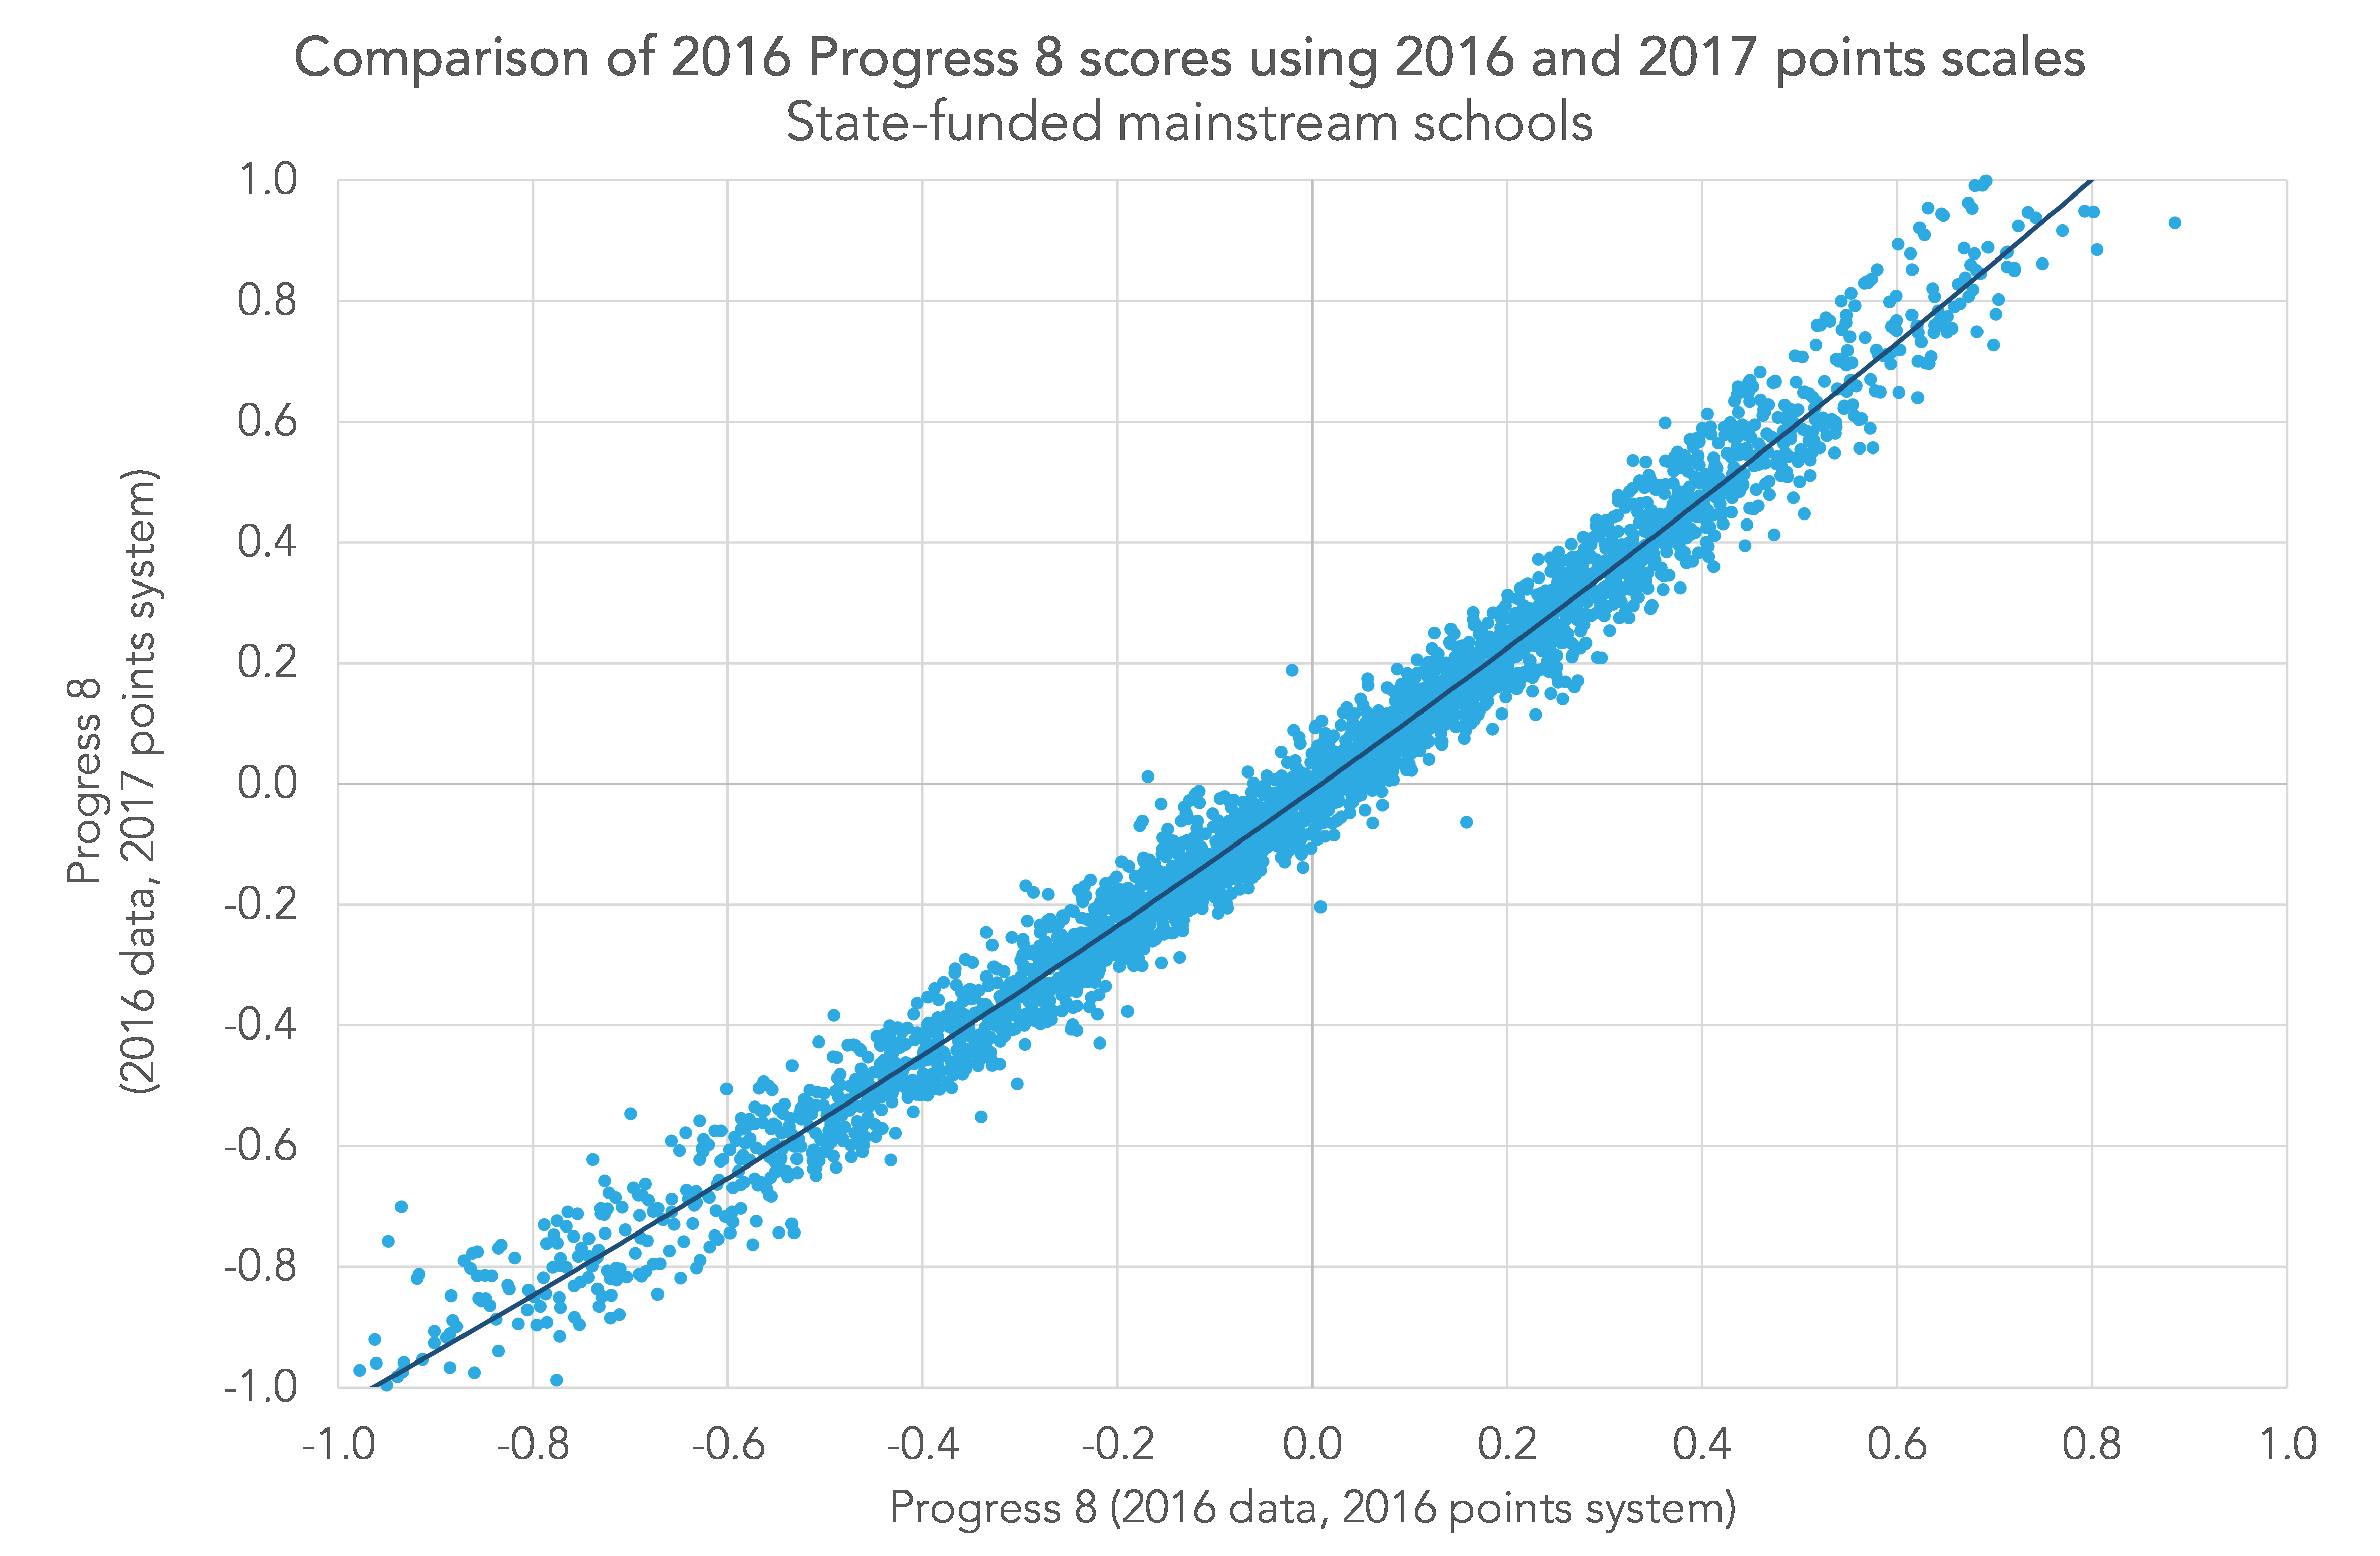
Whilst there’s a little bit of ‘scatter’ around the best fit line, it’s fairly small, so we can use the line to calculate differences. The next chart shows the difference – by how much Progress 8 would increase or decrease – using the 2017 scoring system.
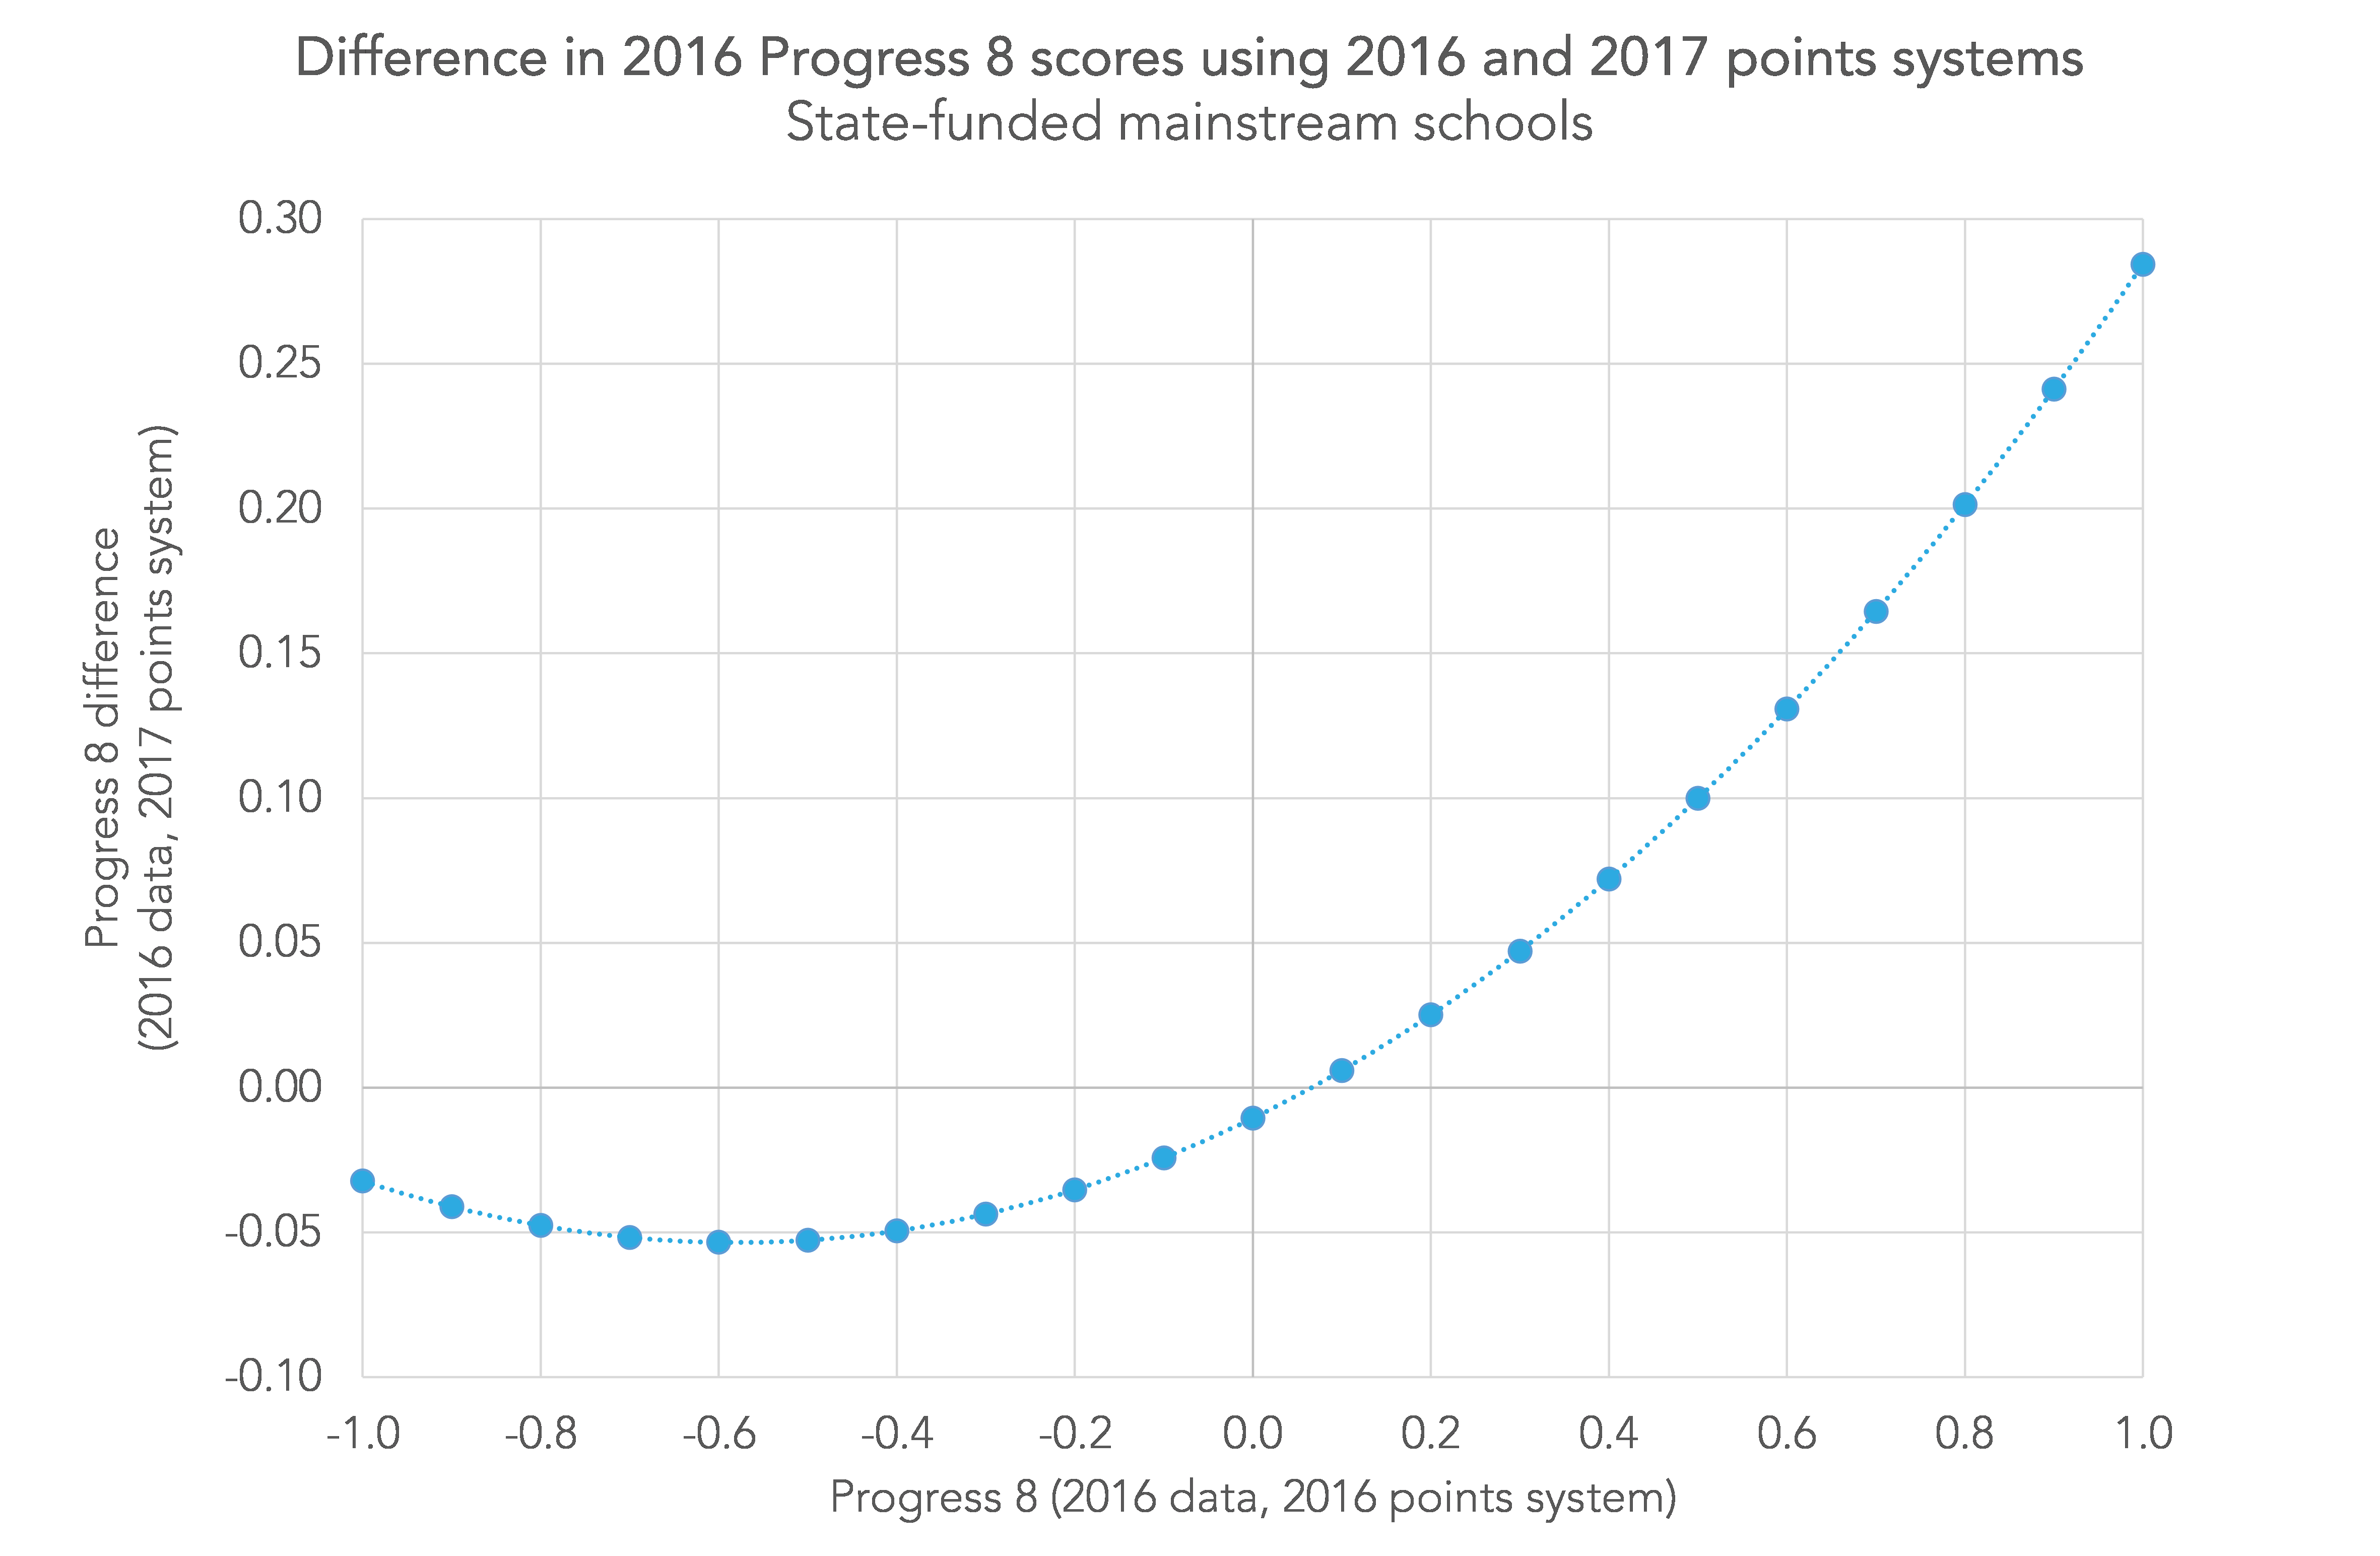
The drop for schools with low Progress 8 scores puts more schools below the floor standard. Dave has looked at this in detail here.
If a school’s Progress 8 score improved from 2016 to 2017 this could be because:
- pupils attained better grades and/or had better value added in individual subjects;
- pupils entered, on average, more subjects that count in Attainment 8;
- the school stayed the same, but the 2017 scoring system changed things.
It’s difficult to disentangle these. Understanding the contribution made by changes in subject value added and number of subject entries requires detailed analysis – but the chart above might help to answer the third question.
Want to stay up-to-date with the latest research from Education Datalab? Sign up to our mailing list to get notifications about new blogposts, or to receive our half-termly newsletter.


Thanks for this post Mike. I am sure I am not alone appreciating the work you do at edulab in helping us to make sense of our data in such a turbulent climate. It is really interesting yet also quite baffling trying to apply this to our analysis of the Progress 8 scores this year. I know that it is not mentioned in this article but is it correct to assume that the A8 estimates for 2018 are also likely to drop?