This is a joint blogpost from Education Datalab and the Association of School and College Leaders (ASCL).
This post was updated on 16 October 2017. The cut-off date for inclusion in this analysis was originally stated as 30 June 2017, based on an earlier draft of this analysis, when it should have been given as 31 August 2017.
Last year was the first year with a set of new headline measures on which the performance of secondary schools would be judged.
Chief among them is Progress 8 – which looks at the amount of progress a child makes while at secondary school compared to children who were at the same starting place.
But if half of secondary school accountability is school performance tables (colloquially, league tables) and the thresholds that the Department for Education sets for what is considered acceptable performance, the other half is the process of inspections carried out by Ofsted.
So we might wonder: how do these two halves fit together? What is the relationship between Progress 8 scores that schools received last year, and inspection outcomes for schools inspected in the months since?
A look at the data
Secondary schools received their unvalidated P8 scores the week beginning 26 September 2016 last year, so, while some inspectors will not have engaged with this data on the grounds that it was not yet published in Ofsted’s inspection dashboards, this represents the date when inspections could first have begun to take account of this data.
We can therefore compare these P8 scores to the outcomes of inspections that have taken place in the intervening period – between 26 September 2016 and 31 August 2017.[1].
Short inspections
Let’s look briefly first at short inspections – the inspections which schools rated good at their most recent inspection receive.
During the period under consideration, 407 schools received such inspections.
A total of 154 of these short inspections converted to full, section 5 inspections, with the remainder seeing schools’ good judgements confirmed.
The average P8 score of a school whose short inspection converted was -0.08, versus 0.08 for those schools whose short inspection did not convert. (Practically this isn’t a huge difference – the difference of 0.16 translates into pupils doing an average of around one and a half grades better across 10 subject slots. And that’s across the 10 subject slots, not per subject slot).
And of those short inspections that converted, the most common outcome was to receive an overall effectiveness rating of requires improvement (62 schools out of 154, or 40%). In order of likelihood, other schools remained as good (25% of schools), dropped to inadequate (19%), or improved to outstanding (16%).
The overall picture
What happens if we look at every type of inspection that took place – both short inspections (whether or not they converted) and inspections that were full inspections from the outset?
In the period looked at, a total of 735 secondary schools were inspected.
Following the approach adopted in performance tables, we can put these schools into one of five groupings, classifying their P8 score as:
- well above average (+0.5 or higher; lower confidence interval is higher than 0);
- above average (between 0 and +0.5; lower confidence interval is higher than 0);
- average (lower confidence interval is 0 or lower; upper confidence interval is 0 or higher);
- below average (-0.5 to 0; upper confidence interval is lower than); or
- well below average (below -0.5; upper confidence interval is lower than 0).
The chart below shows the mix of inspection ratings received by schools in each of these five groups.
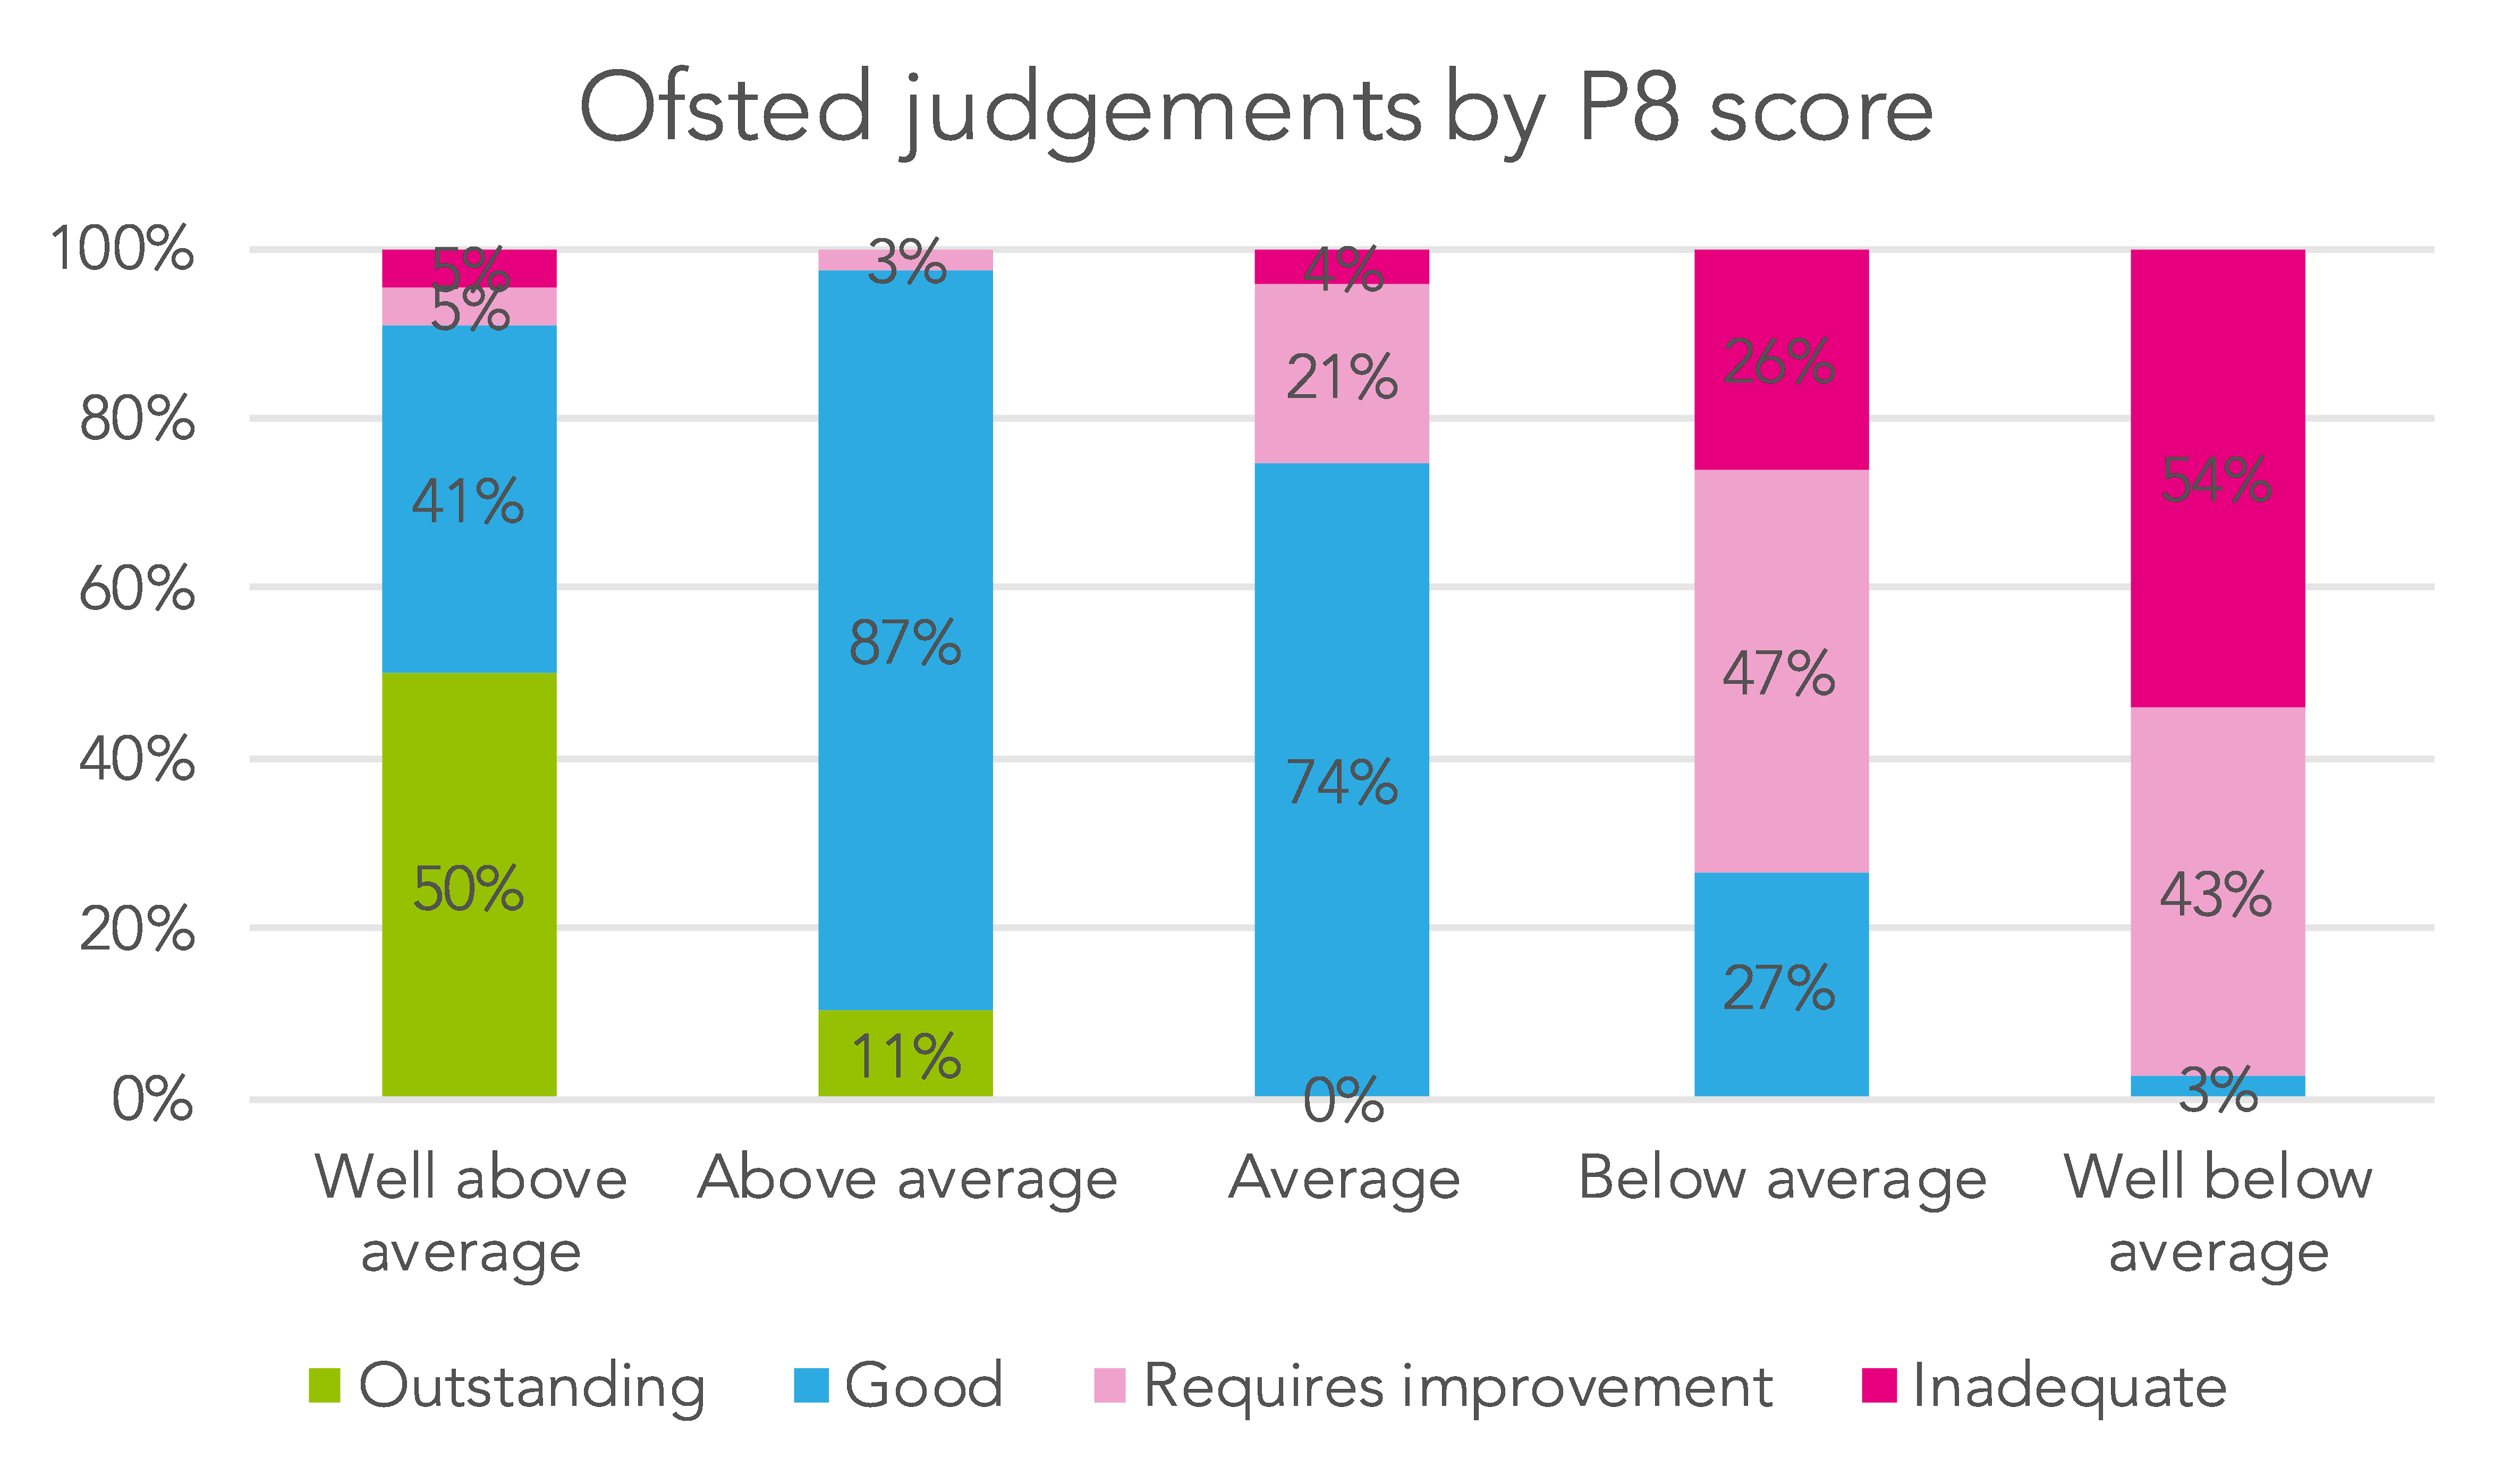
So we can see that half of schools (50%) with P8 scores well above average achieved an outstanding rating, compared to 11% of those with P8 scores that place them in the average grouping. And that 5% of schools with P8 scores well above average received a requires improvement rating, and another 5% received an inadequate rating – but, based on a group of 22, this in fact relates to only one school receiving each of these ratings.
Schools with lower P8 scores – either above average or average in our categorisation – were most likely to receive a good judgement, at 87% and 74% each for these respective groups.
Looking at schools with P8 results well below average, the vast majority were rated as either requires improvement (43%) or inadequate (54%) – but 3% successfully receiving a good rating.
The chart below shows the full picture of how, in the period under consideration, a P8 score related to an inspection rating.
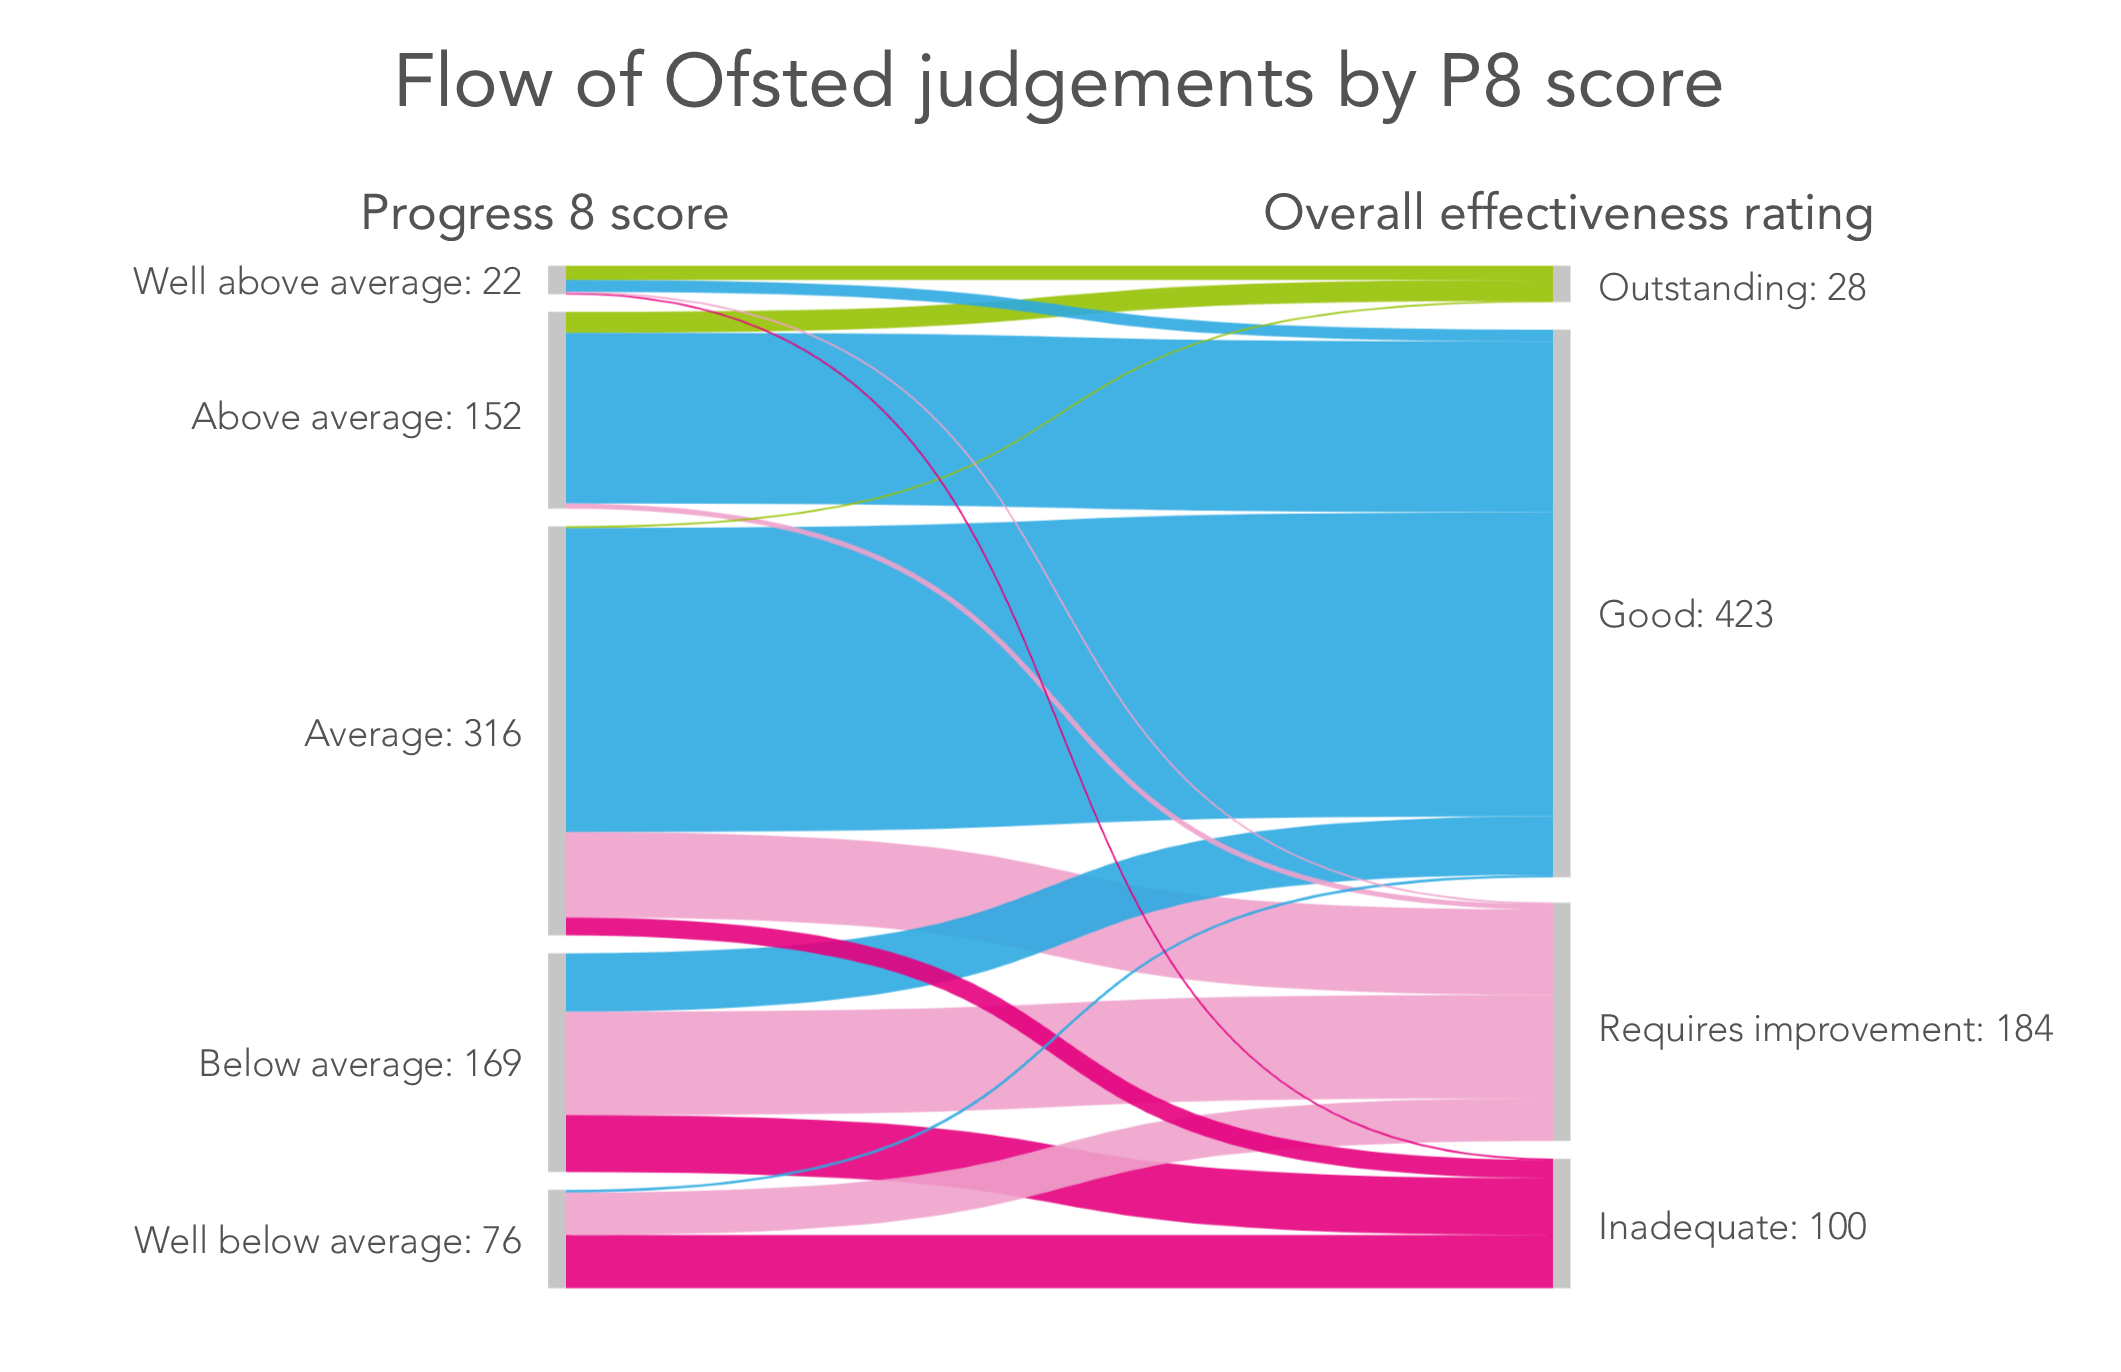
Looked at from the other direction, we can look at the average P8 score of schools which ended up with each of the four inspection judgements[2].
Schools which ended up with an outstanding judgement had an average P8 score of 0.47.
For those which received a good rating, the figure was 0.07.
Schools judged to be requires improvement had an average P8 score of -0.27, while for those judged to be inadequate the average P8 score was -0.45.
Overall, then, these results show that inspection outcomes were closely related to P8 scores – but that a certain P8 score does not necessarily determine a certain inspection judgement. (It’s also worth saying, of course, that some issues, such as safeguarding concerns, only come to light in the course of an inspection.)
What conclusions can we take?
So what conclusions can we draw from this?
The results can be interpreted in several ways.
On the one hand, we might be encouraged, as these findings suggests that inspections are data-led, or are at least producing judgements broadly in line with historic assessment data. This might allay some concerns about the arbitrariness of the inspection process.
Looked at another way, Ofsted’s inspection framework gives precedence to the performance of current school cohorts [PDF], so in theory it should be possible for schools with low published performance data to be awarded a higher inspection rating than data would lead us to expect. This would be particularly important for schools on a rapid improvement journey, where strengths in current performance may not yet be reflected in historic results.
This analysis suggests that this is rare, however: it is in quite small numbers of cases – though not unheard of – that a school with low published (i.e. historic) results achieves one of the top two inspection judgements. So some might have concerns that inspection outcomes are coming out too much in line with past performance – and might actually have hoped for a less strong link.
What do you think? We’d be interested to hear your thoughts on how closely inspection ratings are tied to the headline performance measures – share your comments below.
Next, why not read Steve Rollett’s recent post on the new Ofsted strategy for the period 2017-2022 , and what this means for inspection practice?
Want to stay up-to-date with the latest research from Education Datalab? Sign up to our mailing list to get notifications about new blogposts, or to receive our half-termly newsletter.
1. This analysis is based on inspection carried out from 26 September 2016, and published by 31 August 2017 – the latest available in Ofsted’s published management information. It covers mainstream schools with Key Stage 4 results – alternative provision, special schools, university technical colleges and studio schools are excluded.
2. Two things it’s worth mentioning: schools with a P8 score of +1.0 or above are exempt from routine inspection for a calendar year [PDF], and there looks to be one school that could have been a beneficiary of that last year. And Ofsted takes a risk-based approach to deciding which schools are inspected, in which P8 scores are likely to be factor. So, across each of the four inspection outcomes it seems likely that the P8 scores observed are probably a little lower than would have been the case had an entirely random sample of 735 schools been inspected in the period looked at and the same analysis carried out.


Seems to me there is a clash here – how can Ofsted tie criterion referenced judgements to p8 scores which are norm referenced?
Adam – Ofsted’s own inspection guidance does reference national averages: for Good, it says “From different starting points, progress in English and in mathematics is close to or above national figures”, and similar phrases are used for Outstanding and Inadequate. The school’s outcomes relative to national is by definition norm-referenced, and that forms *part of* the determination of the Outcomes judgement. Ofsted don’t want to set criterion-referencing too strongly because then they are in danger of ever-improving judgements and reduced challenge.
If inspection takes place relatively early in the school year it is likely that the judgement would be more influenced by previous results than by current performance, as there may be relatively little hard evidence for that current performance. In contrast, towards the end of the year one might expect the in year performance to now have much more substantial hard evidence for the team to consider.
It would be interesting to see if the above analysis looked the same for autumn, spring and summer term inspections or whether there was more movement away from results aligning with previous data as the year progressed.
I really like the analysis. Good stuff!
Along similar lines, it would be interesting to look at how inspection results in the years before the P8 results relate to the P8 results. It’s how schools are performing in those preceding years that has causal impact on progress. Does Ofted capture this?
Thanks Steve. We had a look at this (admittedly using data from a few years ago) in this blogpost https://ffteducationdatalab.org.uk/2015/11/is-an-ofsted-judgement-a-lagging-or-leading-indicator-of-school-performance/. Would certainly be worth repeating the work to see if things have changed much more recently.
If we draw the conclusion from this that P8 directly correlates with inspection grade, and we know that P8 also correlates (somewhat) with prior attainment – does inspection grade thetefore correlate with prior attainment. Also given the grammar school bonus given this year, have we created a fairly problematic regime?
@Alex. Yes!