It’s hard to find the words to describe the events of the last couple of weeks.
Although there will be inquiries into what happened, including by the Office for Statistics Regulation, the consequences will rumble on for years to come.
There will be plenty of time to look into this in future. In this blogpost, we’re going to take a more detailed look at a problem that some schools and colleges found in trying to make sense of the A-Level results that were calculated by Ofqual’s standardisation model . We set out some of this in this blogpost.
In particular, the adjustments for prior attainment did not make much sense to many of the school data managers who we were in touch with. And they know their data inside out.
The answer lies in how you measure prior attainment at GCSE.
GCSE average point scores
Some schools were expecting higher results because they noticed that the GCSE average point score of their 2020 cohort had increased. Some had even used the Department for Education value added ready reckoner and transition matrices to get a feel for how much their results might improve by.
The average point score is simply the average grade in reformed GCSEs.[1] So if you took 10 GCSEs and you received grade 8 in five of them and grade 7 in the other five then your average would be 7.5.
The complication comes from the inclusion of A*-G grades. The majority of the 2020 cohort of A-Level entrants would have reached the end of Key Stage 4 in 2018, and others the previous year. By that stage, many, though by no means all, subjects had been put onto the 9-1 scale.
The Department for Education came up with a way of converting A*-G grades onto the 9-1 scale as follows.
| A* | 8.5 |
| A | 7 |
| B | 5.5 |
| C | 4 |
| D | 3 |
| E | 2 |
| F | 1.5 |
| G | 1 |
| Ungraded | 0 |
But although this conversion is used conventionally, it is not exactly equivalent.
This leads to issues when comparing between cohorts.
Comparisons between cohorts
The majority of the cohort which took A-Level exams in 2019 would have entered GCSEs in 2017. This was the first year that reformed GCSEs in English and maths were introduced.
The 2020 A-Level cohort would have taken more reformed GCSEs.
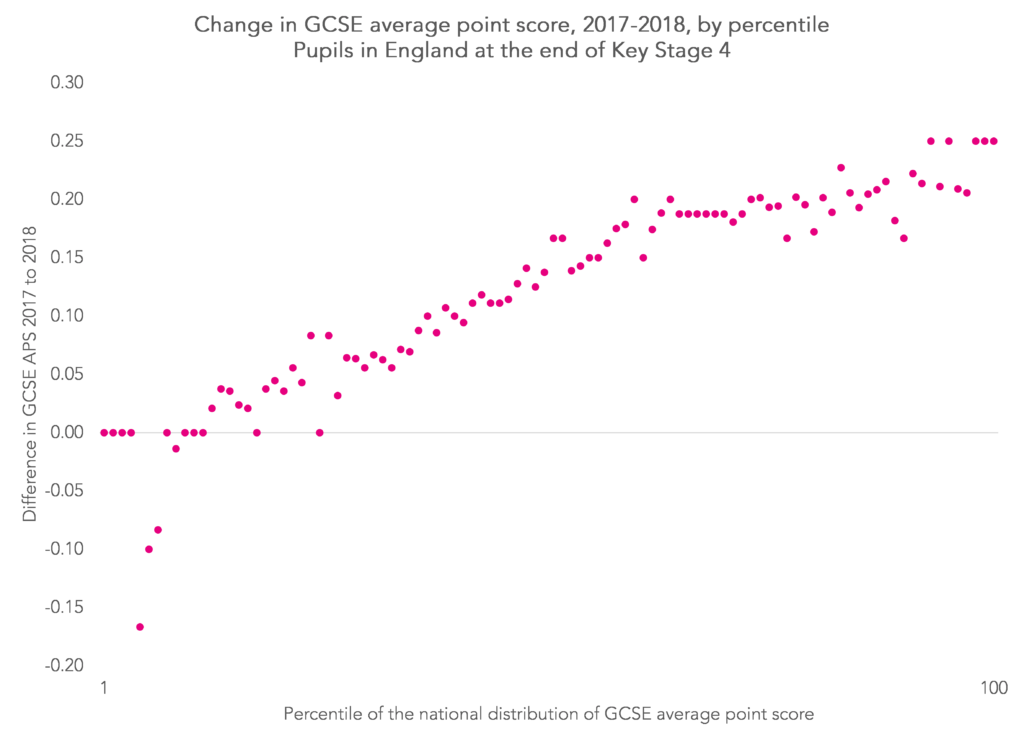
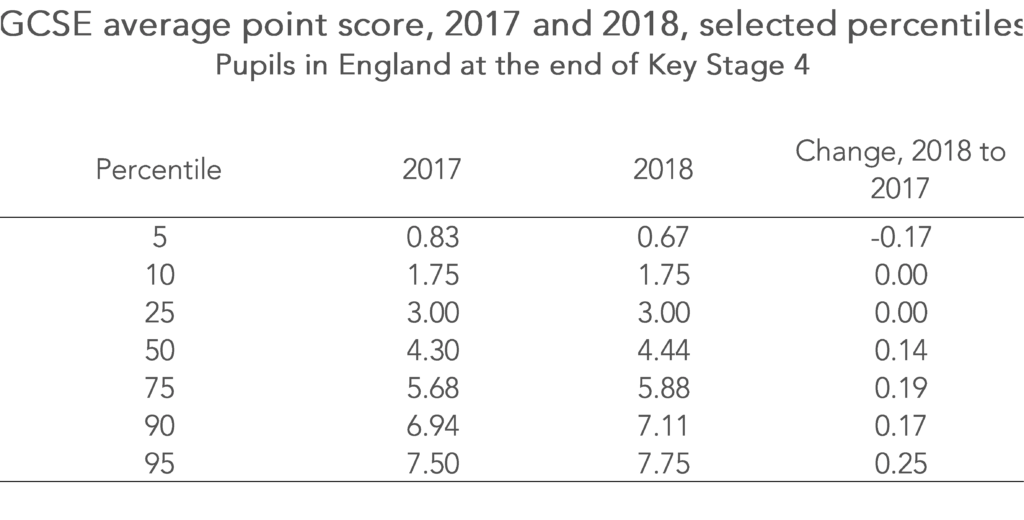
Because the method of equating A*-G grades to 9-1 grades used by the Department for Education is not directly equivalent, it appears that the 2020 cohort has slightly higher prior attainment overall than the 2019 cohort. In the chart below, we’ve calculated the GCSE average point score for each percentile of the national distribution in 2017 and 2018 and shown how it changed. The table below shows the data at selected percentiles.
In general, particularly at the upper end of the distribution where proportionately more A-Level students are found, GCSE average point scores were around 0.2 (a fifth of a grade) higher.
This doesn’t sound like much, but it does have some consequences.
Using GCSE APS with transition matrices
Let’s use an utterly implausible example just to show what the consequences of this are.
At a particular school, 20 students entered A-Level maths in 2020. They all achieved a GCSE APS of 8.1.
The school looks up the DfE transition matrix for 2019 to get a sense of what results could be expected if the 2020 students achieved in line with other students of similar prior attainment nationally in 2019.
| A* | 48.4% |
| A | 35.3% |
| B | 10.7% |
| C | 4.1% |
| D | 1.1% |
| E | 0.4% |
| Ungraded | 0.1% |
But as the chart above shows, GCSE average point scores were around 0.2 point higher in 2018. Put another way, those pupils would have achieved a lower GCSE average point score if they had entered GCSEs in 2017 simply because they would have taken fewer 9-1 GCSEs.
If we lower the GCSE average point score by 0.2, the estimated grade distribution for the school in maths would look like this. Which is quite different.
| A* | 21.6% |
| A | 35.2% |
| B | 21.0% |
| C | 13.5% |
| D | 6.3% |
| E | 2.1% |
| Ungraded | 0.2% |
Now let’s imagine that the 2019 cohort of A-Level entrants in maths at the school had all achieved an average point score of 7.85. The school might conclude that its 2020 entrants had slightly higher prior attainment – 8.1 versus 7.85. But in fact both sets of students were at the 97th percentile of all students nationally.[2] In other words, prior attainment may well not have increased after all.
To get around this problem, Ofqual age-standardised the GCSE average point score of each cohort when making adjustments based on prior attainment (shown in this data specification). However, no details have been published on the age standardisation process to the best of our knowledge.
This might explain, at least in part, the drop in expected results reported by the Sixth Form Colleges Association and why some schools struggled to get their heads around the prior attainment adjustments on A-Level standardisation reports.
Want to stay up-to-date with the latest research from FFT Education Datalab? Sign up to Datalab’s mailing list to get notifications about new blogposts, or to receive the team’s half-termly newsletter.
1. AS-levels taken by the end of Key Stage 4 are also included.
2. Because not everyone enters A-Level maths, these pupils would be at a lower percentile of all pupils entered for A-Level maths.


One of the problems of applying prior GCSE attainment is that there is no national database that embraces the independent sector. Most in this sector took IGCSE which FFT analysis last year suggests is rather easier than new specification GCSE. Although the independent sector is relatively small it gains a disproportionate number of top grades at A level.
It is difficult to see how Ofqual arrived at a secure model that could be applied with equal confidence to both sectors