In September 2019, the government announced a major review into support for children with special educational needs and disabilities (SEND).
This is just one of many plans that has been blown off course by Covid. The Secretary of State announced in September that it was unlikely to report until 2021.
We have shown previously how the number of young people with education, health and care plans (EHCPs) – or their predecessors (Statements of SEN) – being educated in state-funded mainstream secondary schools has declined over the last twenty years and particularly since the SEND reforms of 2014.
In this blogpost we’re going to look in more detail at the extent to which pupils with SEN fall out of the state-funded school system. We hope that the DfE SEND review takes suitable action to address this.
Tracking a cohort
For this piece of work, we’re going to track a cohort of pupils observed in Year 6 in state-funded mainstream and special schools in 2013/14 all the way through to the end of 2018/19. By this time, almost all of these pupils would have been in Year 11.
At this point, pupils’ SEN statuses reflected the previous SEN code of practice: School Action, School Action Plus (external support) and Statement of SEN. As we’ve shown before, SEN status tended to change over time for many pupils.
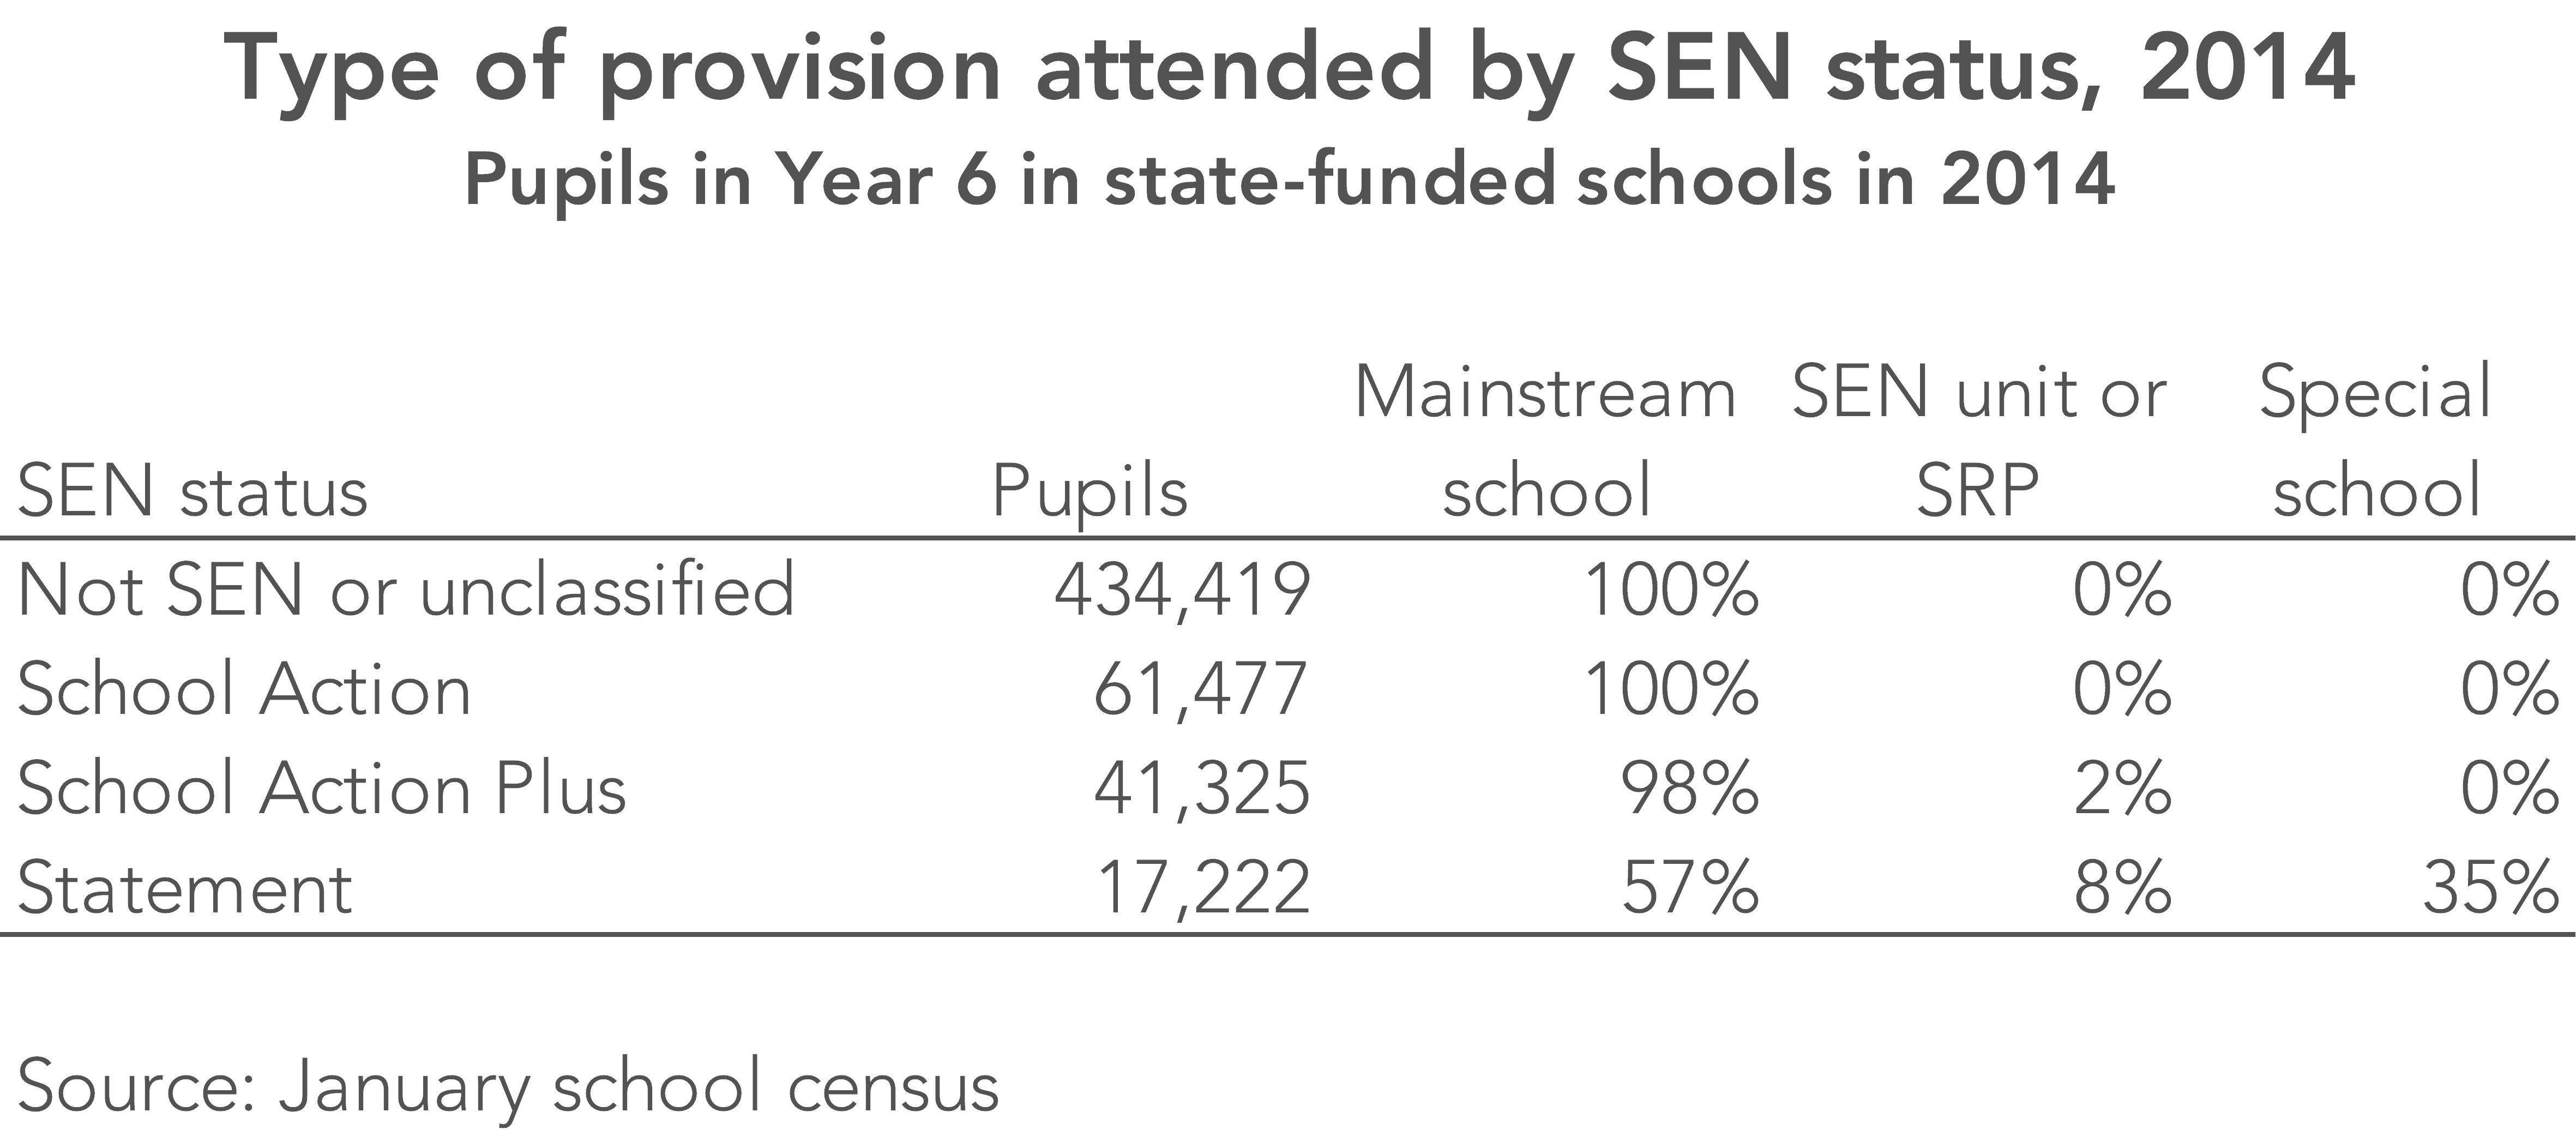
The table below shows the pupils from our cohort broken down by SEN status and type of provision attended at the end of primary school. A total of 35% of those with Statements were being taught in special schools. And 8% were taught in specialist resourced provision (SRP) or a SEN unit within a mainstream school.
Movements out of the state school system
Now let’s track the cohort through the next five years using the termly school census. The chart below reports the percentage of pupils who have left the state sector – either mainstream or special – at each point in time.

We first observe pupils again in autumn 2015. The majority of pupils will have undergone a transition to secondary school. At this stage, we observe a slightly higher proportion of the “Not SEN” group having left the system. This is primarily to independent schools.[1]
But thereafter, pupils classified as having special educational needs at the end of primary school left the state-funded school system at a faster rate. By the end of 2019, more than 10% of pupils classified as having SEN met by either Statements or School Action had left the system. This figure was even higher (13%) among those with SEN met by School Action Plus.
Where were pupils with SEN being educated?
For the rest of this post, we’re just going to look at pupils who were receiving some form of external SEN support at the end of primary school (School Action Plus or a Statement).
We can expand the types of setting where we’re looking for these pupils to include state alternative provision and provision where the local authority is paying for education, which includes things such as independent special schools (‘local authority provision’ in the chart below).[2]
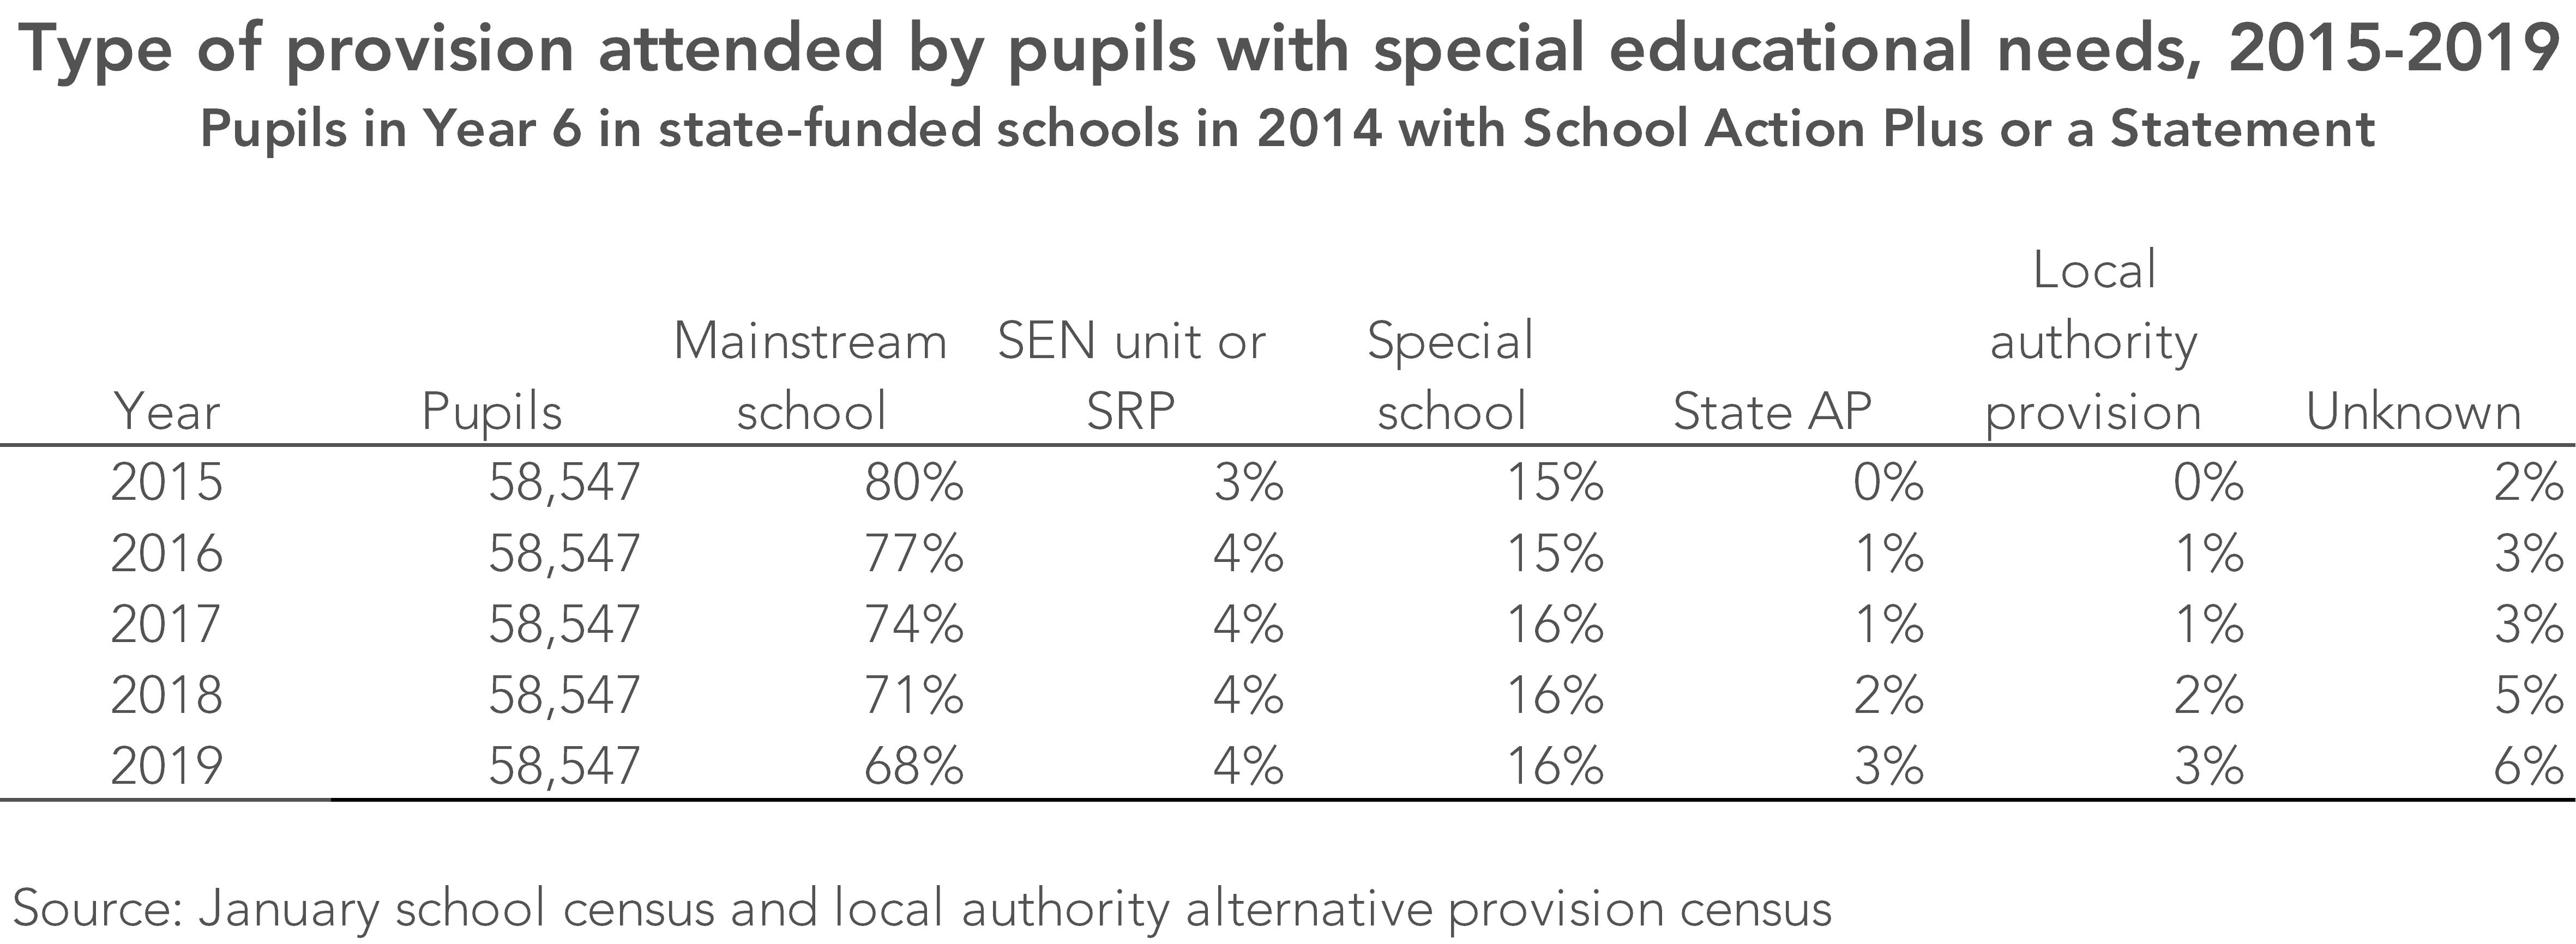
This shows a gradual reduction in the number of pupils educated in mainstream schools, and increases in the numbers attending special schools, alternative provision and local authority provision.
We also see a large increase in the number whose status is unknown. We do not know where these pupils are or what they are doing [3]. We might expect to lose a small number from the system due to emigration, errors in data linkage, or, sadly, death. But a loss of almost 4,000 pupils (6%) to unknown destinations seems on the large side.
The SEN needs of those leaving the system
Finally, we’ll look at the types of setting attended in January 2019 – Year 11 year for most of these pupils – by those classified as having SEN met by School Action Plus or a Statement when they were at the end of primary school.
The table below shows these pupils according to their primary (as in predominant) SEN type at the end of primary school.
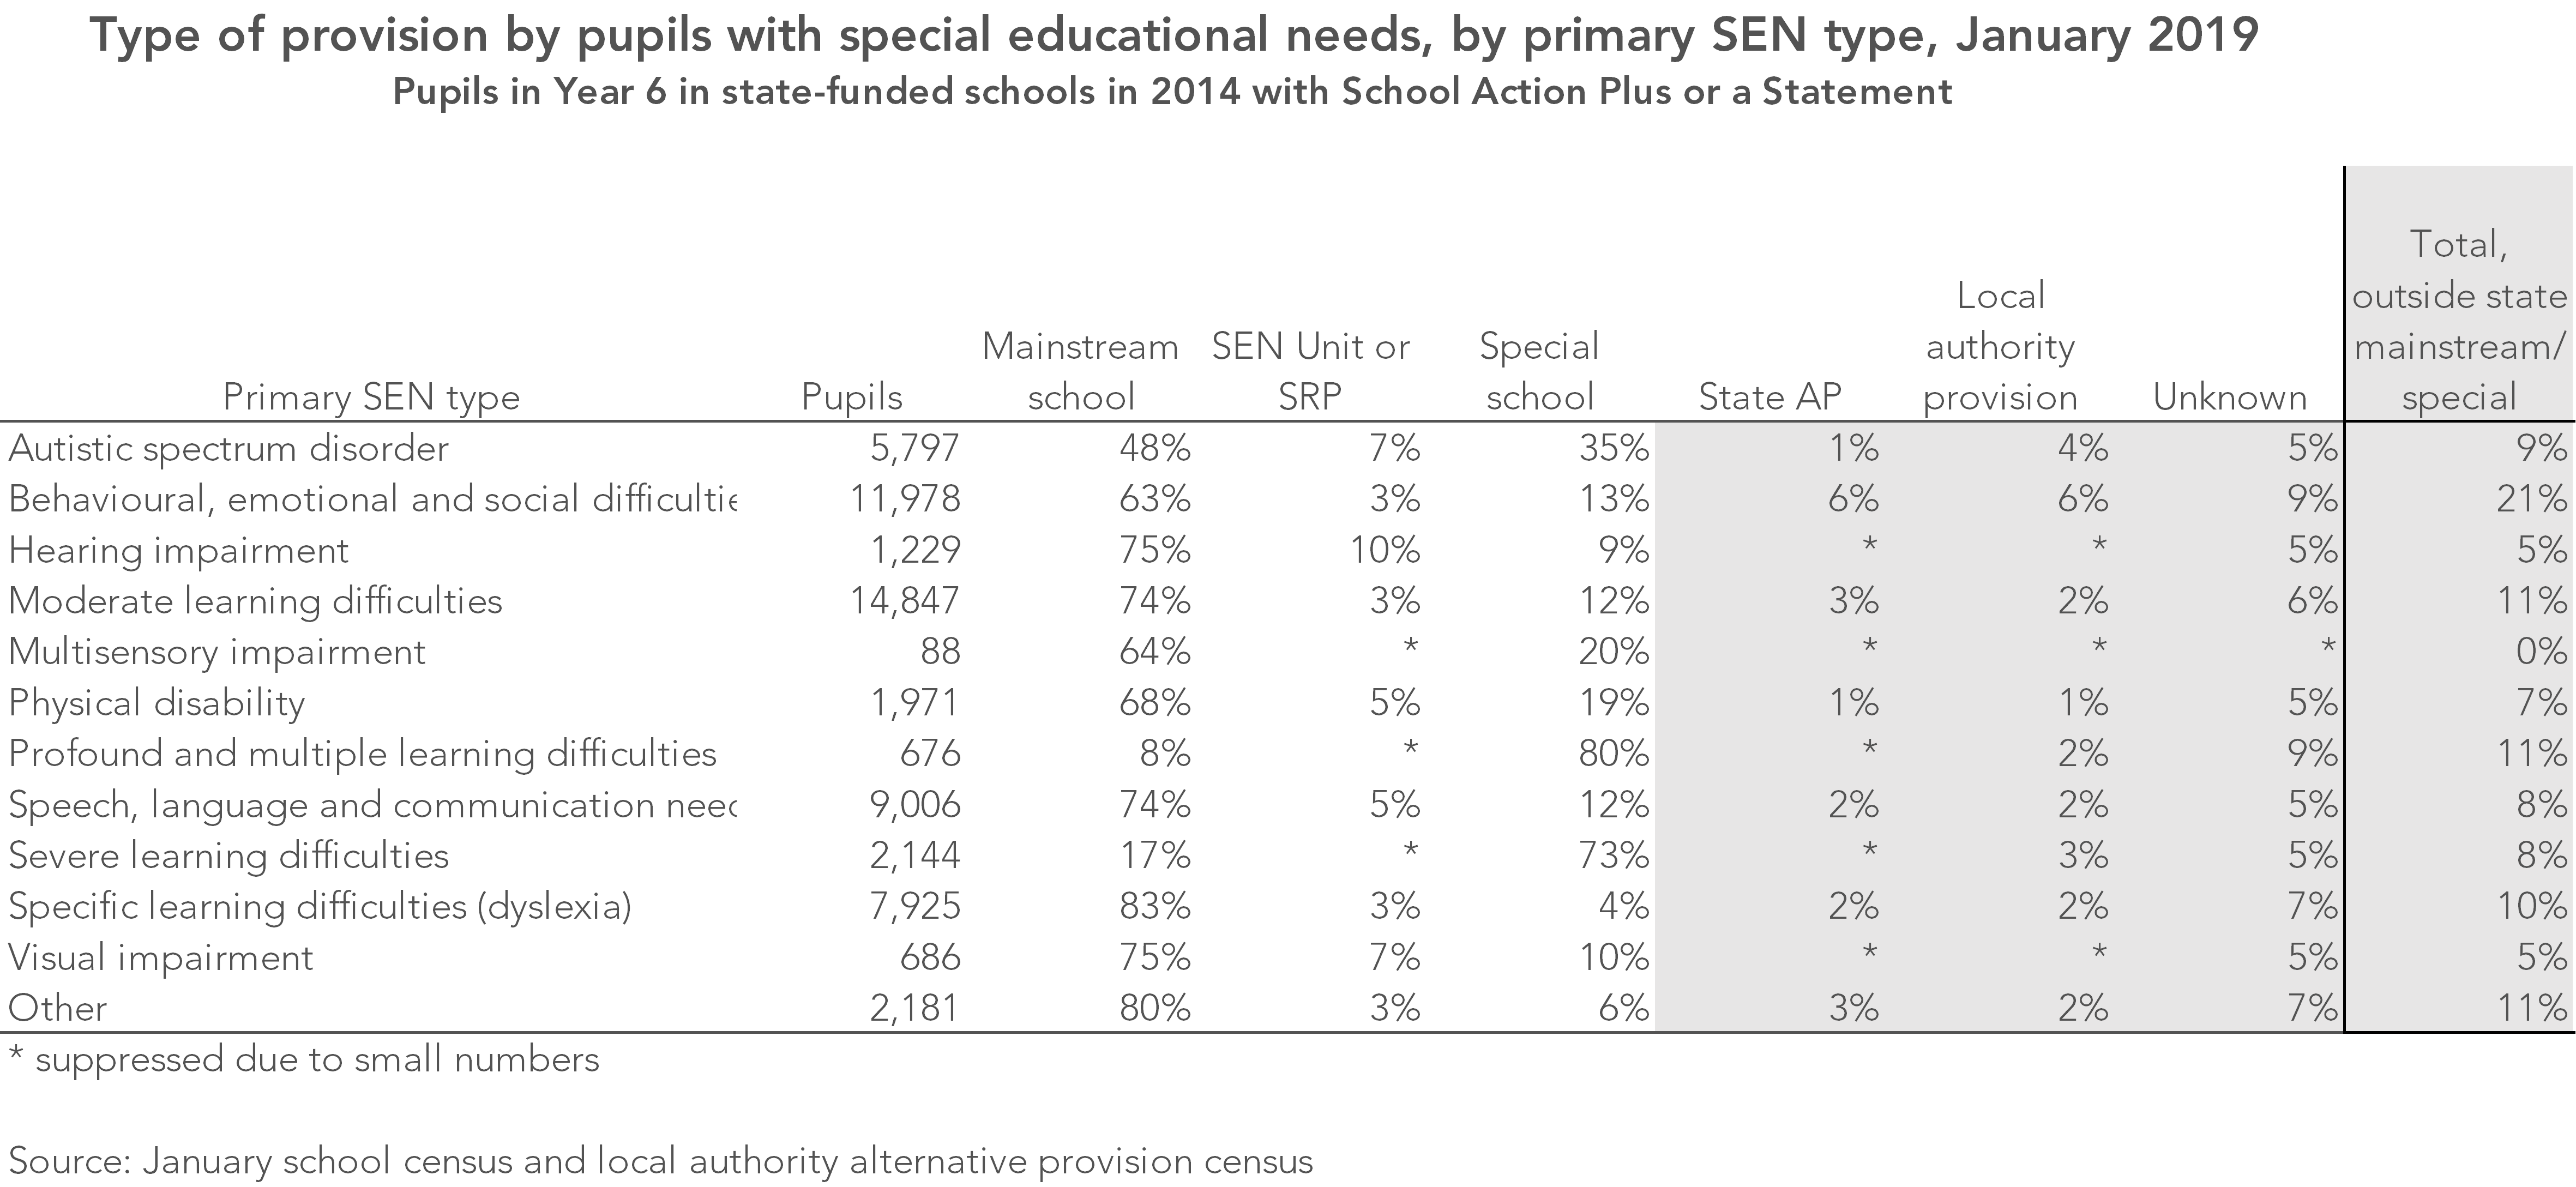
In total, 21% of those with behavioural, social and emotional difficulties at the end of primary school were no longer in the state mainstream or special education by the end of secondary school.
Rates were lower among other groups, although they still exceeded 10% for those whose primary SEN type was moderate learning difficulties, profound and multiple learning difficulties, dyslexia and the group not otherwise classified.
Final thoughts
So what are we to make of this?
What’s clear is that there are large numbers of pupils with SEN leaving the state system – with some pupils more likely than others to leave the state system.
This seems to have happened without too much scrutiny of whether it is the right approach.
As part of the SEND review, we therefore hope that the Department for Education examines in some detail why there is so much movement of young people with SEN out of the state-funded school system and, in particular, the suitability of the education they are receiving.
Want to stay up-to-date with the latest research from FFT Education Datalab? Sign up to Datalab’s mailing list to get notifications about new blogposts, or to receive the team’s half-termly newsletter.
1. We subsequently observe around two-thirds of this group at independent schools in the 2019 Key Stage 4 data.
2. This latter category is provision covered by the local authority alternative provision census.
3. We subsequently observe 14% of these pupils at independent schools and 10% at general further education colleges. These types of establishment do not complete School Census.


Really interesting, important analysis. Can I ask a nerdy question: how did you get these data for analysis? It looks like you have pupil level data on this specific cohort, that you were able to link to explore different types of provision over time. With improvements to the AP census, could you separate out independent schools too? Have you published a fuller report anywhere? Many thanks.
Hi Anne. Thanks very much- the nerdier the questions the better. DfE makes available extracts of the National Pupil Database (NPD) to accredited researchers for agreed purposes via the Office for National Statistics Secure Research Service. So we used several years’ worth of termly School Census and local authority AP census plus Key Stage 2 and 4 data for the cohort to track movements out of the state-funded sector. There isn’t a report as such but we’ve been studying school enrolment for a number of years (see our Who’s Left? series, for example) and this blogpost was returning to a theme we’d previously looked at (https://ffteducationdatalab.org.uk/2019/02/where-have-the-pupils-in-mainstream-schools-with-education-health-and-care-plans-gone/) with more recent data. We weren’t able to separate out independent schools using AP census with the data we had but would hope to be able to do so in future.
We have a child with severe dyslexia, we have fought the system for 10 years with very litle results even to get a SEN status as the local authority refused to accept external testing and refuses to test themselves, my experience as a teacher and as a parent has been that the support is widely inadequate and mostly provided by unqualified staff mostly underpaid teacher assistantnts and that any personalise learning plan failed within 3 weeks as personnel was unavailable ending with a dyslexic child in front of a computer. Moving our child to an independent school with a much reduced student teacher ratio didnt help neither as after 2 years and in provision of exams the school decided that it was too spensive to support our child so we as many other parents ended having to home educate our child .she is at College now but to continue the higher level studies she will need GSACs in English and Maths the system allows her a reader but not a scribe or any other supportive technology so her chances are severely limited.
There is a terrible reality deficit in our education system based on paper alibies and boxes ticking and our children are falling through the cracks
Just ask every child or parent of a child who has been through the education system.
An obvious, but of course unrecorded, reason would be the high (anecdotal evidence, I admit, but based on sound observation) of off-rolling, which many schools have employed (and still do) to improve their status. Additionally the very poor level of support given to children with ALN, and a reluctance within schools to either support applications for Sen/ALN ECHP’s, or to misuse any funding that comes with such designation. There is a disproportionate number of children with ALN within the Elective Home Education community (and I use the term ‘community’ very loosely) as a result of the failings of the mainstream and to a lesser extent ALN/SEN education system, which are not adapted to, nor appear to be willing to adapt to meet the needs of these pupils.
I have personal experience of one head teacher who didn’t know how many pupils he had in his ‘integrated learning programme’ what their needs were, or why the children were kept behind a locked door, separated from the mainstream school. Ironically he was proud of his unit, which is why it came to my attention and lead to me asking the questions he was unable to answer.
Our wonderful boy is being failed by an education system that is not broken but built to produce the exact results we see today, which has broken the spirit of our boy and limited his potential and future live experiences.
J. Browne MBE