Among announcements from the Department for Education ahead of the Levelling Up White Paper was one about introducing some more “specialist 16-19 free schools” in 55 Education Investment Areas.
The press release accompanying the announcement went further. These will be “elite” schools.
This suggests, though this is by no means certain, that this is about creating some more super-selective schools for “talented children from disadvantaged backgrounds”.
In this blogpost we’ll look at existing super-selective sixth forms. We’ll show that schools of this type a) are more likely to recruit from outside the area in which they are located and b) don’t recruit that many disadvantaged pupils.
Data
We use School Census from January 2020 and look at Year 12 pupils. These pupils will (with a handful of exceptions) have completed Key Stage 4 in 2019, the final year unaffected by COVID-19.
We restrict our analysis to state-funded mainstream schools. This includes studio schools and university technical colleges but not FE colleges and sixth form colleges.
We calculate the average GCSE point score per entry of Year 12 pupils at each school. This gives us a crude measure of the selectivity of each intake.
Schools are then divided into 20 bands based on this measure of selectivity. The top 5% of schools have a mean GCSE score per entry of 7.1 or higher.
Super selective sixth forms
In the rest of this blogpost, we look at the 5% of school sixth forms with the highest attaining intakes (which will include some Grammar schools) rather than look at the characteristics of existing 16-19 free schools.
This is because we think the new schools will be more selective than the existing set of 16-19 free schools.
In our January 2020 data, there were 22 16-19 free schools with Year 12 pupils. Five of these were in the top 5% of schools based on intake attainment. The rest were spread across the rest of the distribution. In fact, there were some in the lowest 5%.
Recruitment from outside the local authority
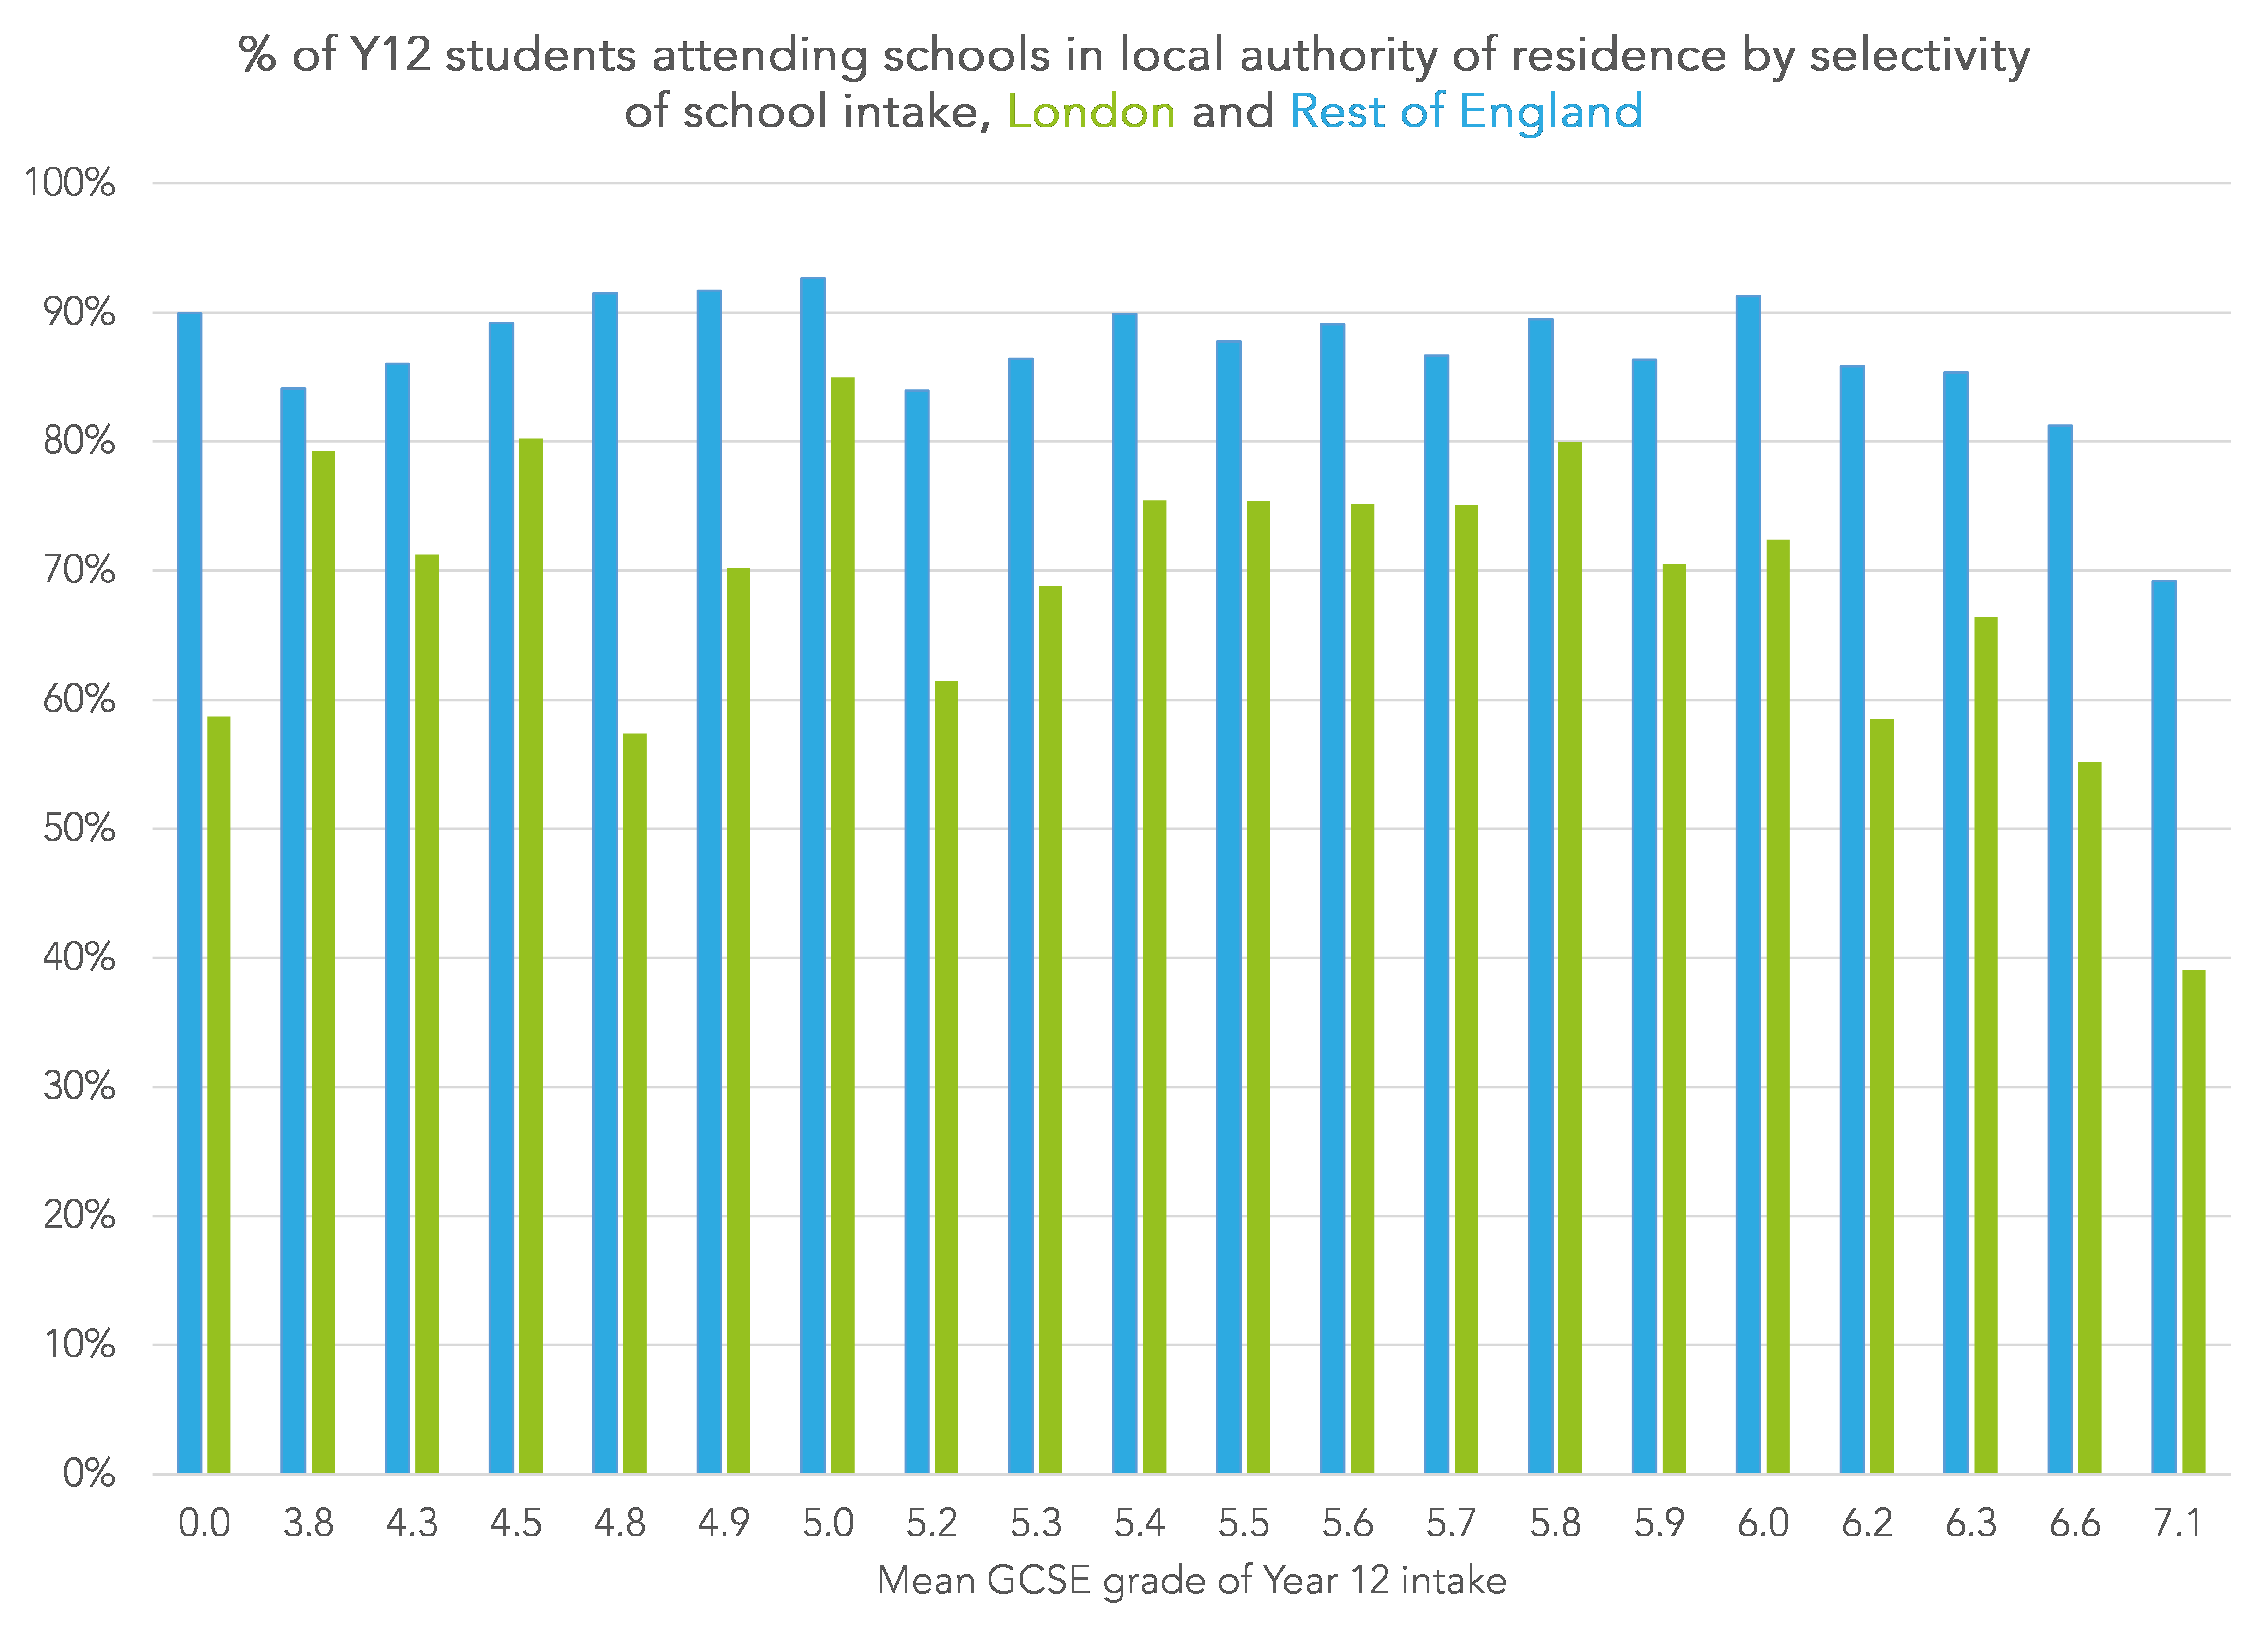
We calculate the percentage of Year 12 pupils in each school sixth form resident in the local authority which their school is located. This is plotted for each of our 20 school intake bands in the chart below.

Overall, 82% of Year 12 pupils live in the same local authority to the one in which they go to school.
But in the 5% most selective schools, this figure falls to 60%.
Of course, this depends on the size of local authority to some extent. You’d expect more pupils to cross local authority borders in London, for example, as the local authorities are small in area and there are generally good transport links.
Both within London and outside London, the most selective schools tend to recruit more pupils from outside the area in which they are located.
Disadvantaged pupils
Super selective sixth forms tend to recruit disproportionately fewer disadvantaged pupils than other schools.
We use whether a pupil was eligible for free school meals in the six years up to the end of Key Stage 4 as a measure of disadvantage.
The chart below shows the percentage of disadvantage pupils in each of the 20 bands of schools based on intake selectivity.
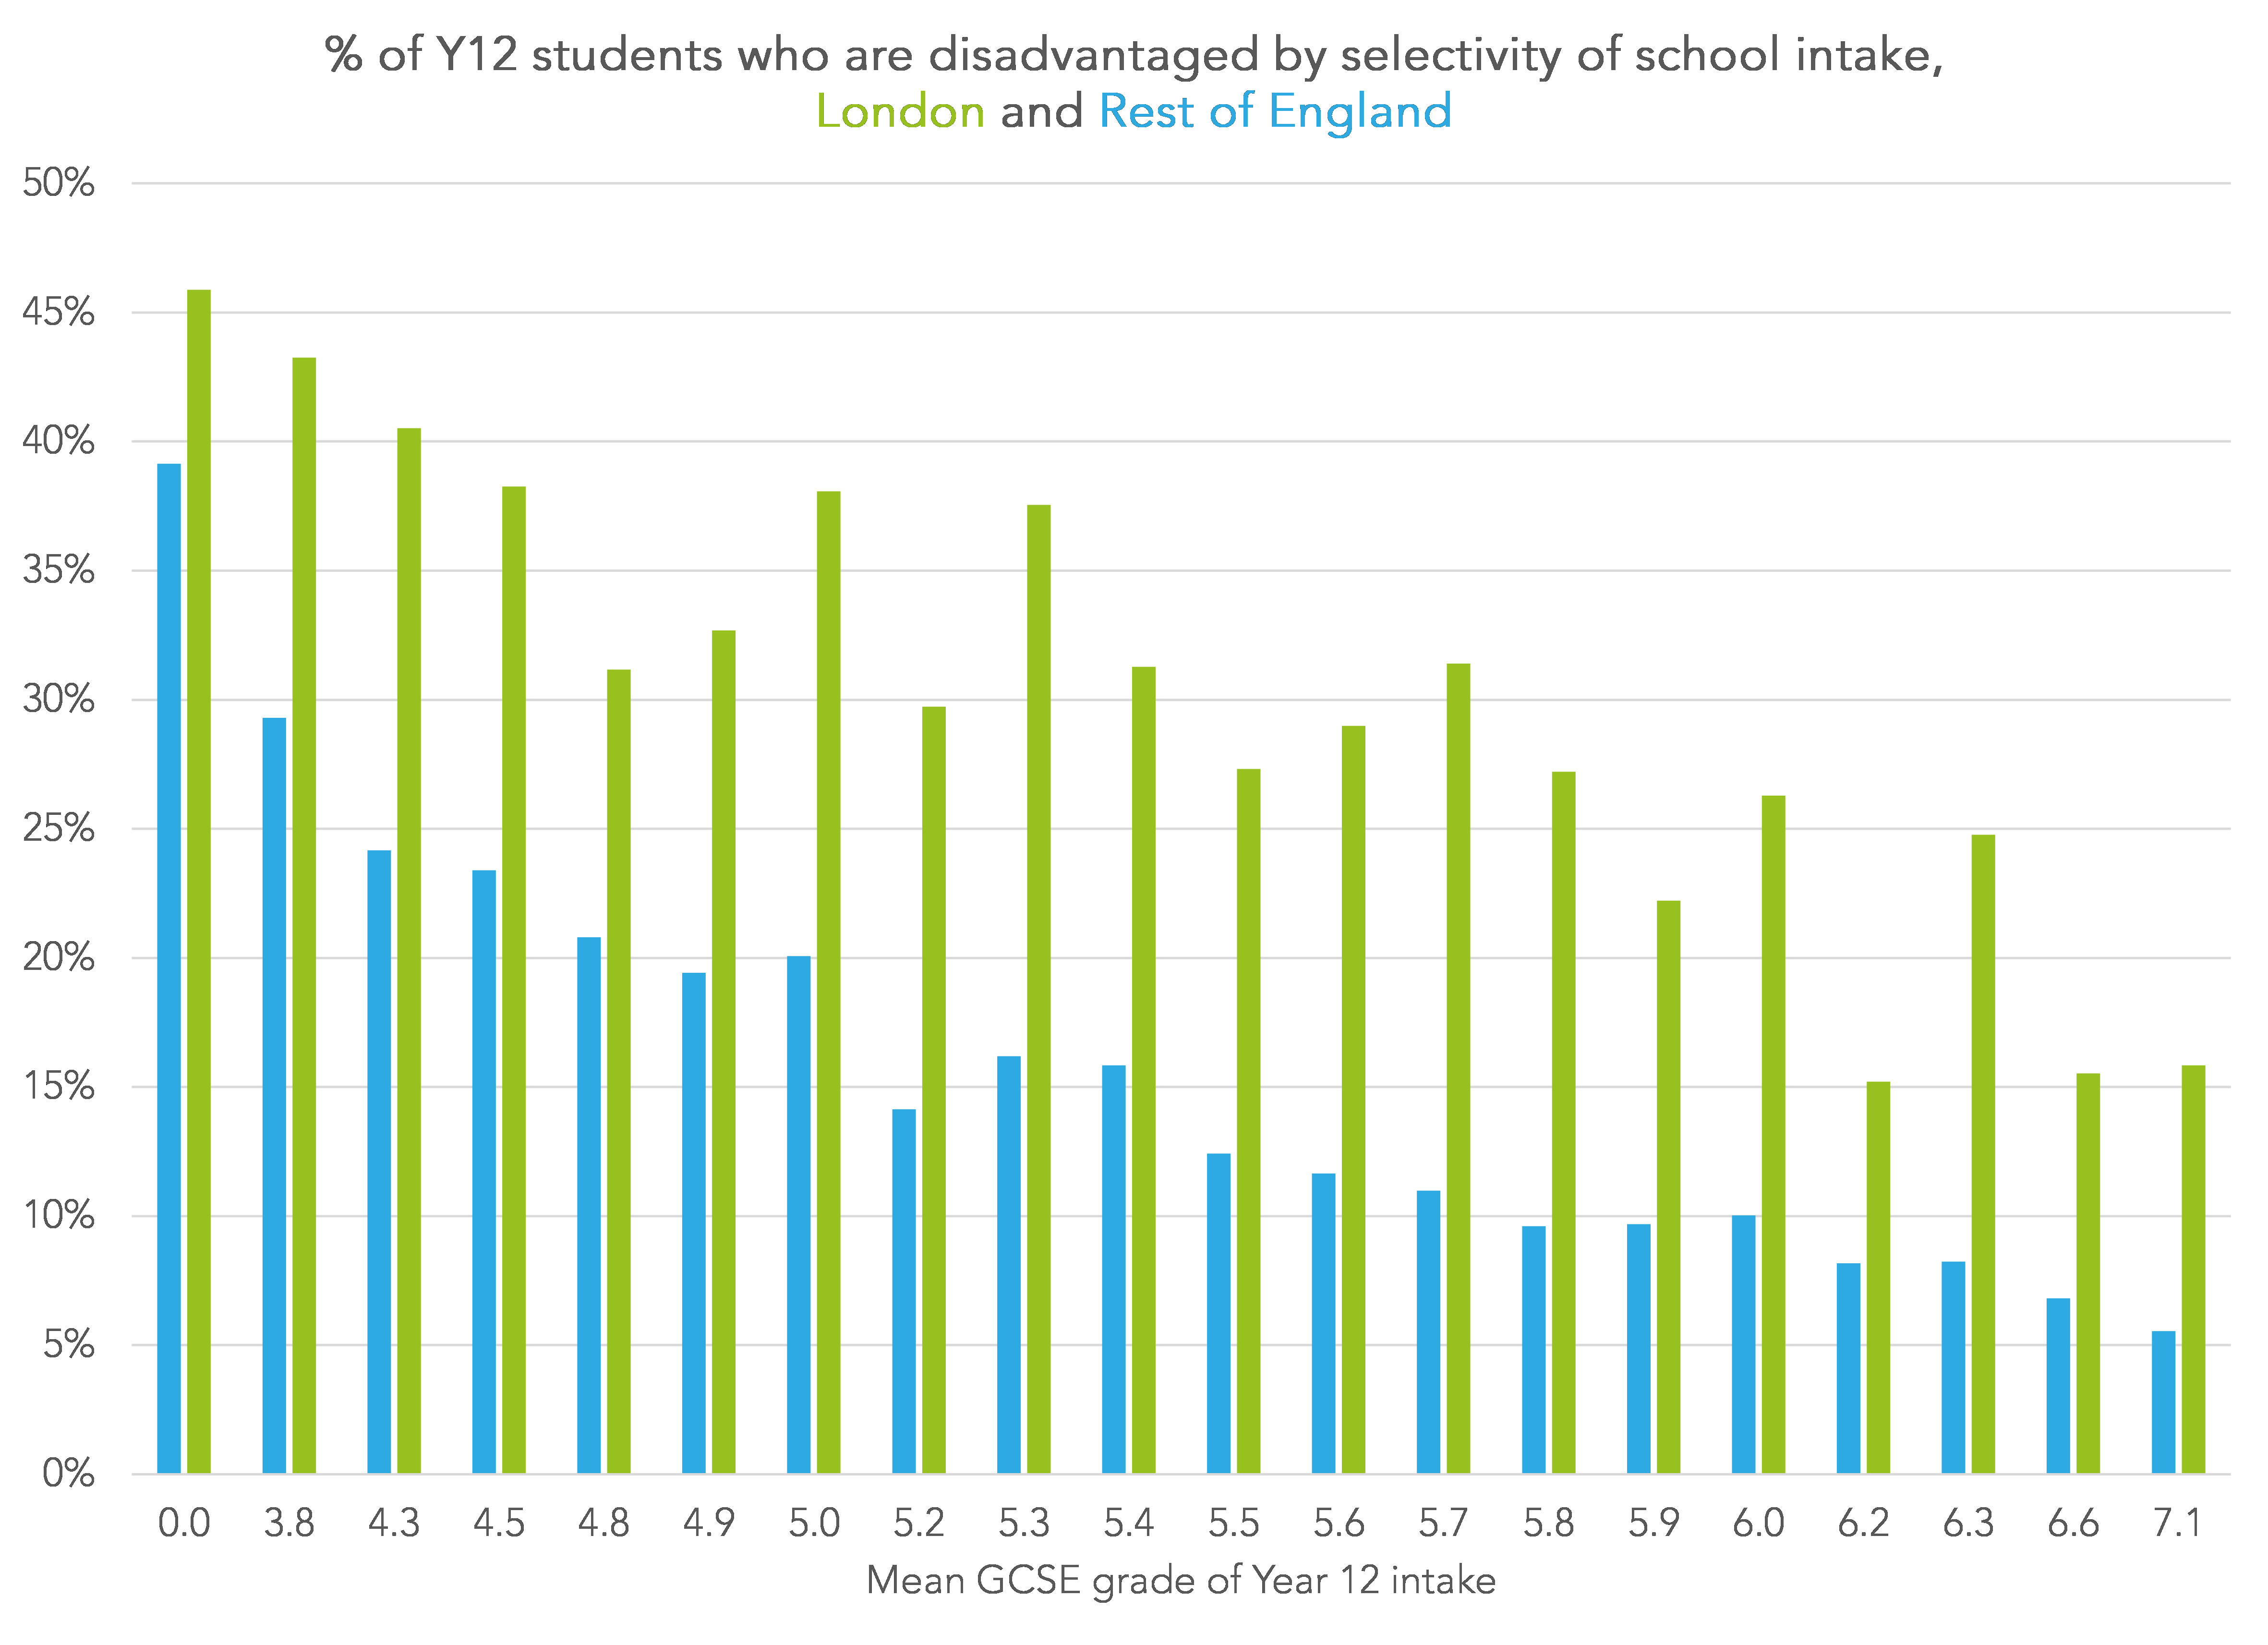
Nationally, 17% of Year 12 pupils are disadvantaged. In London, which tends to have more disadvantaged pupils than the rest of England and also higher levels of attainment, 28% of Year 12 pupils are disadvantaged. Bear in mind none of the EIAs are in London.
Outside London, just 6% of pupils who attended the most selective schools outside of London were disadvantaged.
Summing up
The key question is what will these new specialist sixth forms specialise in?
It is curious that the reference to “elite” sixth forms has (so far) only appeared in a press release.
If they are to be super-selective sixth forms then they may well prove popular but they are hardly likely to recruit many disadvantaged pupils unless entry requirements are relaxed.
Disadvantaged pupils tend to be lower attaining by the end of Key Stage 4 compared to other pupils.
Whereas 25% of pupils nationally at the end of Key Stage 4 are disadvantaged, the rate falls to just 17% among Year 12 pupils . This is because disadvantaged pupils are less likely to meet the entry criteria for typical school sixth forms, let alone super selective ones. Instead, they are more likely to take up options in the further education sector.
Adding super selective entry criteria for sixth forms would just create another barrier for this group.
But if the new schools can offer something different, for instance offering routes to Level 3 for pupils who might otherwise struggle to progress, then maybe they will be worthwhile.
Want to stay up-to-date with the latest research from FFT Education Datalab? Sign up to Datalab’s mailing list to get notifications about new blogposts, or to receive the team’s half-termly newsletter.


Hi Dave – really interesting. Is it possible to run the disadvantage analysis with different income bands e.g. looking at what some politicians have referred to as ‘just about managing’?
Hi Dave – great piece. Is it possible to run the disadvantage analysis by income decile and look at those deciles just above the bottom, what some politicians call ‘just about managing’? Might this be more where the gov is looking to target?
Hi Reza. Thank you! No unfortunately I don’t have any more granular data on household income. But you may well be right. This policy may well be about giving a small number of pupils (disadvantaged or not) living in those areas a bigger chance of getting into Oxbridge.
Dave, regarding the last chart, is this not saying that disadvantaged learners are not attaining as highly outside London? Or are you saying that there are more highly attaining disadvantaged learners but that they are not in the selective environment?
Is there any data showing progression from types of post 16 providers to the most selective universities e.d Sutton trust 30 or Russell Group or Oxbridge?
Hi Tim. Not quite. What it’s saying is that there are proportionately more disadvantaged students attending highly selective institutions in London than elsewhere. This is a function of a) higher attainment in London and b) there being more disadvantaged students in London. DfE publishes stats on progression to Russell group/ Oxbridge based on KS5 schools at https://www.compare-school-performance.service.gov.uk/download-data?currentstep=datatypes®iontype=all&la=0&downloadYear=2018-2019&datatypes=ks5destinationhe