This blogpost is part of FFT’s 2021 Secondary Results Service. This service has been extended to Wednesday 8th September.
In 2020, following the replacement of examinations with centre assessment grades, the disadvantage gap as measured by the Department for Education Gap Index narrowed very slightly.
This might have come as a surprise to some who anticipated an increase in the gap as a result of switching from exams to teacher assessment [1].
The Gap Index for 2021 will be published later in the term. But we think it will have widened this year.
Disadvantaged pupils
Some clues have already been published. On results day, Ofqual published its student level equalities analysis (we summarise this here), which showed that the gap in average GCSE grade between pupils eligible for free school meals and their peers increased by 0.12 grades between 2019 and 2021.
However, this analysis is just based on those eligible for free school meals. It is not clear which School Census snapshot Ofqual use. DfE use those eligible for free school meals in the last six years (FSM6).
But there are definitional problems. Firstly arising from the change to measuring FSM6 in the Autumn term rather than Spring. Secondly from changes to benefits. We cannot always be sure we are comparing like—with-like from cohort to cohort.
Those caveats notwithstanding, we summarise attainment and disadvantage data we have collected from schools.
Data
Over 1,200 schools have participated in the FFT Secondary Results Services over the last two years and provided us with Key Stage 4 data for both 2020 and 2021.
This data can be compared to published performance data for those schools in 2019.
In 2019, 25% of pupils at these schools were in the FSM6 group. This was slightly below the national average of 26.5%. This figure stood at 22% for the 2020 (national average 26%) and 22% again in 2021 (national average not yet known).
The DfE Gap Index is based on the average rank of disadvantaged pupils compared to other pupils. The ranking is based on the average grade in English and maths.
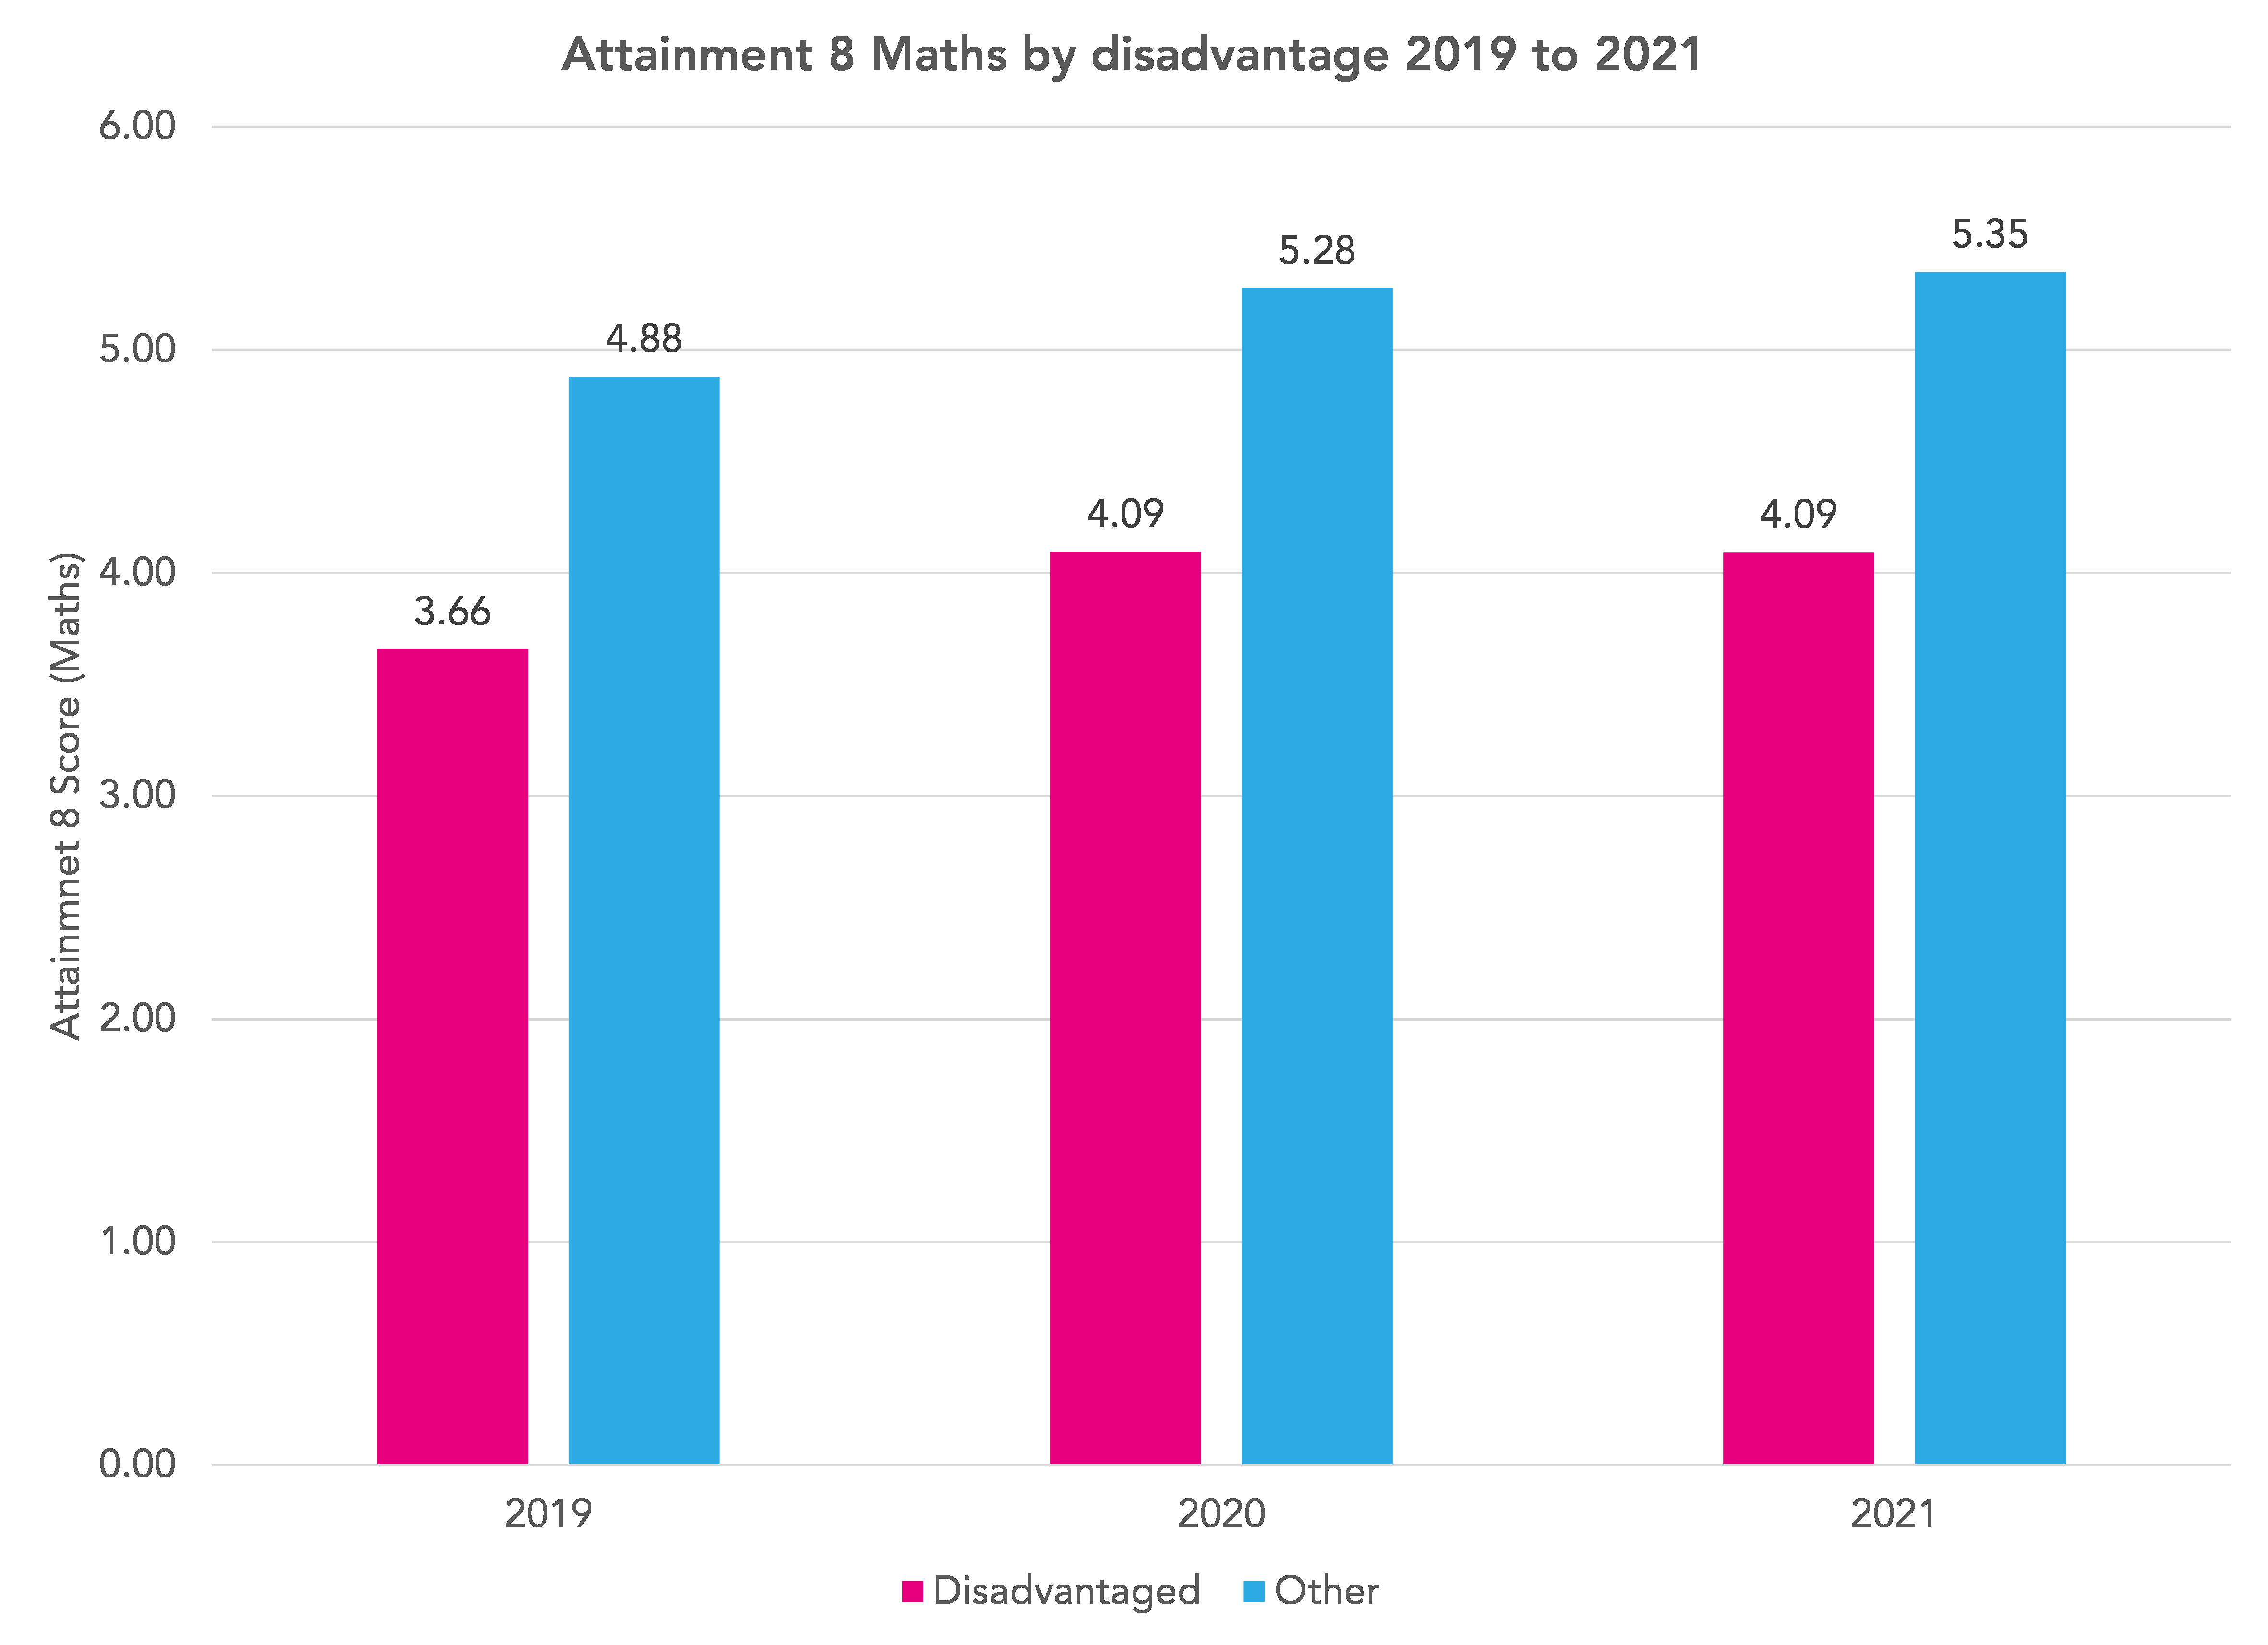
For this illustration, we show average grades in English and maths separately.
Results
In English at these schools, the disadvantage gap narrowed by 0.01 grades in 2020 and then increased by 0.1 grades in 2021.

The situation in maths was similar. The gap narrowed by 0.04 grades in 2020 and then increased by 0.08 grades in 2021
The effect of learning disruption
This year’s cohort had their learning disrupted by the pandemic in both Year 10 and Year 11.
In previous blogposts, we’ve shown how disadvantaged pupils missed more school this year than other pupils. They may have also tended to find it harder to study remotely, e.g. due to a lack of an appropriate device for online learning.
Schools were asked to assess pupils on the content they covered. The assumption was that disruption affected the amount of content covered, not how well it was covered.
But if disadvantaged pupils had covered the content less well, then we might expect to see an increase in school-level attainment gaps.
Changes in school-level attainment gaps
In the absence of COVID, we might expect school-level attainment gaps to fluctuate from year to year but the average school-level attainment gap [2] to be broadly similar from year to year.
If the average school-level gap increases, it would suggest that the results of disadvantaged pupils had worsened compared to their peers at the same school for some reason, possibly learning disruption.
If the average school-level gap doesn’t change, this would suggest that the increase in the national disadvantage gap is driven by differences in grading between schools.
We therefore recalculate the attainment gaps like this. First, we calculate the school average score in English (and maths). Second, we calculate the difference between each pupil’s English (and maths) score and the school average. Finally, we calculate the mean of these differences for both groups of pupils.
These differences are summarised in the chart below.
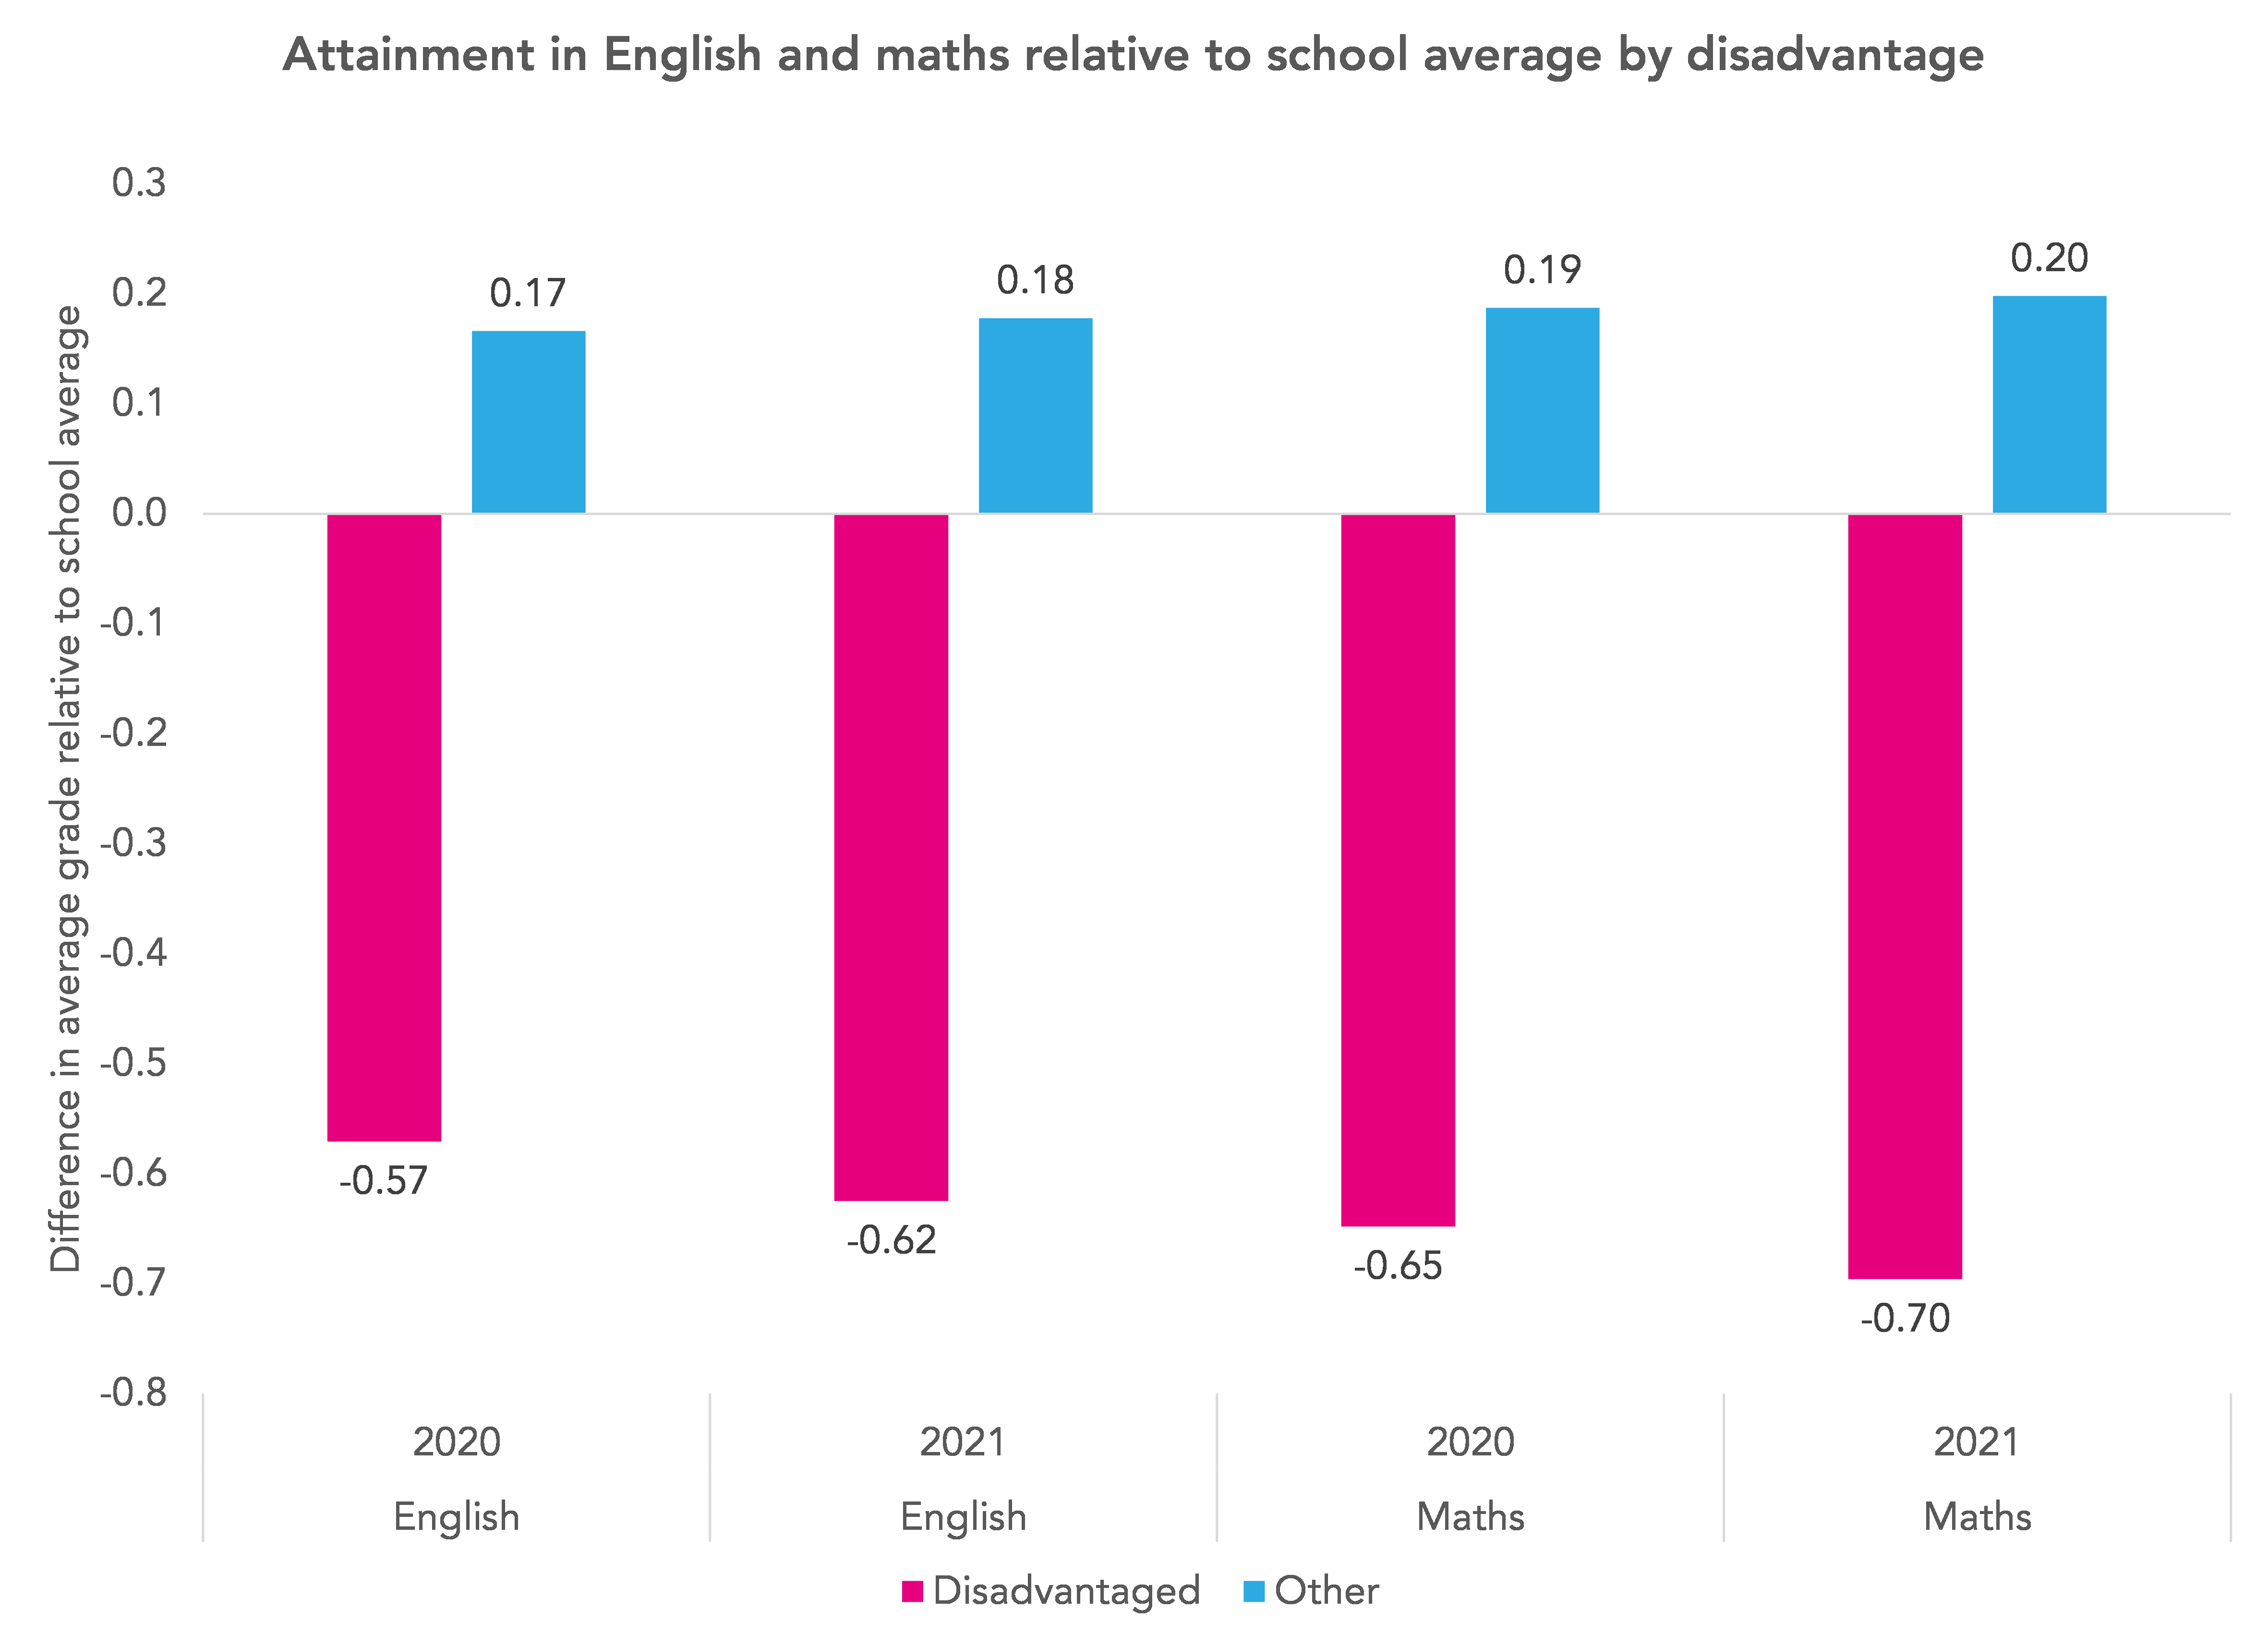
In English, we see an increase in the gap of 0.07 grades between 2020 and 2021 and in maths of 0.06 grades. These compare to changes in the national gap of 0.1 grades and 0.08 grades respectively.
In other words, most of the increase seems to have been driven by within-school changes.
Summary
This is a very quick piece of analysis using data we’ve collected from a sample (albeit a large sample) of schools.
But if this data is representative of all schools, then it is likely that we will see an increase in the disadvantage gap when DfE publishes its Key Stage 4 statistics in the Autumn.
The change appears to be largely driven by differences within school, in other words, disadvantaged pupils receiving lower grades compared to their peers at the same school.
- Although grades awarded in 2020 were the highest of the grade provided by the school or the abandoned Ofqual algorithm.
- Weighted by numbers of FSM6 and other pupils at each school


A quick question, which English data is used for this? Is it just Language and Literature, Just language or the best of the two?
Hi Craig. It would have been the best of lang or lit.
I have read this post with interest but have limited knowledge of the technicalitiies involved in the caculation of the depivation index gap and wonder if you can help me. I have also read the DfE technical paper on this topic from around 2015 where the authors refer to “Scaling the Disadvantaged Pupils Attiainment Gap Indicator to a base of 10” and arrive at figure of 3.16
My question is when the recent DFE publications of Key stage 4 data show a deprivation index gap of about 3 are they referring to a gap measured in terms of diferences in point score In English and Maths as per your article or to a disdavantaged pupils attainment gap scaled to a base of 10? Thank you
Hi Russell. As far as I know, the gap index represents the difference in average ranks (based on English and maths grades combined) between FSM6 pupils and their peers. The 2022 KS4 value of 3.84 implies a 3.84/20 = 0.192 difference in average ranks.
Hi Dave Thanks very much for your [rpmpt and very helpful reply