* This post has now been superseded by more recent analysis
* updated 16th September 2021. I added the final paragraph which offers a possible explanation for the discrepancy between the figures reported.
In previous years, disadvantage funding under the Pupil Premium had been allocated based on the number of pupils eligible for free school meals in the six years up to January of each year (FSM6).
However, a change was made this year and it was allocated based on those eligible in the six years up to the previous October.
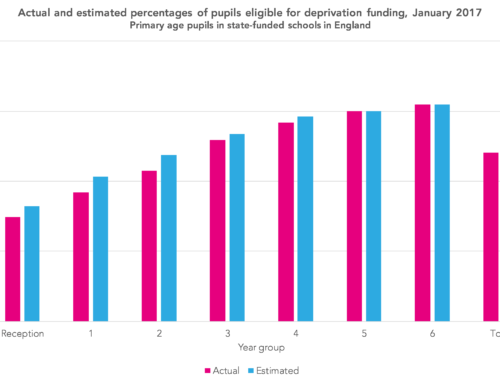
At a time when free school meal eligibility is rising, this resulted in some 62,000 pupils not being included and a loss of funding of almost £90 million for schools according to Department for Education figures.
Yesterday, DfE responded to an FOI request for the number of FSM6 pupils at each school in January 2021.
We can link this data to the pupil premium funding allocation data published by DfE based on School Census up to October 2020.
This gives an indication of how many additional FSM6 pupils there were at each school in January and therefore how much funding schools have missed out on.
You can access the spreadsheet here. [1]
According to these figures, there appear to be almost 104,000 additional FSM6 pupils with a consequent loss of funding of almost £133 million.
The worst affected school appears to be NCEA Bishop’s Primary School in Northumberland, which saw an increase of 66 FSM6 pupils between October and January, missing out on £88,000 as a result.
Of course, this takes the FOI request figures at face value. It may be the case that the FSM6 figures include looked after children and children who ceased to be looked after (who are funded separately) so the number of 62,000 pupils missing out on pupil premium funding may well be right.
- This includes all schools including in the 2021/22 funding allocation spreadsheet, linked via URN to the January 2021 FSM6 data.


thanks Dave, very interesting.
I was looking through “my” LA schools and noticed some of the winners (gained funding) were some of the less deprived schools, although the converse wasn’t so clear.
Back of an envelope but: I matched your xls to the latest OFSTED management info for IDACI quintile of school and ,although the correlation is relatively weak, the average funding loss for each IDACI band suggests there is a possible bias towards the poor getting poorer. I struggle to see why this tendency would be inevitable, unless there’s something around school size and deprivation or pupil-sorting through exclusions in the first term, or other mobility effect. I wonder if you think it worthwhile to cast your expert eye over the data with that possible correlation in mind?
Thanks Chris! Do you mean that schools in disadvantaged areas have tended to lose out more? If so, that makes sense. FSM eligibility has been rising, so would we not expect it to increase in more in the more disadvantaged areas?