Although the Department for Education publishes a comprehensive (if somewhat untimely) set of statistics related to suspensions and permanent exclusions each year, they do not give much of a sense of how many pupils experience either during their school career.
In this blogpost, we track the permanent exclusion and suspension [1] histories of two cohorts of young people two cohorts of young people: those who were enrolled in state schools in Year 1 in January 2009, and those who were enrolled in state schools in Year 1 in January 2010. We’ll follow these two cohorts from Year 1 to Year 11. These cohorts would have reached the end of Year 11 in either 2019 or 2020.
For the purposes of this analysis we do not include any pupils who join the cohort, for example pupils who move into English schools from overseas after Year 1.
How many pupils experience suspension or permanent exclusion during compulsory schooling?
The table below shows that, in both cohorts, around 15% of pupils experienced a suspension and 1% a permanent exclusion. 91% of the cohort was observed to attend a state school (mainstream, special or AP school) in Year 11. The remainder may have been overseas, in independent schools or in home education.

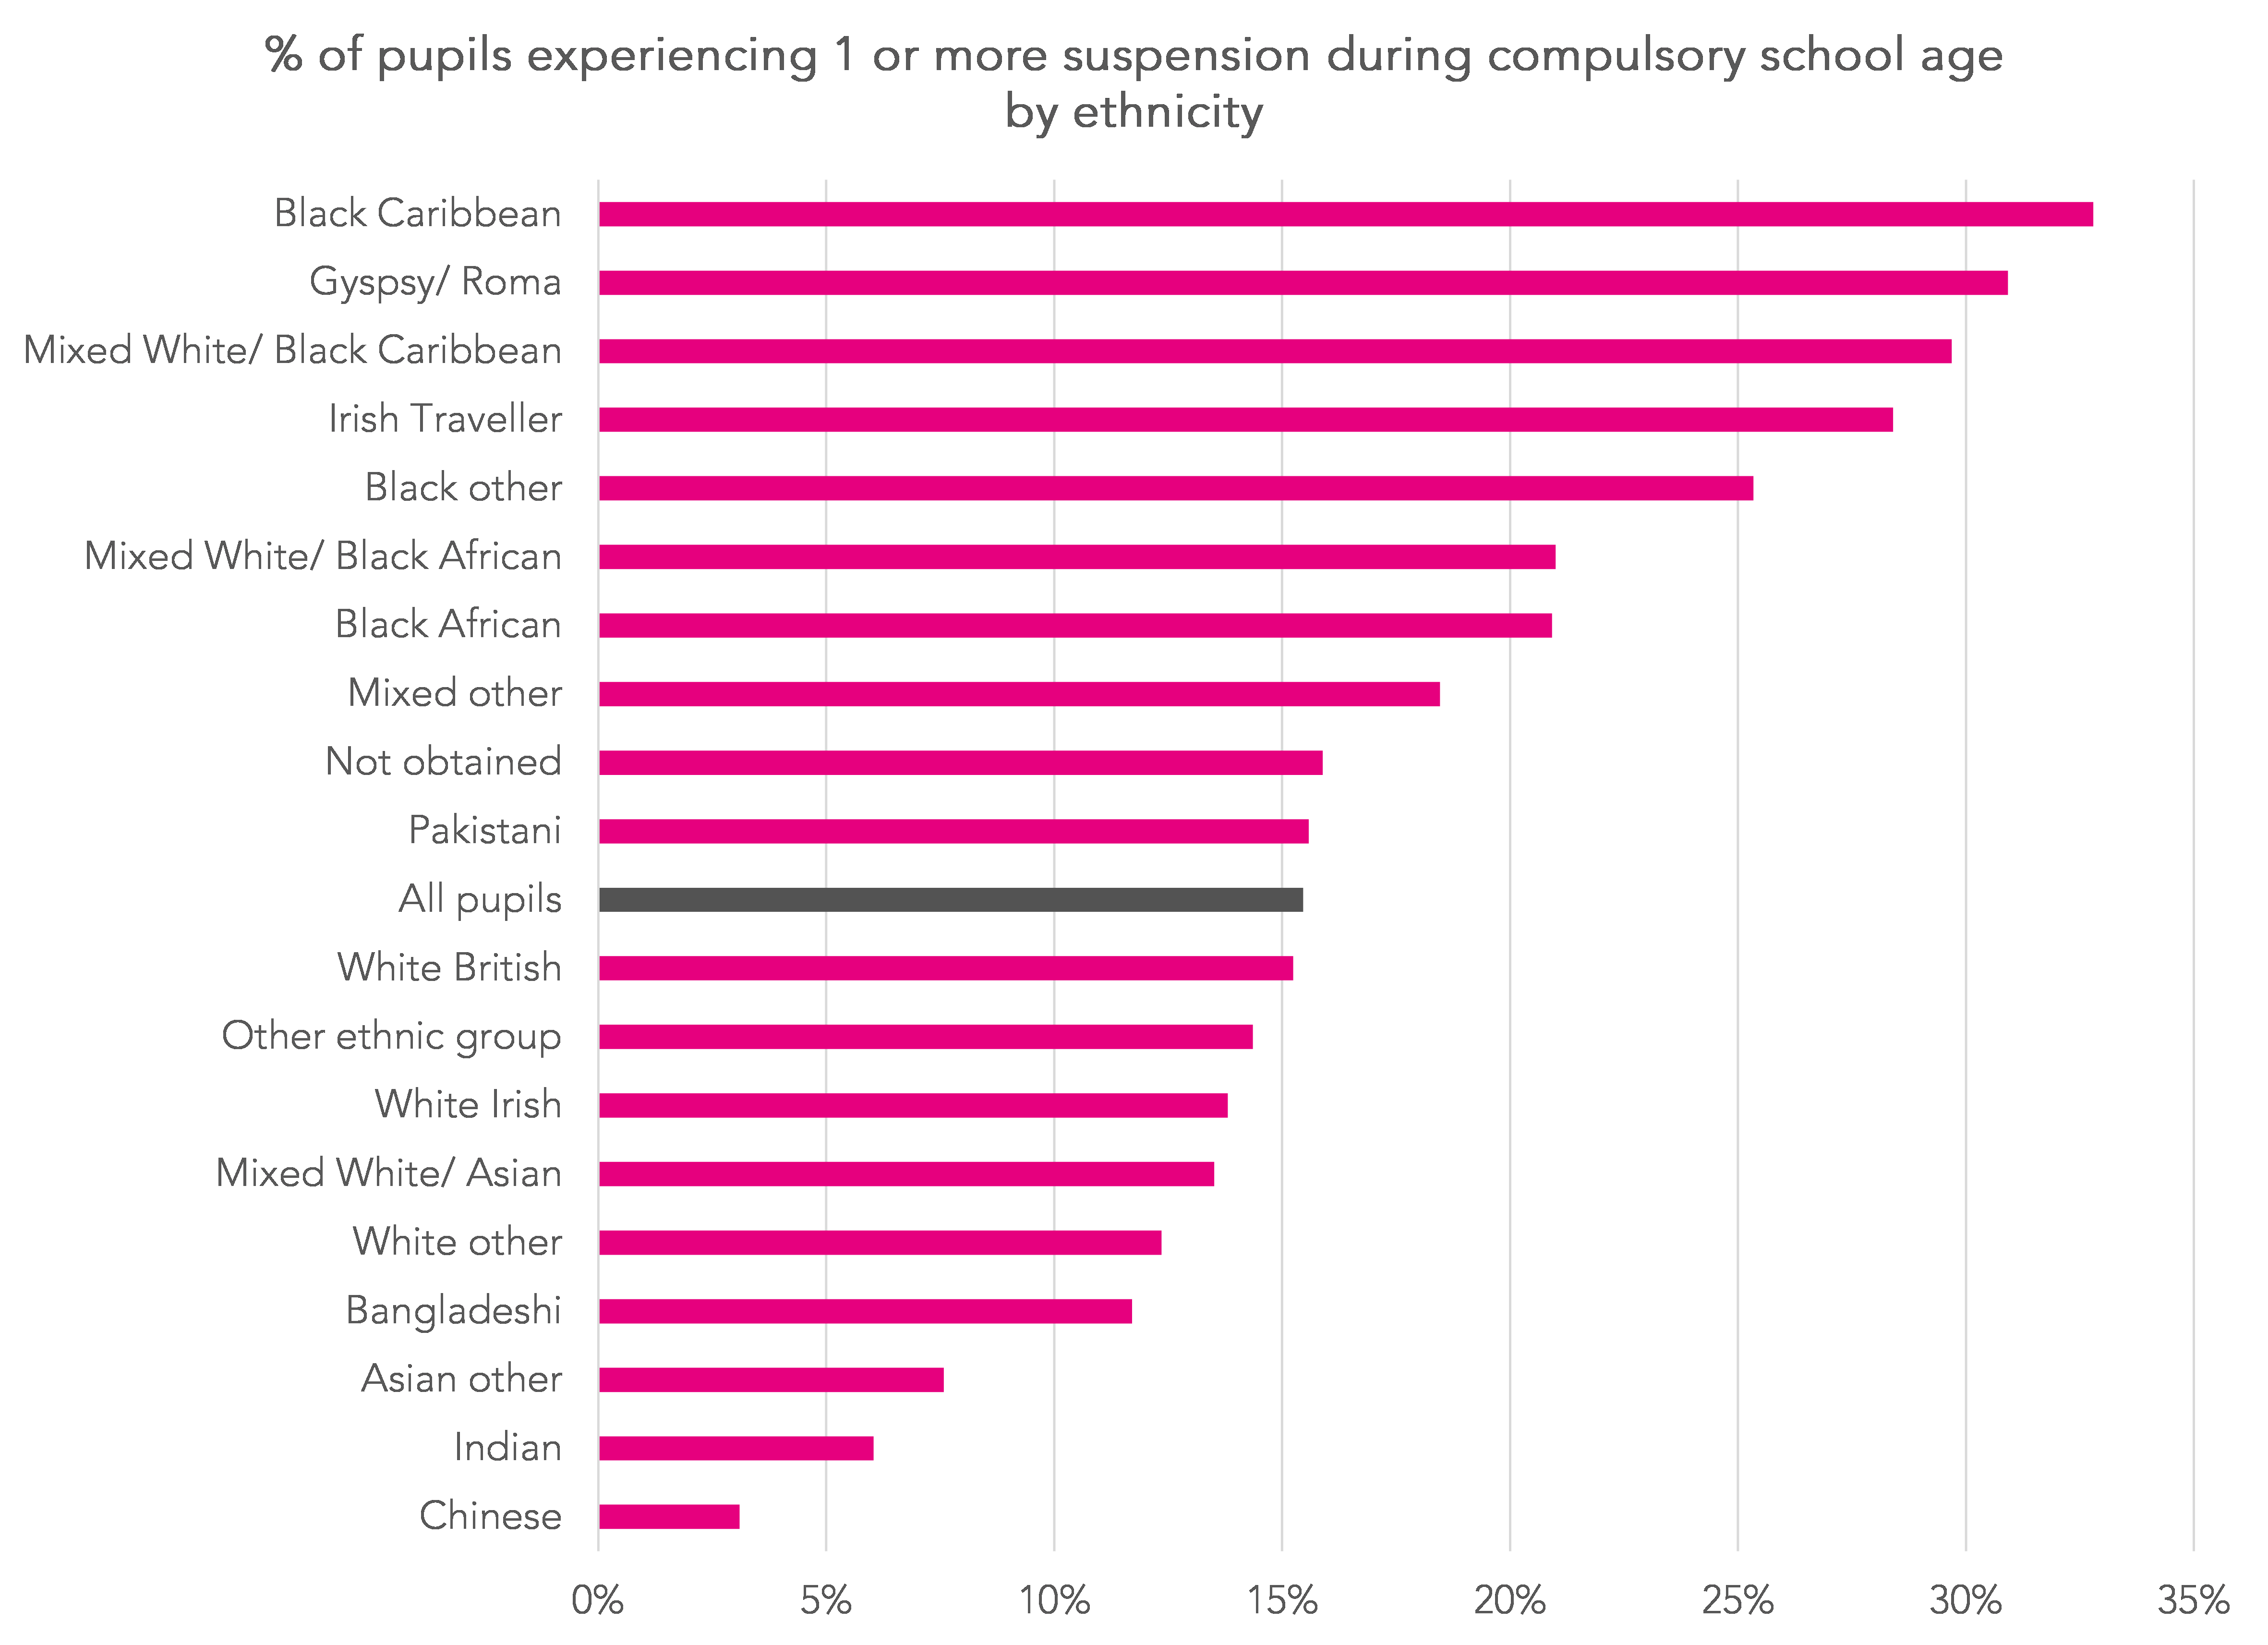
As the Timpson Review of school exclusion showed, there is disproportionality with respect to ethnicity. Whereas 15% of pupils experienced a suspension, this rate exceeded 20% among Black Caribbean, Mixed White/ Black Caribbean, Gypsy/ Roma, Irish Traveller, Black other, Black African and Mixed White/ Black African groups.
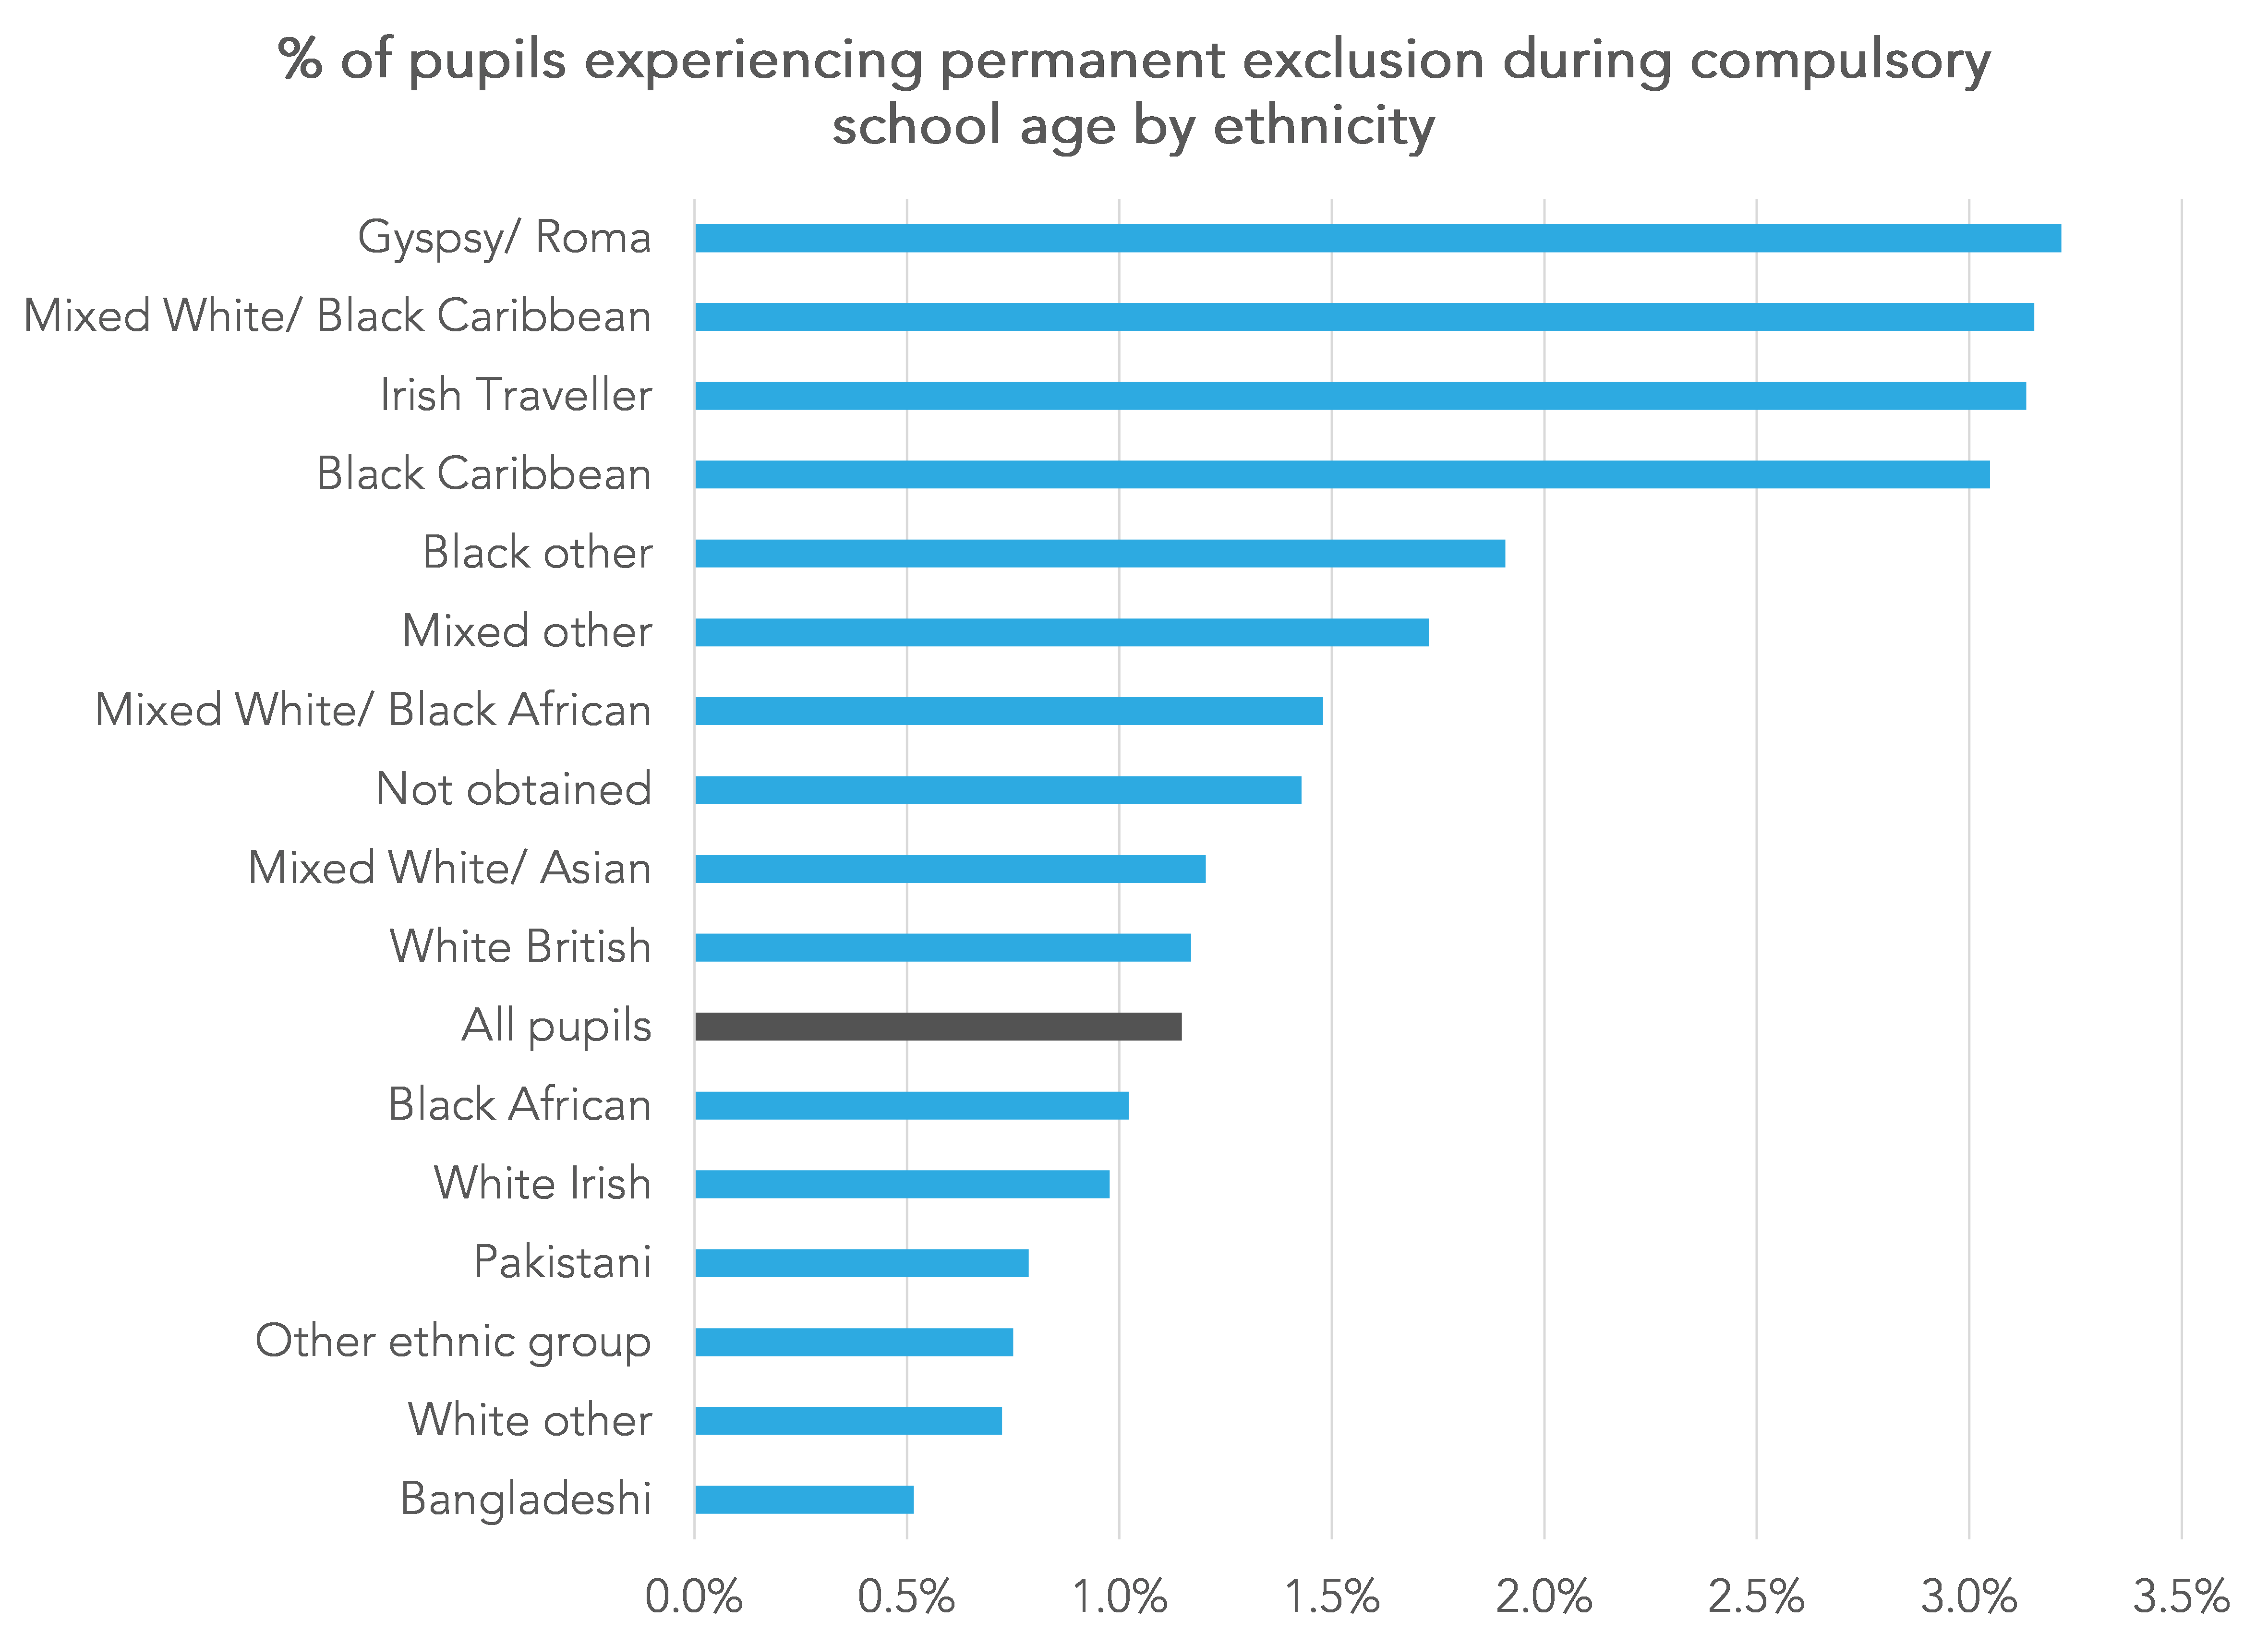
The same sort of pattern is evident for permanent exclusions although rates for Black African and Mixed White/ Black African groups are broadly in line with the average. Note that bars for Indian, Chinese and Other Asian pupils have been suppressed due to small numbers.
When do pupils first experience suspension or permanent exclusion?
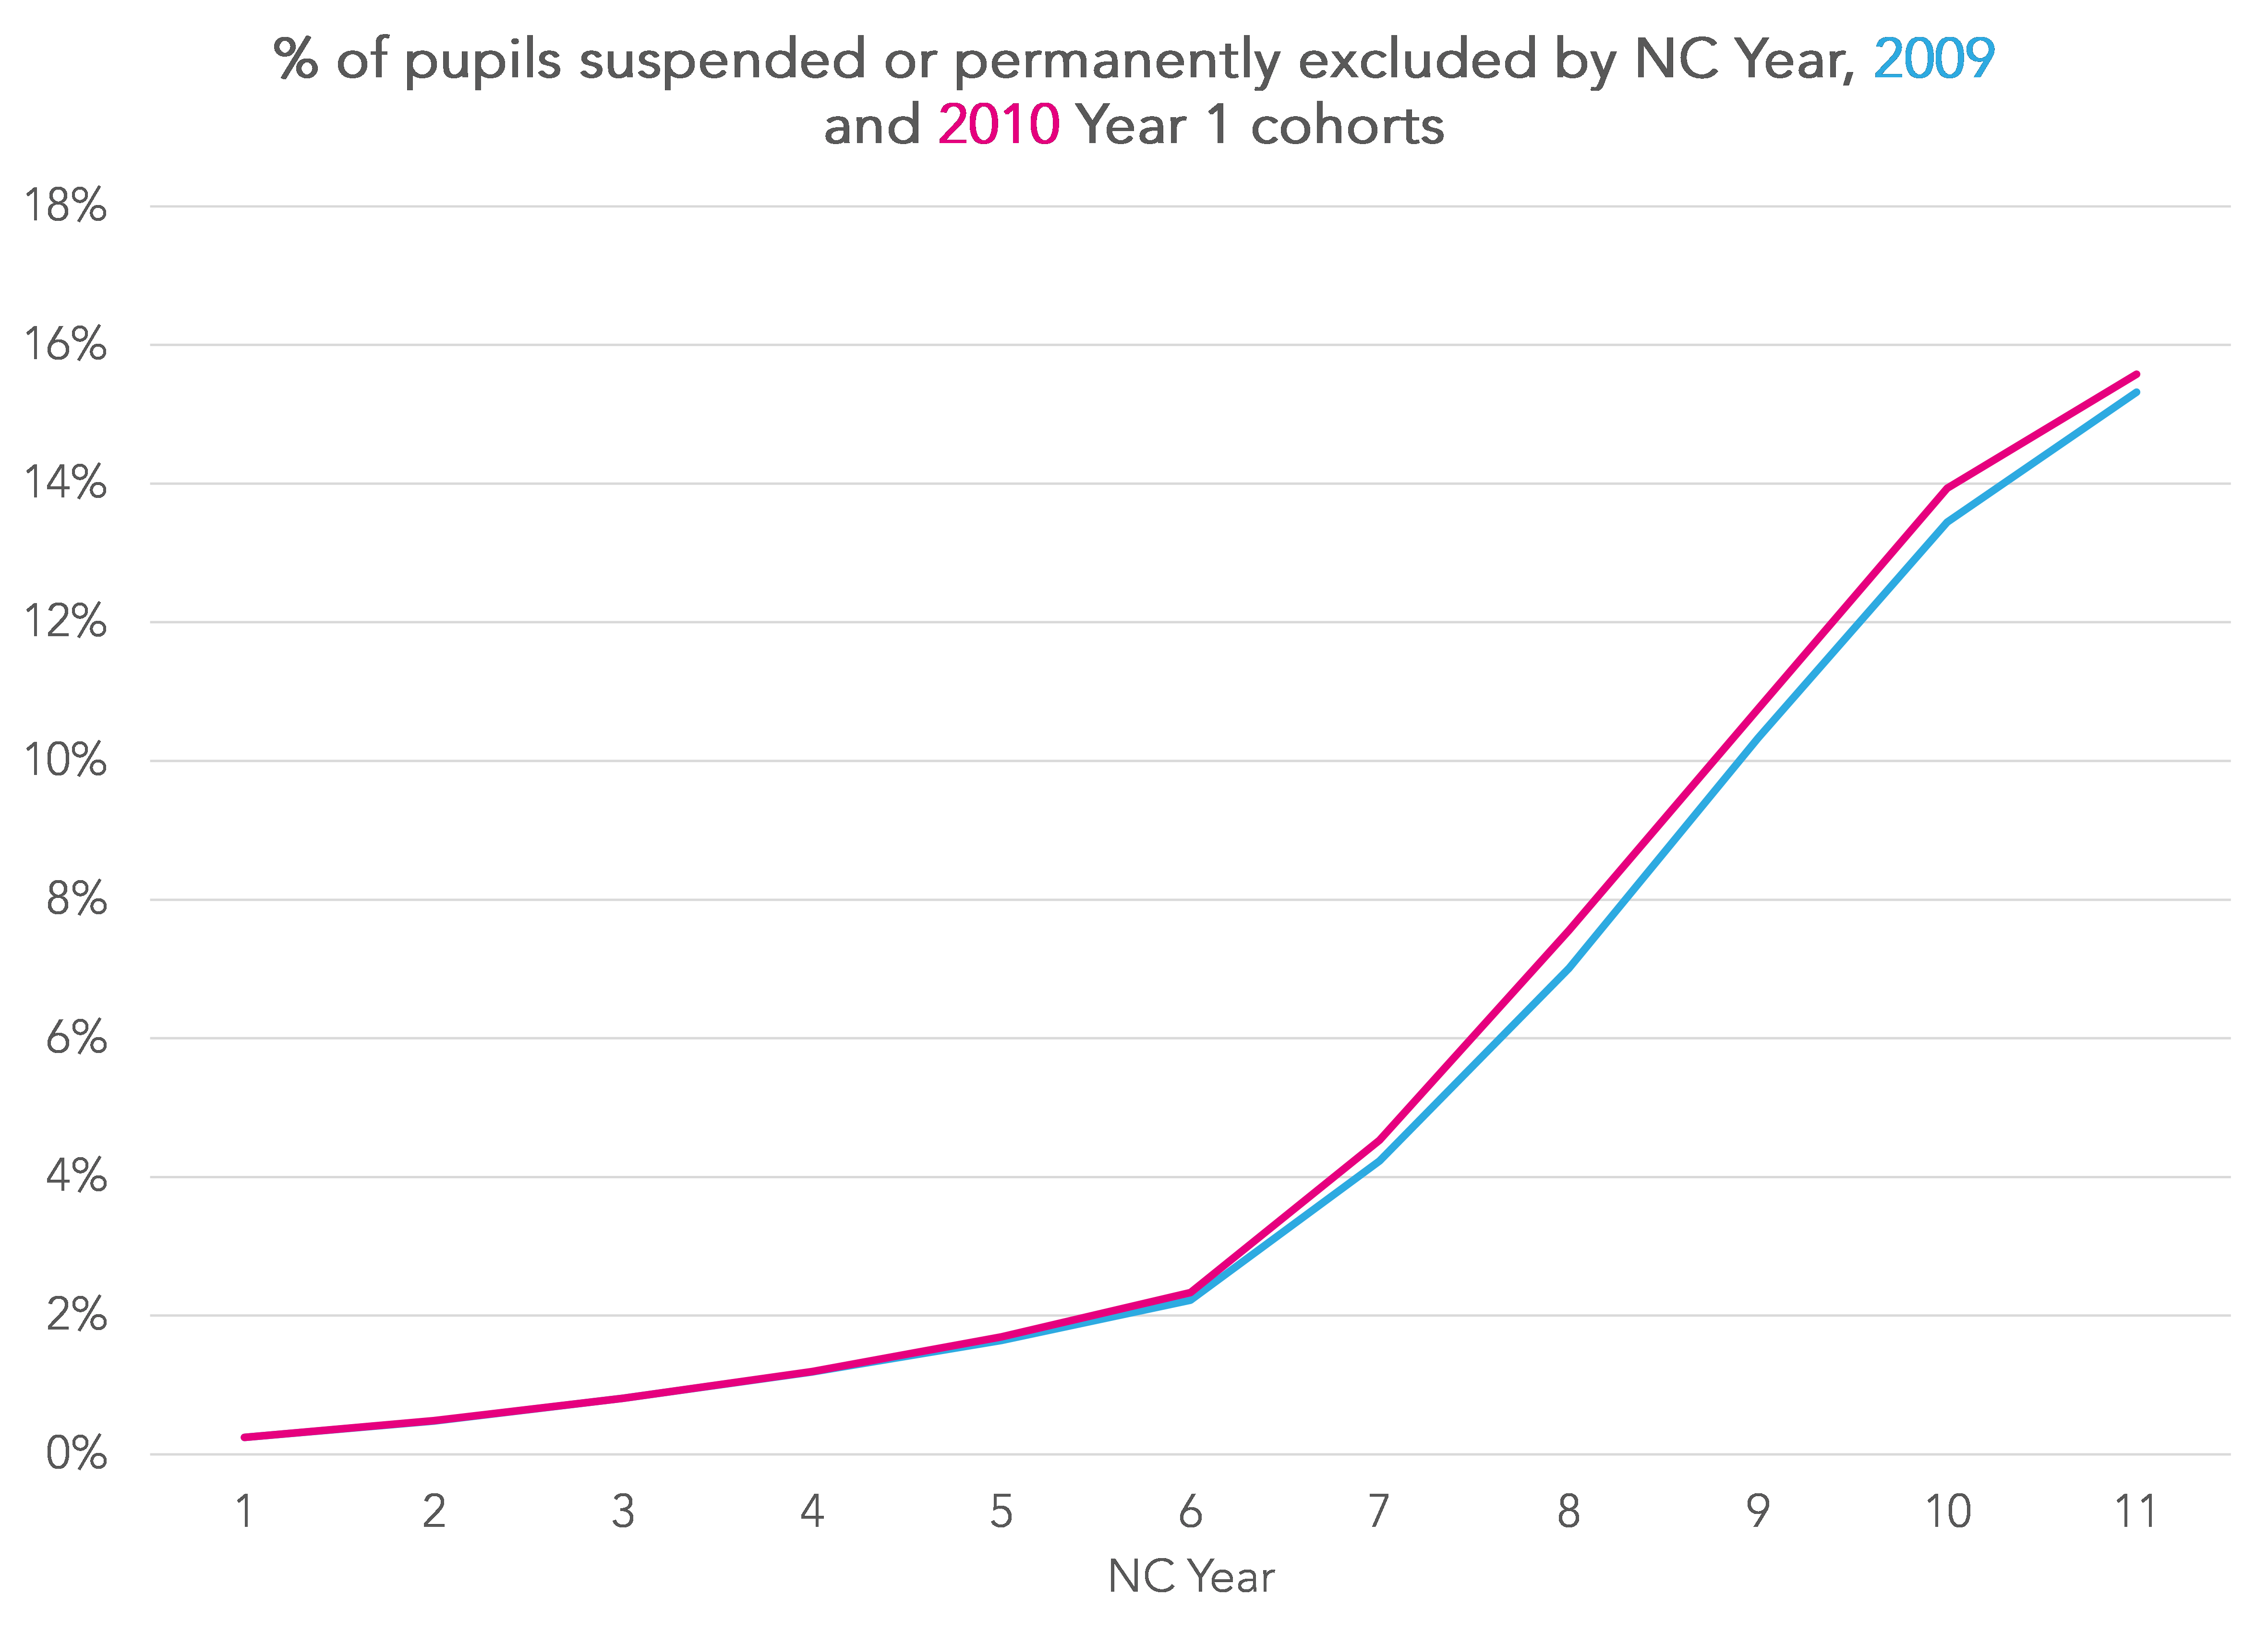
For both cohorts, around 2.3% of pupils had experienced a suspension or permanent exclusion by the end of primary school (Year 6). This rate then increases by around 2 percentage points per year up to the end of Year 10. By the end of Year 11, 15.3% of the 2009 cohort and 15.6% of the 2010 cohort had experienced a suspension or permanent exclusion.
The vast majority of pupils who experience an exclusion (suspension or permanent exclusion) during the primary years will experience at least one more during their school career. The majority also experience an exclusion during their secondary school career although it is also clear from the table below that some don’t.

Repeated exclusions
In total, the 1.1 million pupils across both cohorts experienced 739,000 exclusions from Year 1 to Year 11. There are reasons to think this is an under-estimate. For example, exclusions are not collected for the final two terms of schools that close, including those that become sponsored academies.
Leaving that aside, the table below shows that 2% of pupils in each cohort experienced 9 or more exclusions during their school career. Almost half of the total number of 739,000 exclusions relate to these pupils.

Similarly, 5% of pupils experience 4 or more exclusions during their school career. Over 75% of the total number of exclusions relate to these pupils.
This analysis suggests two things if we want to reduce suspensions and permanent exclusions. Firstly, past behaviour predicts behaviour. Pupils who experience exclusion will tend to be excluded again. Secondly, a large proportion of exclusions relate to individuals who have (or who will go on to have) a history of repeated exclusion while at school.
- Suspensions were previously called fixed-term exclusions
Want to stay up-to-date with the latest research from FFT Education Datalab? Sign up to Datalab’s mailing list to get notifications about new blogposts, or to receive the team’s half-termly newsletter.


Do you have data to show the respective percentages of the population that come from each of the ethnic groups listed to give a complete picture of both the proportion and the absolute number of pupils excluded from different ethnic groups?
Yes- good point. I’ve uploaded the underlying data here https://ffteducationdatalab.org.uk/wp-content/uploads/2022/05/underlying_data_charts.xlsx
Thank you so much Dave – this is really helpful and shows that early intervention really does does need to start early (Year 1 suspensions/exclusions) to try and turn the curve. It would be good to understand regional variations and/or use the data as a benchmarking tool for individual local authorities.
Is there any data to show the split of schools, esp at secondary e.g. academies, free school and LA schools?
DfE publishes this for cross-sectional data (e.g. all cohorts in 2020)- see for example https://explore-education-statistics.service.gov.uk/data-catalogue/permanent-and-fixed-period-exclusions-in-england/2019-20. Doing this with panel data is a bit trickier given a) pupils moving between schools and b) schools changing their governance status over time.
Presumably, as ever, if I read you right, if schools, social care & communities can sort out the issues and misconduct of the recidivist 2% and 5% (end paragraphs) then exclusions can drop. Highlighting again that it is a small number of people who take up the vast majority of resource & time in this way. Much investment needed and early to sort it out.
Really interesting to see this longitudinal analysis. Much to ponder here
Thanks very much Nick. Yes, I think that’s what I take from it.
Is there analysis to explore how likely repeat exclusion is over time. I.e. One you have been excluded, for each subsequent year what is the probability of another suspension?