We’ve written a lot about attendance throughout the pandemic. From general overviews to scrutiny of Government initiatives and suggestions for how we might account for COVID in measures of persistent absence.
In all of these posts we’ve only been able to use data from English schools using Attendance Tracker. But from today, we’re pleased to be able to enhance the picture. We now have pupil attendance data from around 70 state-funded secondary schools in Wales – that’s around a third of the country’s secondary schools (including special)[1].
Notwithstanding differences in approaches to managing the pandemic between the two administrations, it suggests that the impact of COVID on pupil absence has been much greater in Wales than in England.
Absence over the year so far
To start, let’s compare weekly absence figures for England and Wales. As usual, we include sessions missed due to COVID isolation as absences[2]. We don’t include sessions missed due to school closures[3].

Although the patterns are similar, absence was higher in Wales compared with England throughout the year. The biggest differences were in the first few weeks of the academic year, and the smallest in the weeks following the Christmas break. Since May half-term, absence has been around five percentage points higher in Wales than in England.
When we plot the overall percentage of sessions missed over the academic year by year group, we see a similar story:
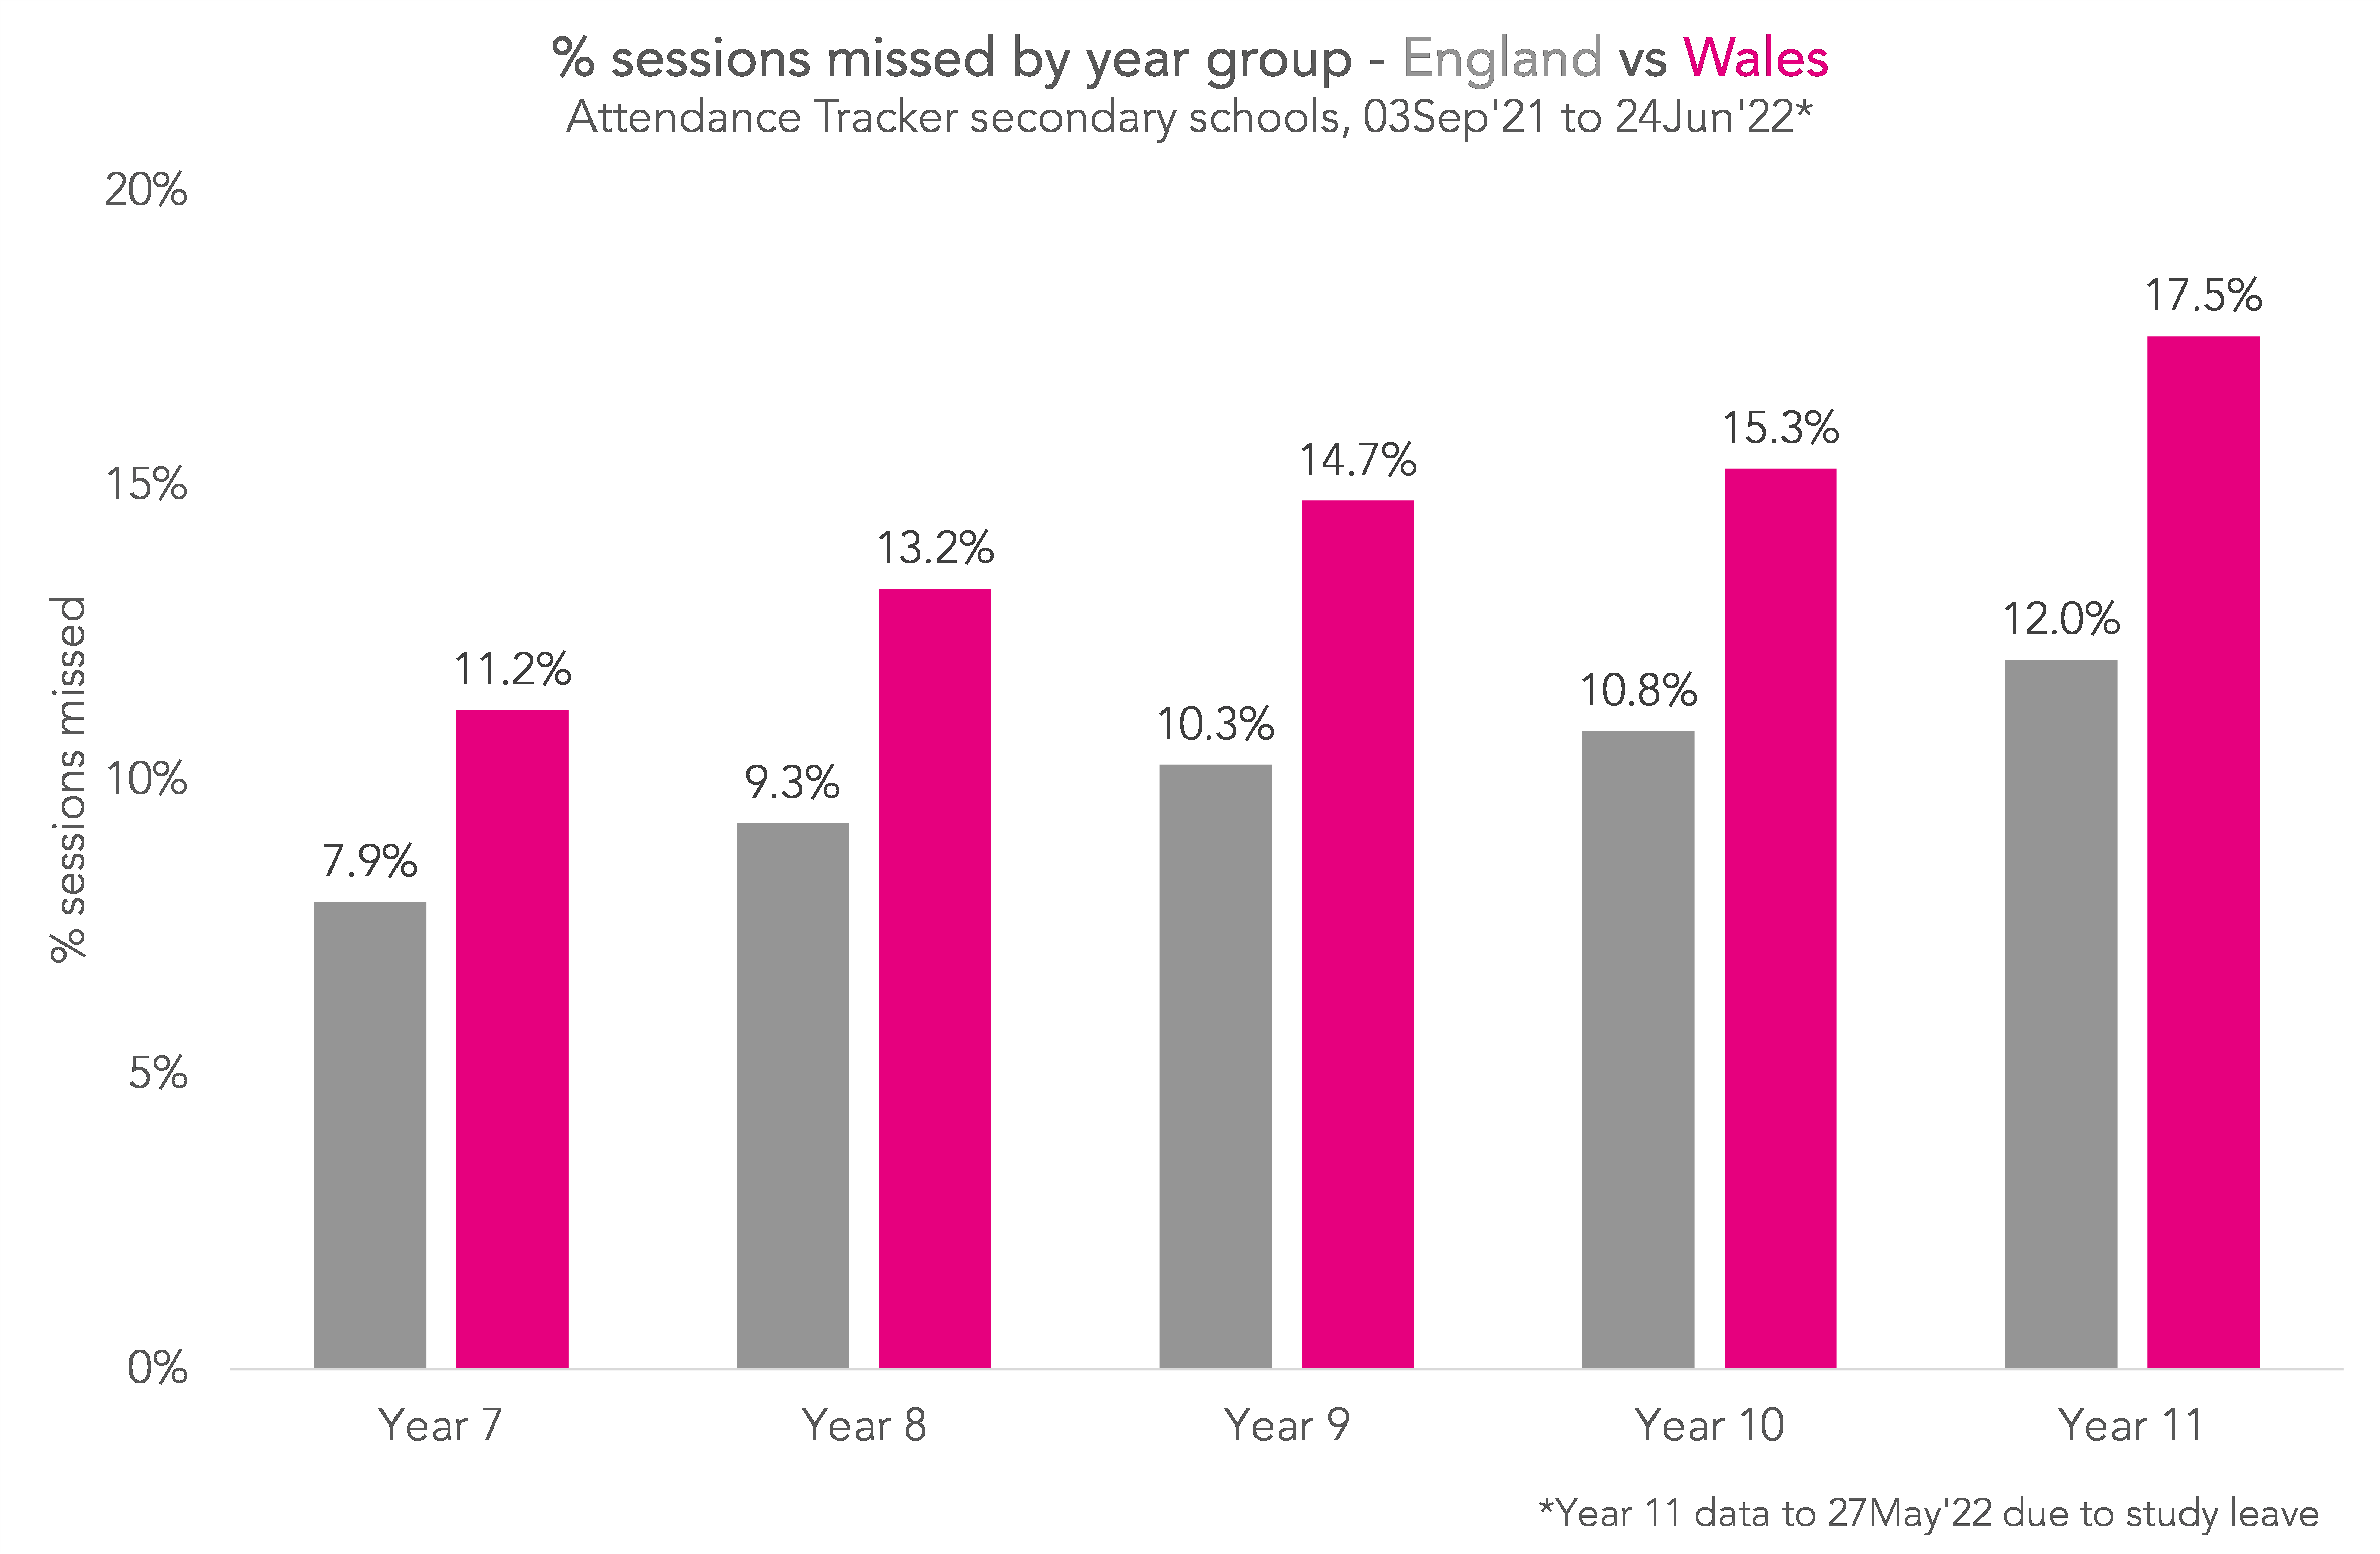
In all year groups, pupils in Wales missed more school than in England. The difference was smallest in Year 7 at 3.3 percentage points (pp) and largest in Year 11 at 5.5pp.
For context, that 5.5pp difference between Year 11 pupils in Wales and England is bigger than the 4.1pp difference between Year 7 and Year 11 pupils in England.
Why is absence higher in Wales?
There are a few possible explanations.
Firstly, we have data from a smaller proportion of secondary schools in Wales than England. Perhaps our sample of Welsh schools is suffering from bias. But our figures broadly agree with those in the Welsh Government’s weekly attendance updates, which have also shown consistently higher rates of absence in Wales than England. And absence was higher in Wales than England pre-pandemic too (6.2% vs 5.5% for secondary schools in 2018/19). So we’re fairly happy the difference is genuine.
Maybe then we’re just not making a fair comparison. After all, demographics in some regions of England are very different to Wales. To address that (to an extent) let’s compare absence in Wales with just the North East of England – similar in terms of population size, deprivation and ethnicity.

Differences in absence are smaller, but they’re still big enough to be curious about. Pupils in Year 7 missed 2.5pp more sessions, on average, in Wales compared with the North East, and in Year 11 they missed 5.4pp more.
To investigate further, we can look at the reasons behind the absences. Below, we plot the proportion of sessions recorded in our Attendance Tracker schools’ registers as being missed due to:
- illness (COVID or otherwise),
- COVID isolation,
- any other authorised circumstances (for example, medical appointments), and
- any unauthorised circumstances or where circumstances have yet to be established – because we’re using data right up to the end of last week, this proportion will be overstated while schools chase up pupils’ reasons for absence.

We see that the main contributors to higher absence levels in Wales were illness and unauthorised absence. Absence for these two reasons combined was around 3.5pp higher in Wales than in England. The next biggest contribution was from other authorised absences, which were 0.8pp higher in Wales. Absence due to COVID isolation was actually slightly lower in Wales than in England – by 0.2pp. But we think this might just be a product of variation in attendance recording between the two countries[4].
Persistent absence
To finish, let’s look at persistent absence. In England, this is defined as the percentage of pupil enrolments with at least 10% of sessions missed. In Wales, it’s at least 20% of sessions. To get a full picture, we’ll plot the percentage of pupils who missed at least 10%, 20%, 30%, 40% and 50% of sessions. We’ll split the results by country and by year group.

As we saw with overall absence levels, persistent absence was higher in Wales than in England. And the differences were bigger in older year groups than younger. 26.4% of Year 11 pupils in Wales missed at least 20% of sessions – the equivalent of at least a day a week – compared with 16.1% in England.
Summing up
COVID appears to have affected pupils in Wales more than those in England. Absence and persistent absence rates were higher in Welsh secondary schools than English ones this year.
This seems to have mostly been driven by a higher rate of sickness and unauthorised absence. Rates of pupils isolating without having tested positive for COVID are broadly similar between the two countries.
The difference in absence between the two countries was biggest among Year 11 pupils. This may have an effect on GCSE grades awarded this summer.
1. Compared with English secondaries where we have data from 2,600 schools – around 75% of the total.
2. Sessions coded as ‘X’ in England – including the relevant sub-codes – and as ‘[‘ in Wales.
3. Sessions coded as ‘Y’ in England and Wales.
4. We treat absences coded as ‘X’ in England and ‘[‘ in Wales as COVID isolation, and ignore code ‘Y’. In English schools this is only used for full or partial school closures, and would contribute < 0.001% to overall absence if we were to include it. In Wales, ‘Y’ is used for any “school-directed absence” which includes instances where a school “identifies the need for learners to self-isolate due to a confirmed case in school,” as well as full or partial school closures. If we included code ‘Y’ for Wales, it would add an extra 0.2% to overall absence. So, if we included code Y, then isolation absence would be similar in England and Wales.


I wondered if poor mental health might be a contributing factor and whether that might differ between England and Wales. Availability of support services may differ. Anecdotally mental health issues seem to be more of a factor in KS4 than KS3 pupils.
Hi Naomi. Interesting! Though Wales’ primaries had higher absence rates than England’s pre-pandemic too, and we tend to see a lower incidence of mental health problems at those ages (see, e.g. this, which also confirms your anecdotal evidence on KS4 vs KS3.) Doesn’t mean it couldn’t be a contributing factor though.
I forgot to say thank you for the very clear report!