This week marks the launch of the next generation of FFT’s data analytics system – Aspire.
Amongst a whole host of improvements and new features, one of the most significant updates is a brand-new Target Setting module incorporating FFT’s well known ‘estimates’ data.
After 20 years, we still get asked more questions about FFT estimates than anything else. So we thought it would be a good time to talk about where the estimates actually come from, and some of their uses and limitations.
What is an FFT estimate?
For the uninitiated, an FFT estimate is an end of key stage outcome assigned to each pupil in each subject. Schools use these estimated outcomes to benchmark the current performance of pupils who will take end of key stage tests in future.
At Key Stage 1 and Key Stage 2, estimates take the form:
- Above expected standard
- Expected standard
- Working towards the expected standard
- Below the expected standard
This single “FFT estimate” outcome descriptor actually summarises a distribution of outcomes. A particular pupil is estimated to have an x% chance of being classified as “Above the expected standard”, a y% chance of being classified as “expected standard”, etc. The single outcome estimate is the mid-point of that distribution.
Alongside this, schools also receive an estimated scaled score.
How are estimates calculated?
In short, we look at the range of outcomes achieved by similar pupils who took end of key stage tests in the past.
When we say “similar pupils” we mean pupils with the same prior attainment, gender and month of birth.
And when we say “range of results” we mean the percentage of pupils classed as “above expected standard”, “expected standard” etc.[1]
The estimates currently in Aspire use 2019’s end of key stage results. The reason for not using 2022’s results is that it was a bit of a weird year. Tests were held without adaptations so that results could be compared with pre-pandemic results. And so, unsurprisingly, attainment dipped. This means that if we used the most recent data to produce estimates they would likely be too low. We plan to update the estimates next Autumn when we receive Key Stage 1 and 2 data for 2023.
Different measures of prior attainment
Historically, we produced Key Stage 2 estimates using Key Stage 1 results as the measure of prior attainment. But because Key Stage 1 tests were cancelled in 2020 and 2021 (the current Years 4 and 5) we include a further flavour of Key Stage 2 estimate based on early years foundation profile assessments. This works because both Key Stage 1 and EYFSP attainment are correlated with overall Key Stage 2 attainment (around 0.8 for KS1 and 0.6 for EYFSP).
Key Stage 1 estimates are produced using EYFSP results as the measure of prior attainment. As these tests were also cancelled in 2020 and 2021, we’ve only been able to produce Key Stage 1 estimates for current Year 2 pupils in schools who submitted their EYFSP results to us.
Whatever the measure of prior attainment, we always put it on a standardised scale before we use it in our model.
Limitations
The model that we use to create estimates is relatively simple. One of its strengths is that any two pupils with the same prior attainment, gender and date of birth will have the same estimate for a given subject. It isn’t influenced by their personal circumstances or expectations of them.
However, this is one of its limitations too, because we know that, on average, particular groups of pupils have lower outcomes than others. We show some examples in the chart below.
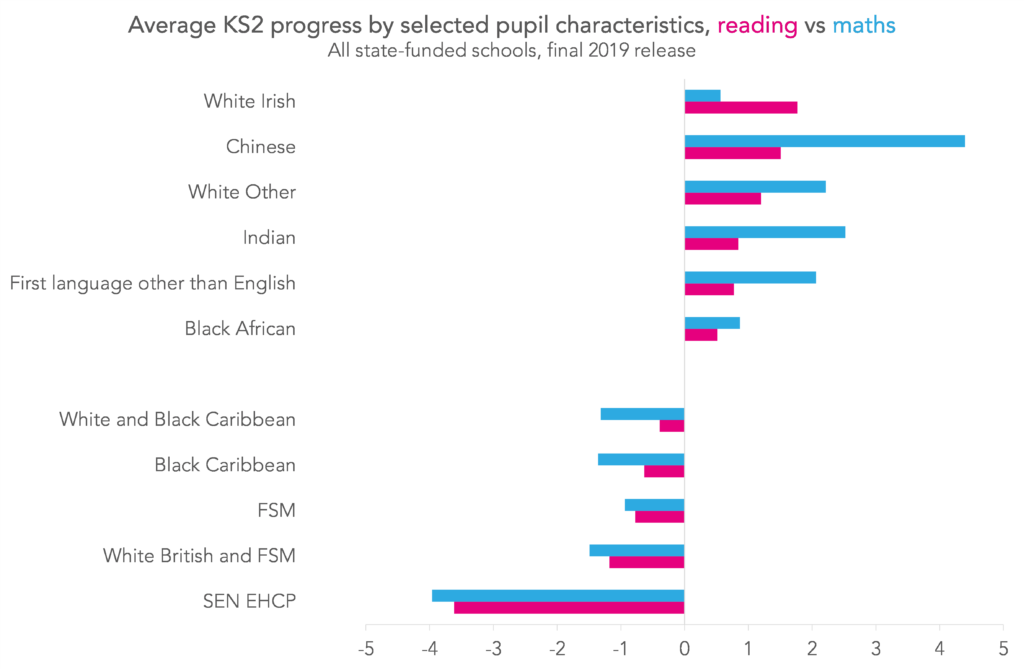
This means that certain groups of pupils are more likely to exceed their estimates, and others are more likely to fall short.
This is why, if you’re analysing the performance of a group of pupils, it’s just as important to look at context as it is estimates (Looking at school-level performance in context was the reason for Schools Like Yours).
This is also one of the reasons why FFT estimates should not be thought of as predictions.
Summing up
We know that school performance benchmarking can seem like a bit of a “black box”. And we hope this has taken away some of the mystery.
If you’re lucky enough to work in one of our Aspire schools, you can view estimates for your pupils in the first release of the next generation system now.


Leave A Comment