In this blogpost, I’m going to look at what happens to pupils who have been permanently excluded.
How many of them are re-integrated into mainstream schools after exclusion?
Data
I’ll be using data from National Pupil Database on permanent exclusions from the 2018/19 academic year, the final full academic year to have been unaffected by the COVID-19 pandemic.
Published DfE statistics show that there were 7,894 permanent exclusions that year, which corresponds to 0.1% of the school population.
We link the pupils to subsequent January School Census records in the following 3 academic years (2020, 2021 and 2022).
We also use the corresponding Local Authority Alternative Provision Census. This contains information on provision outside the state-funded school system, such as independent schools, FE colleges and tuition, where the local authority pays fees.
Destinations of permanently excluded pupils.
Firstly, let’s recap the number of exclusions by age.
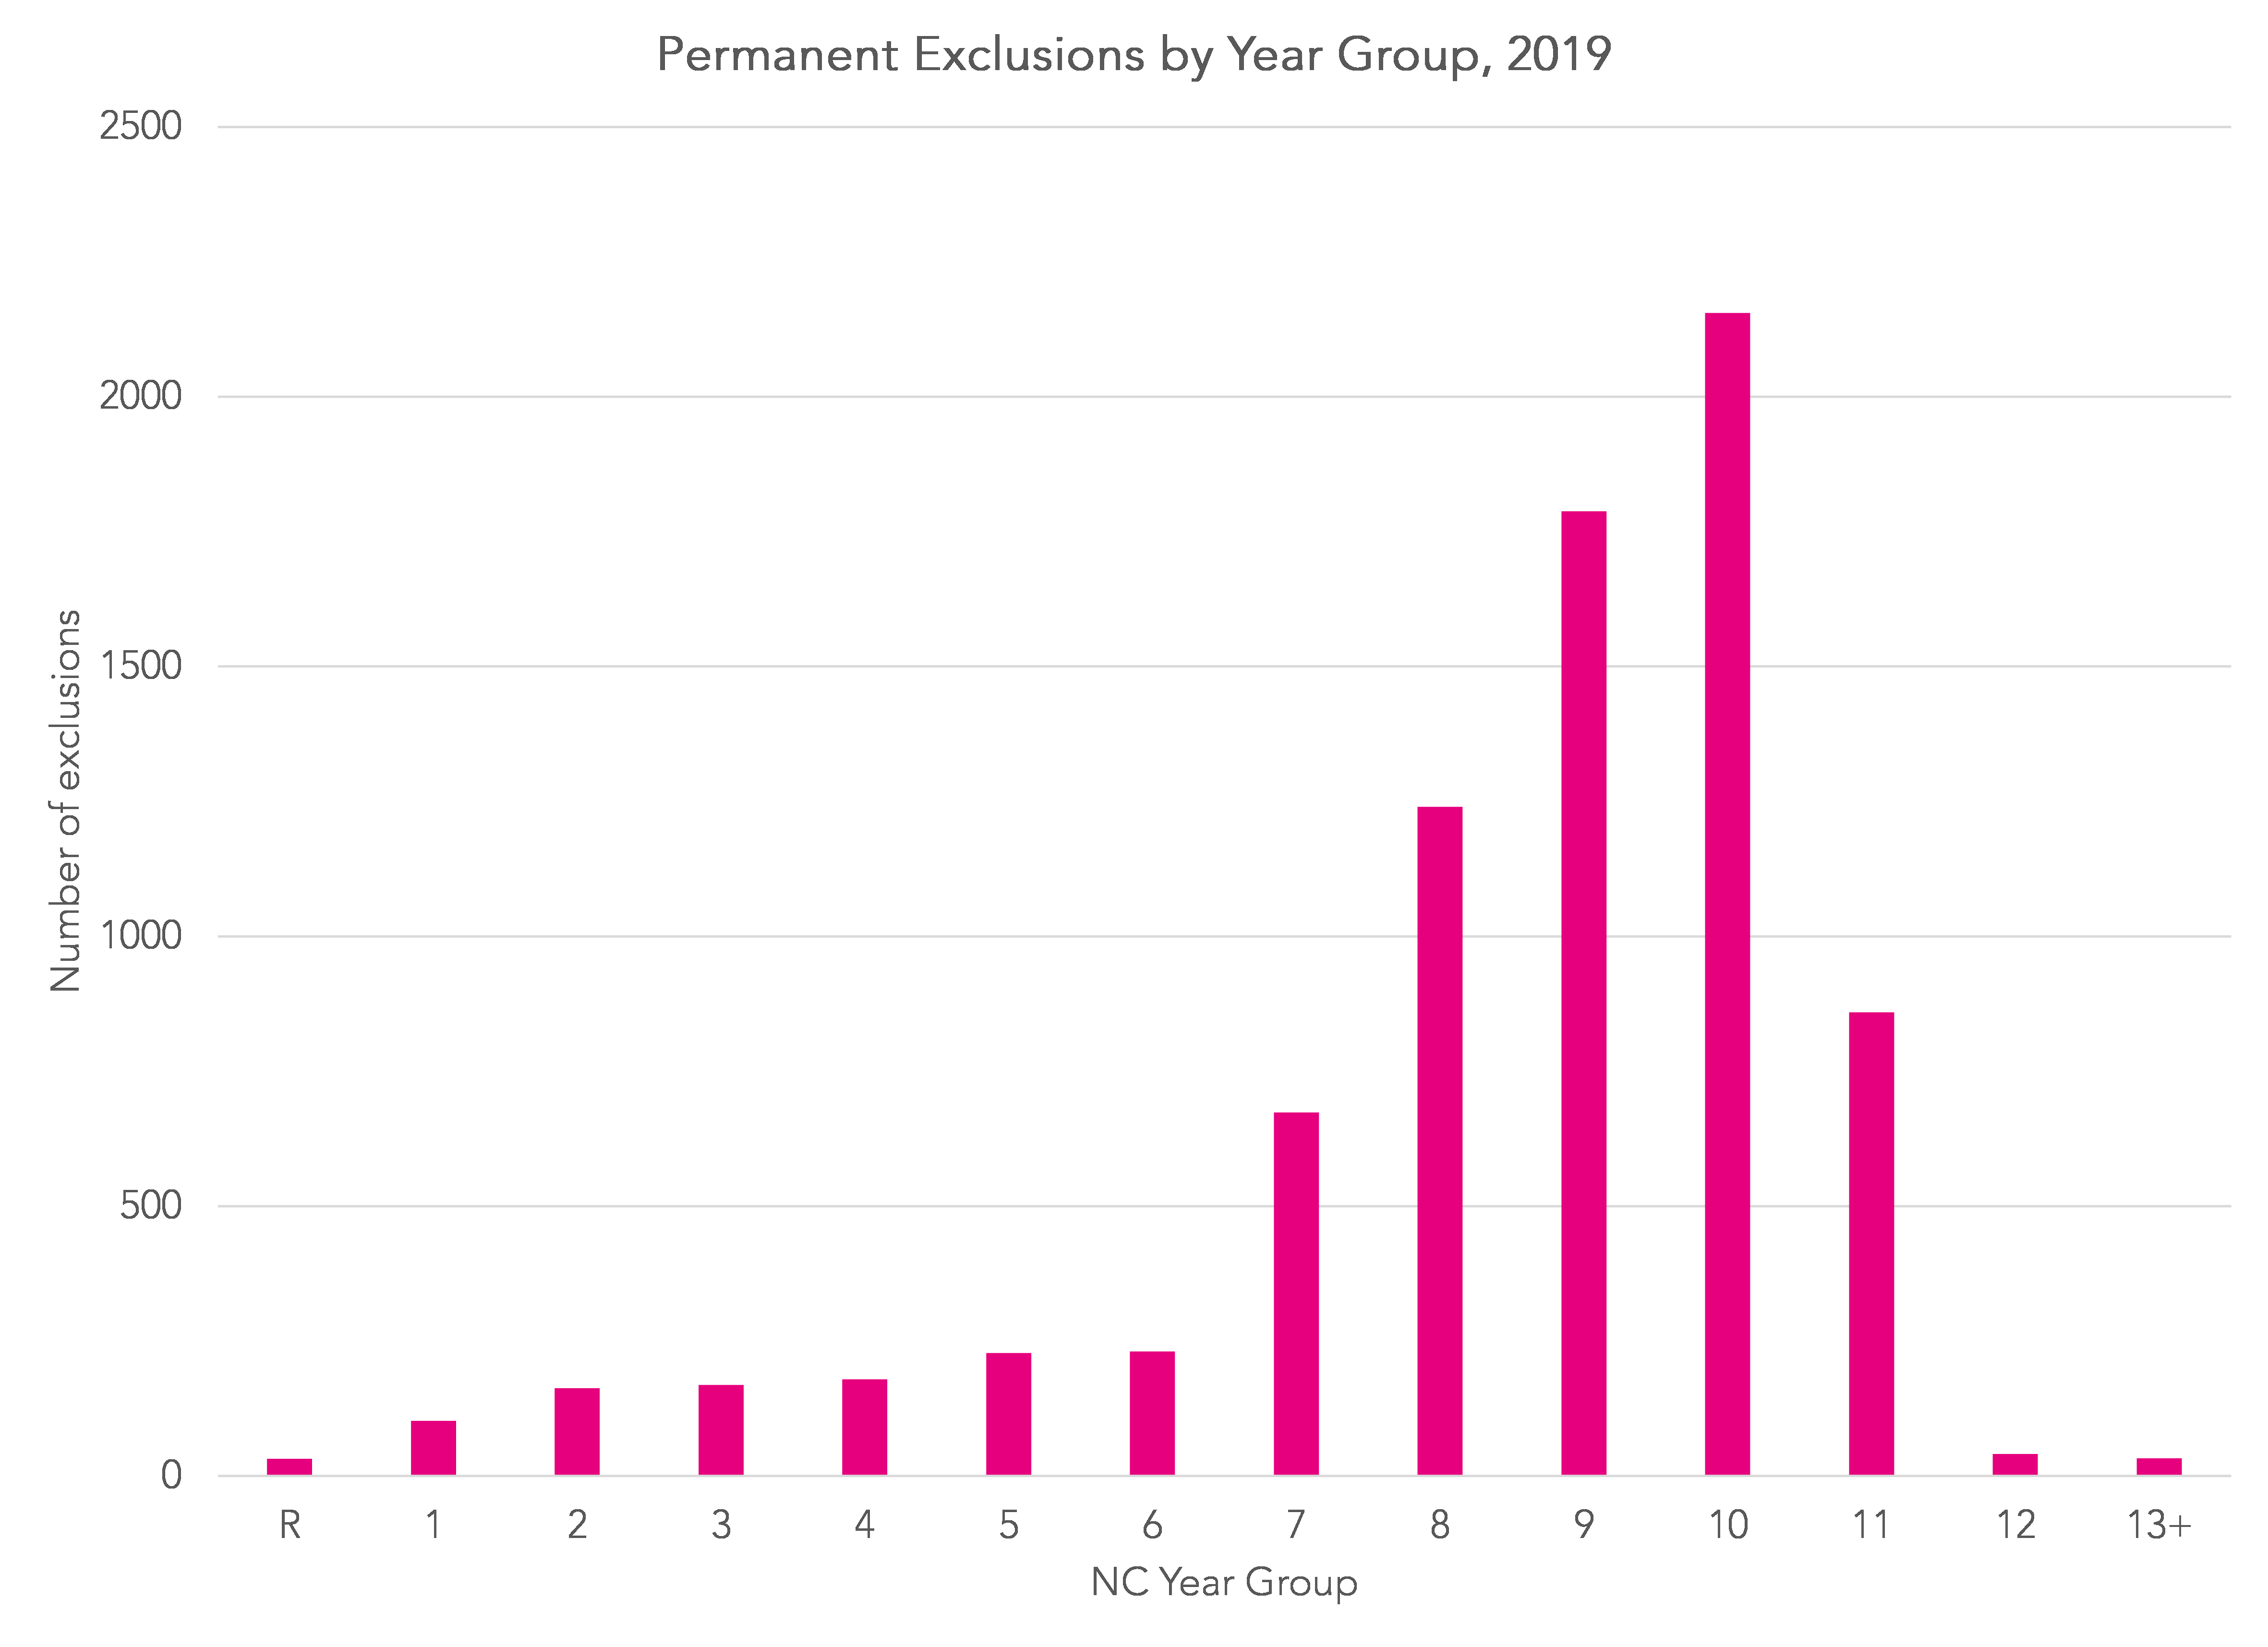
Exclusions in the primary phase (Reception to Year 6) are incredibly rare. Numbers were highest among pupils in Year 10.
Some pupils are excluded in Year 11 and above. We would not necessarily expect these pupils to be attending schools a year later so we leave these pupils out of all subsequent analysis.
First of all, let’s look at the percentage of pupils who are observed to be attending state-funded mainstream schools in January 2020, January 2021 and January 2022. We haven’t included bars for 2021 and 2022 for Year 10 (or 2022 for Year 9) as these pupils would then be above compulsory school age.
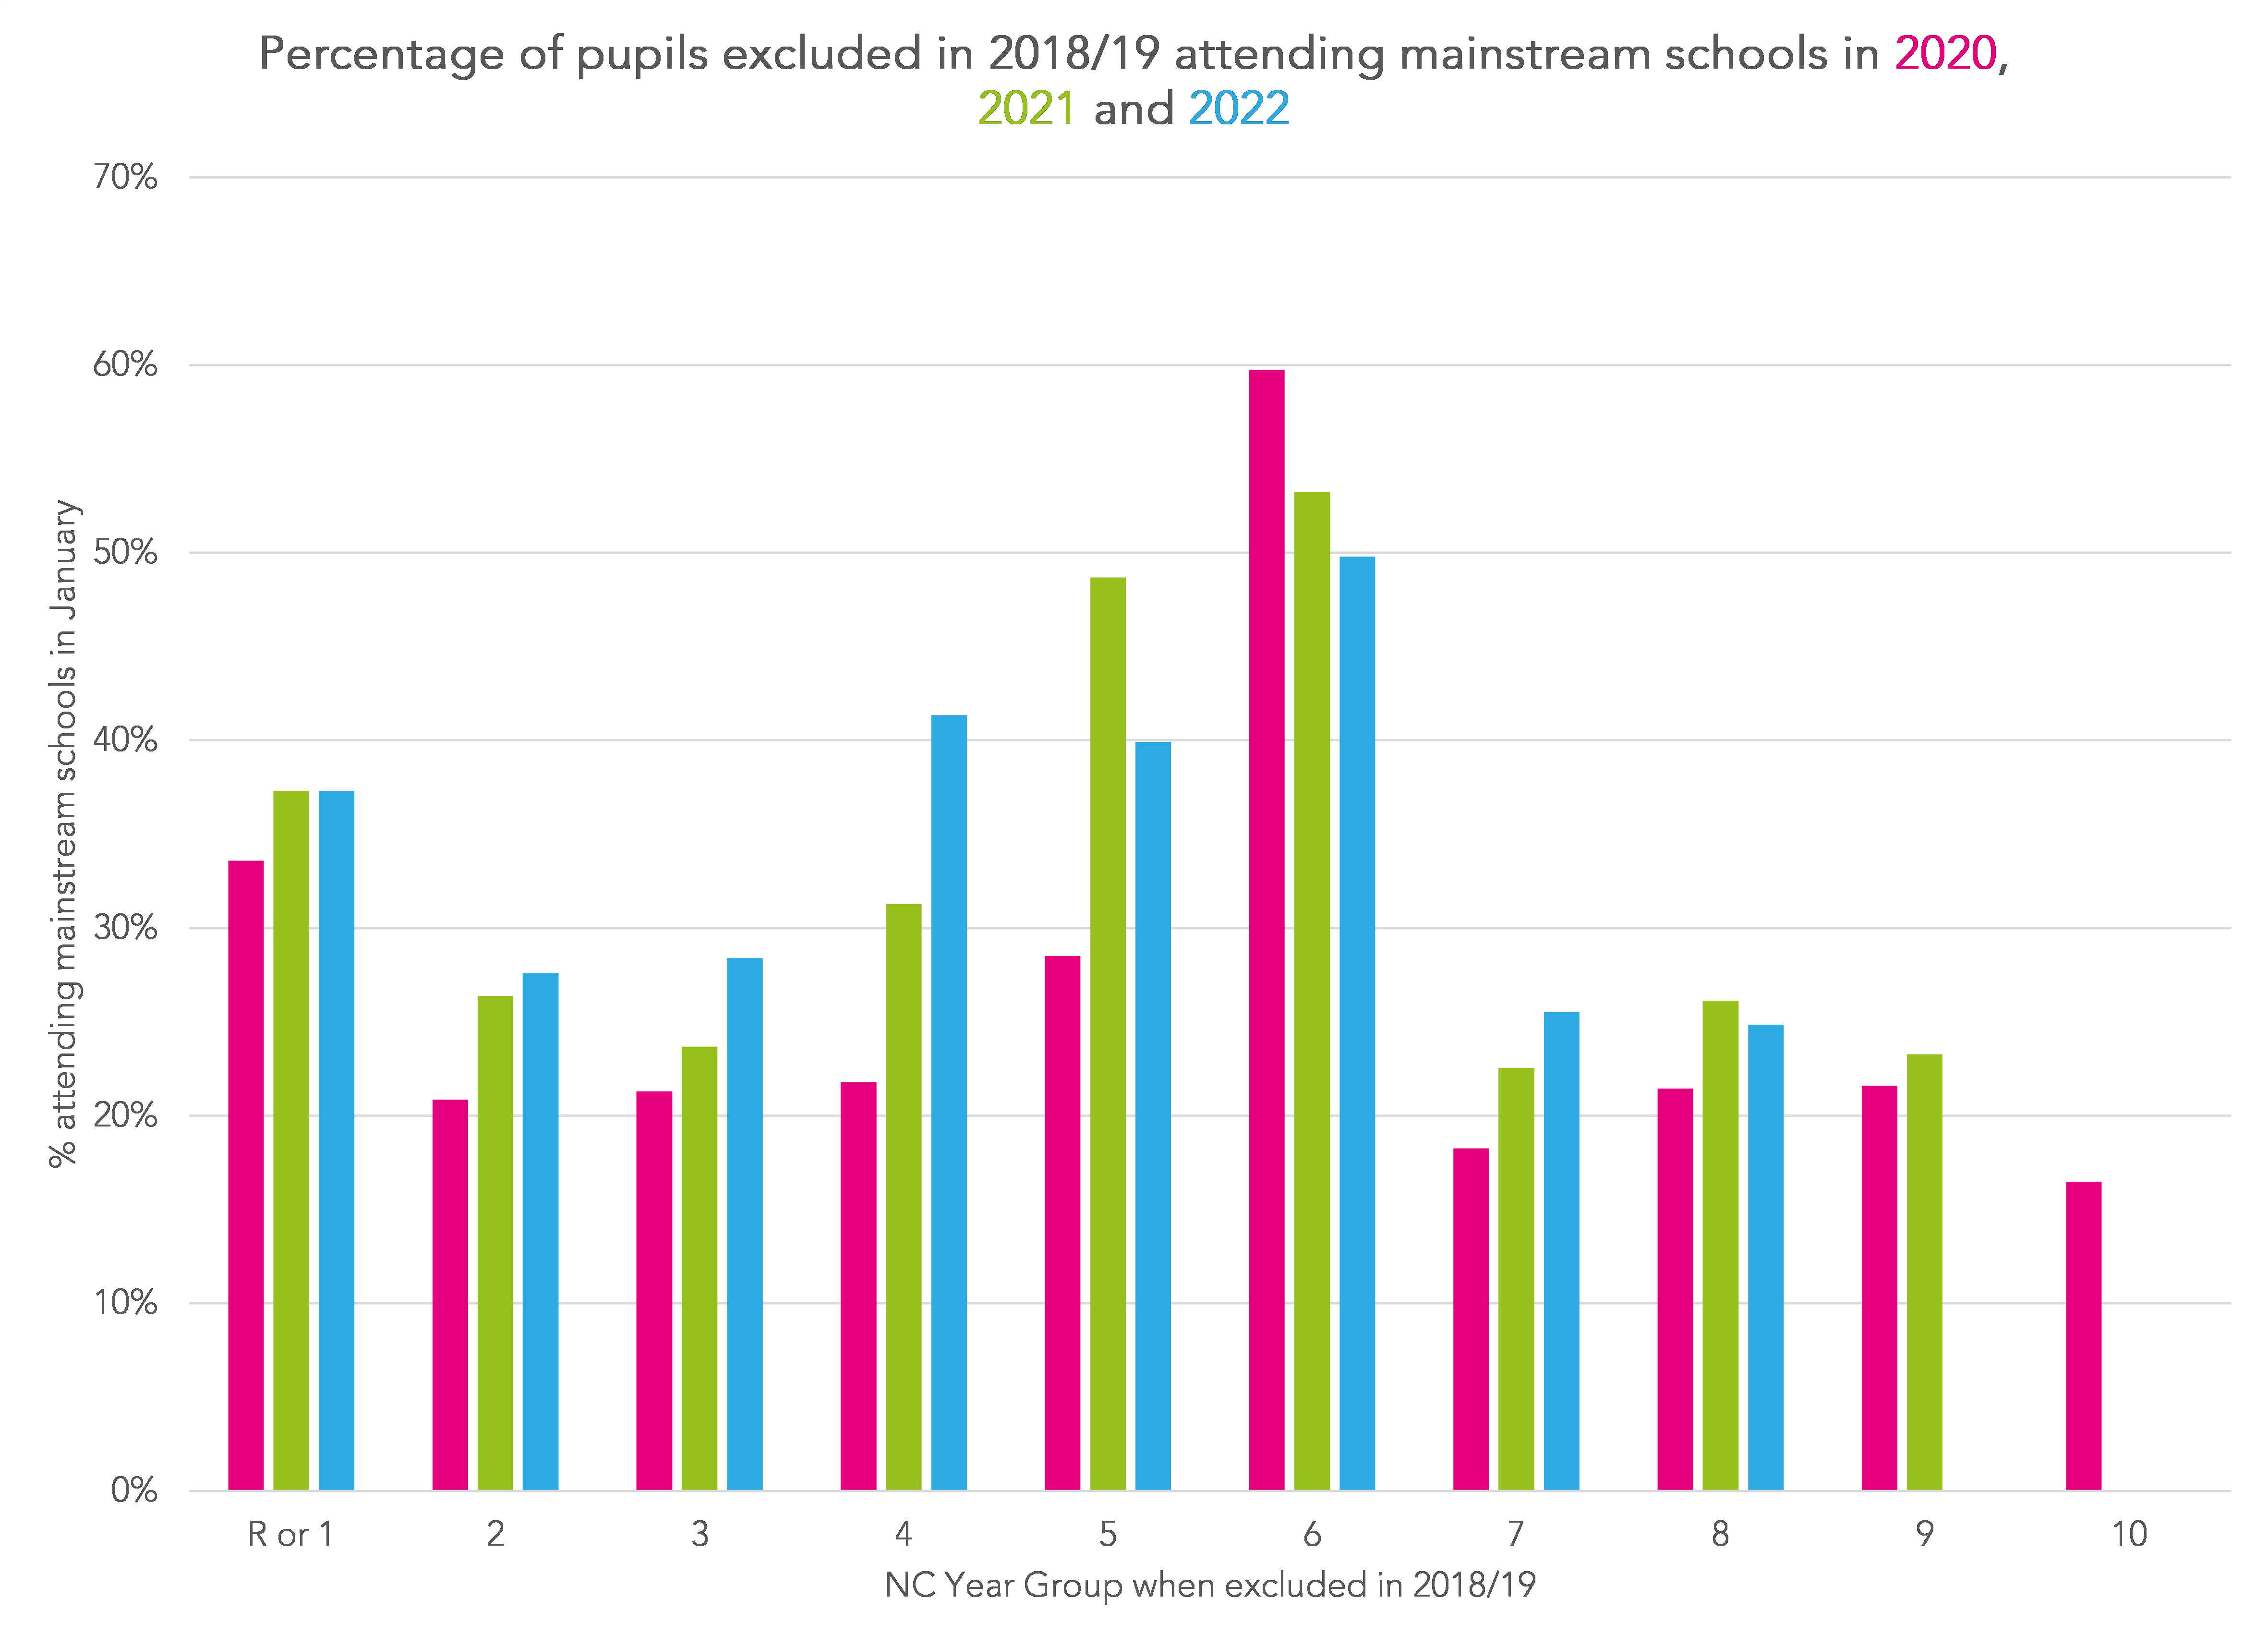
Pupils who are excluded during the secondary school years (years 7 to 10) were unlikely to return to state-funded mainstream schools. Just over a quarter (26%) of those excluded in Year 8 in 2018/19 were attending mainstream schools in January 2021.
Primary age pupils were more likely to return to the mainstream sector, particularly at secondary transfer. 60% of pupils who were in Year 6 when excluded in 2018/19 were attending mainstream schools the following January. Similarly, 49% of pupils who were in Year 5 when excluded in 2018/19 were attending mainstream schools when in Year 7 in January 2021.
We show other destinations in an appendix table.
In January 2020, over half of pupils who were permanently excluded in 2018/19 were observed to be attending state-funded AP schools[1]. We would expect most (if not all) permanently excluded pupils to join an AP school on a temporary basis when excluded while a permanent placement is found, which may be in the AP sector. We see a gradual decline in the percentage of pupils observed at AP schools in 2021 and 2022.
A quarter of pupils permanently excluded in 2018/19 were not observed to be attending a state-funded school in January 2020. The split is roughly 50:50 between those for whom the local authority is paying for alternative provision outside the state-funded school system and those whose destination is not known. This latter group will include pupils in home education and any that have emigrated.
There was an increase in the percentage educated in the special sector from 2020 to 2022 among pupils who were below Year 6 when excluded in 2018/19. Among pupils who were in Year 3 in 2018/19, for instance, 15% were attending special schools in 2020 increasing to 29% in 2021 and 38% in 2022.
How many pupils who have been permanently excluded are on roll at state-funded mainstream schools?
Now let’s look at something slightly different.
If we take the population of pupils in Years 7 to 11 on roll at each state-funded mainstream secondary school, how many have previously been permanently excluded?
To look at this, we start with the January 2020 School Census cohort, taken as we were about to enter the pandemic, and the January 2021 cohort, taken the following year.
We link pupils on roll to any previous permanent exclusion records from 2006/07 onwards. For the 2020 cohort, we count all pupils who had been excluded up to the end of the 2018/19 year. For the 2021 cohort, we count all pupils who had been excluded up to the end of the 2019/20 year.
In the table below, we show the number of previously excluded pupils on roll in January 2020 and January 2021 in state-funded secondary schools.
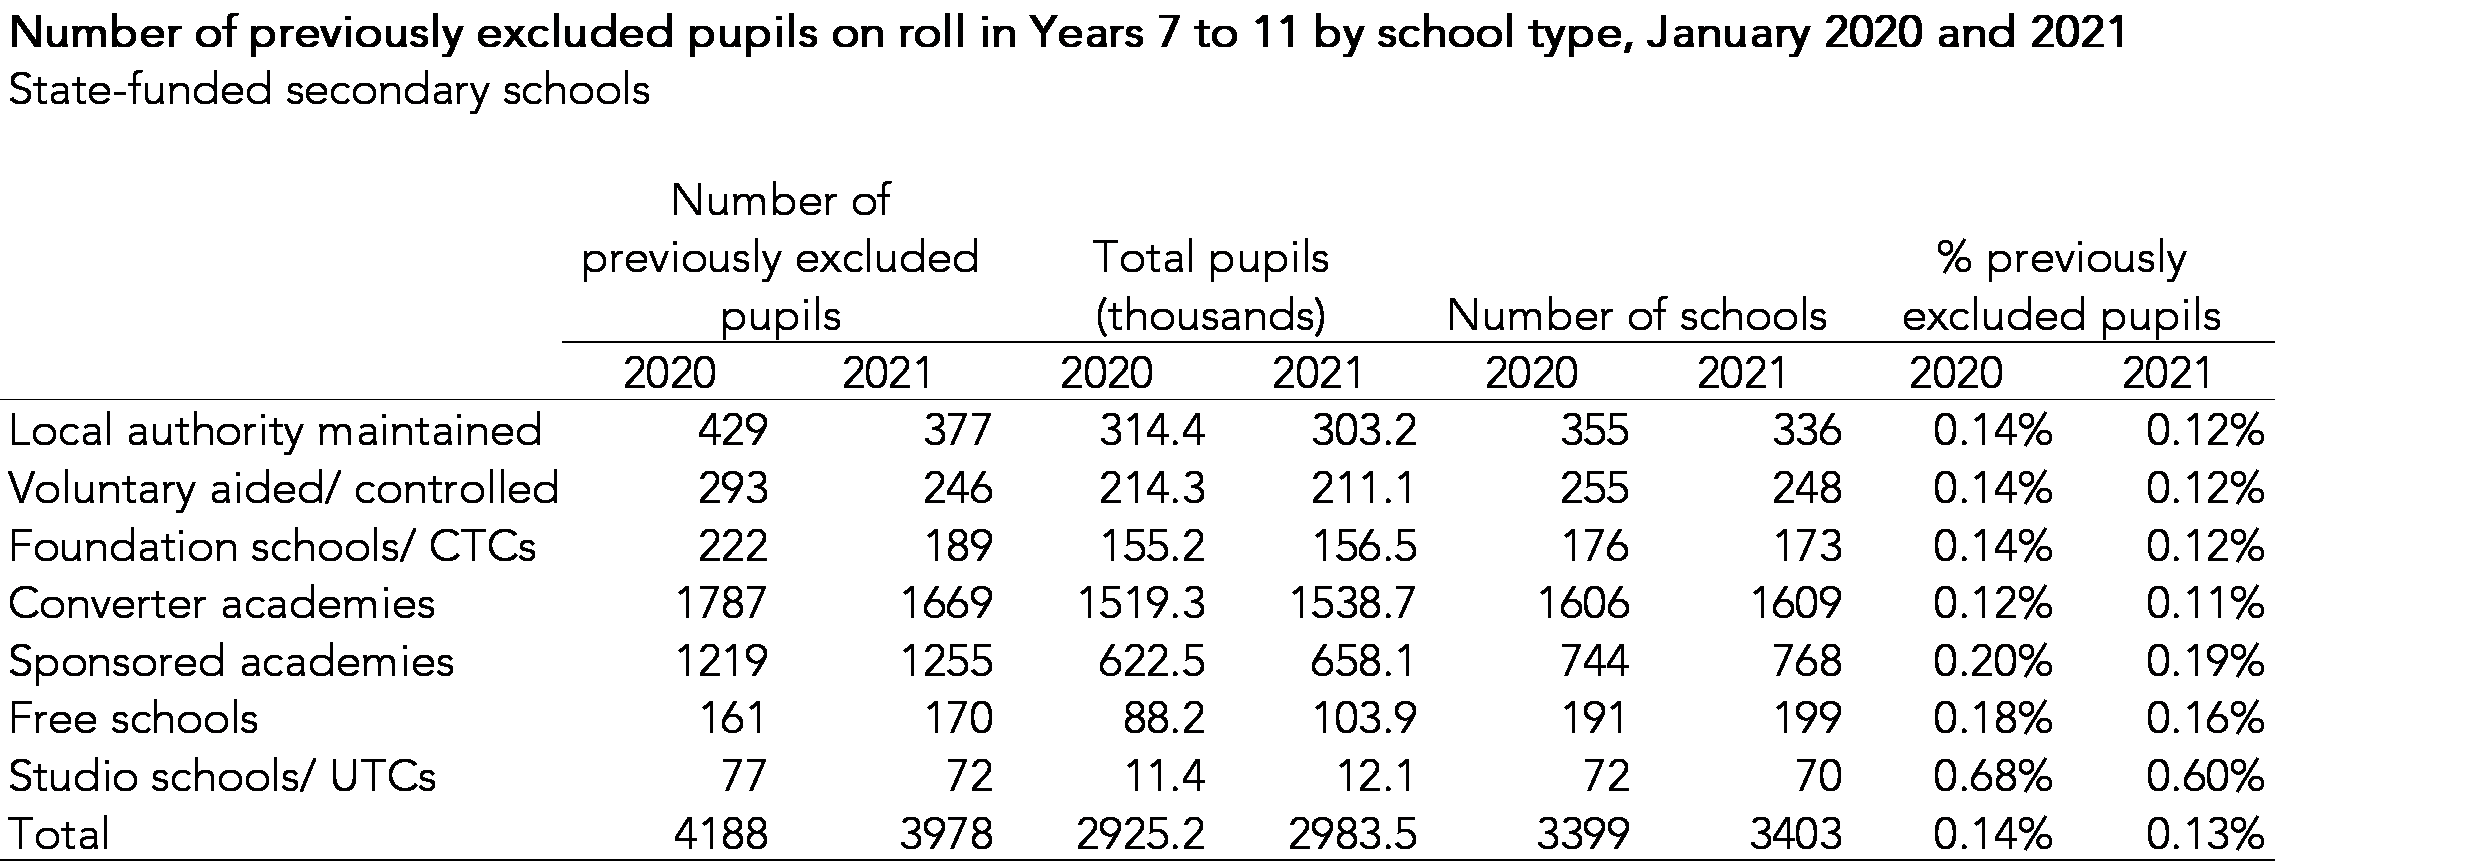
There were 4,188 previously excluded pupils on roll in all state-funded secondary schools in 2020. Following a fall in exclusions in 2019/20, this number fell to 3,978 in 2021. These numbers represented 0.14% of the population of Year 7 to Year 11 pupils in 2020 and 0.13% in 2021.
Rates of previously excluded pupils were highest among studio schools and university technical colleges (UTCs), which tend to admit at 14. Figures stood at 0.68% in 2020 and 0.60% in 2021. Rates were also slightly higher among sponsored academies at 0.20% in 2020 and 0.19% in 2021.
This may simply reflect that there tends to be more available places at schools of this type.
Relatedly, there were larger proportions of permanently excluded pupils attending secondary schools rated as requires improvement or inadequate than good or outstanding. In the table below, we classify schools based on their Ofsted rating at the end of the 2020/21 academic year.

At schools rated inadequate, 0.2% of pupils on roll in 2021 had been previously excluded. This compares to 0.07% (less than one in a thousand) enrolled in outstanding schools.
Finally, we show the number of previously excluded pupils on roll at each secondary school in January, 2021.
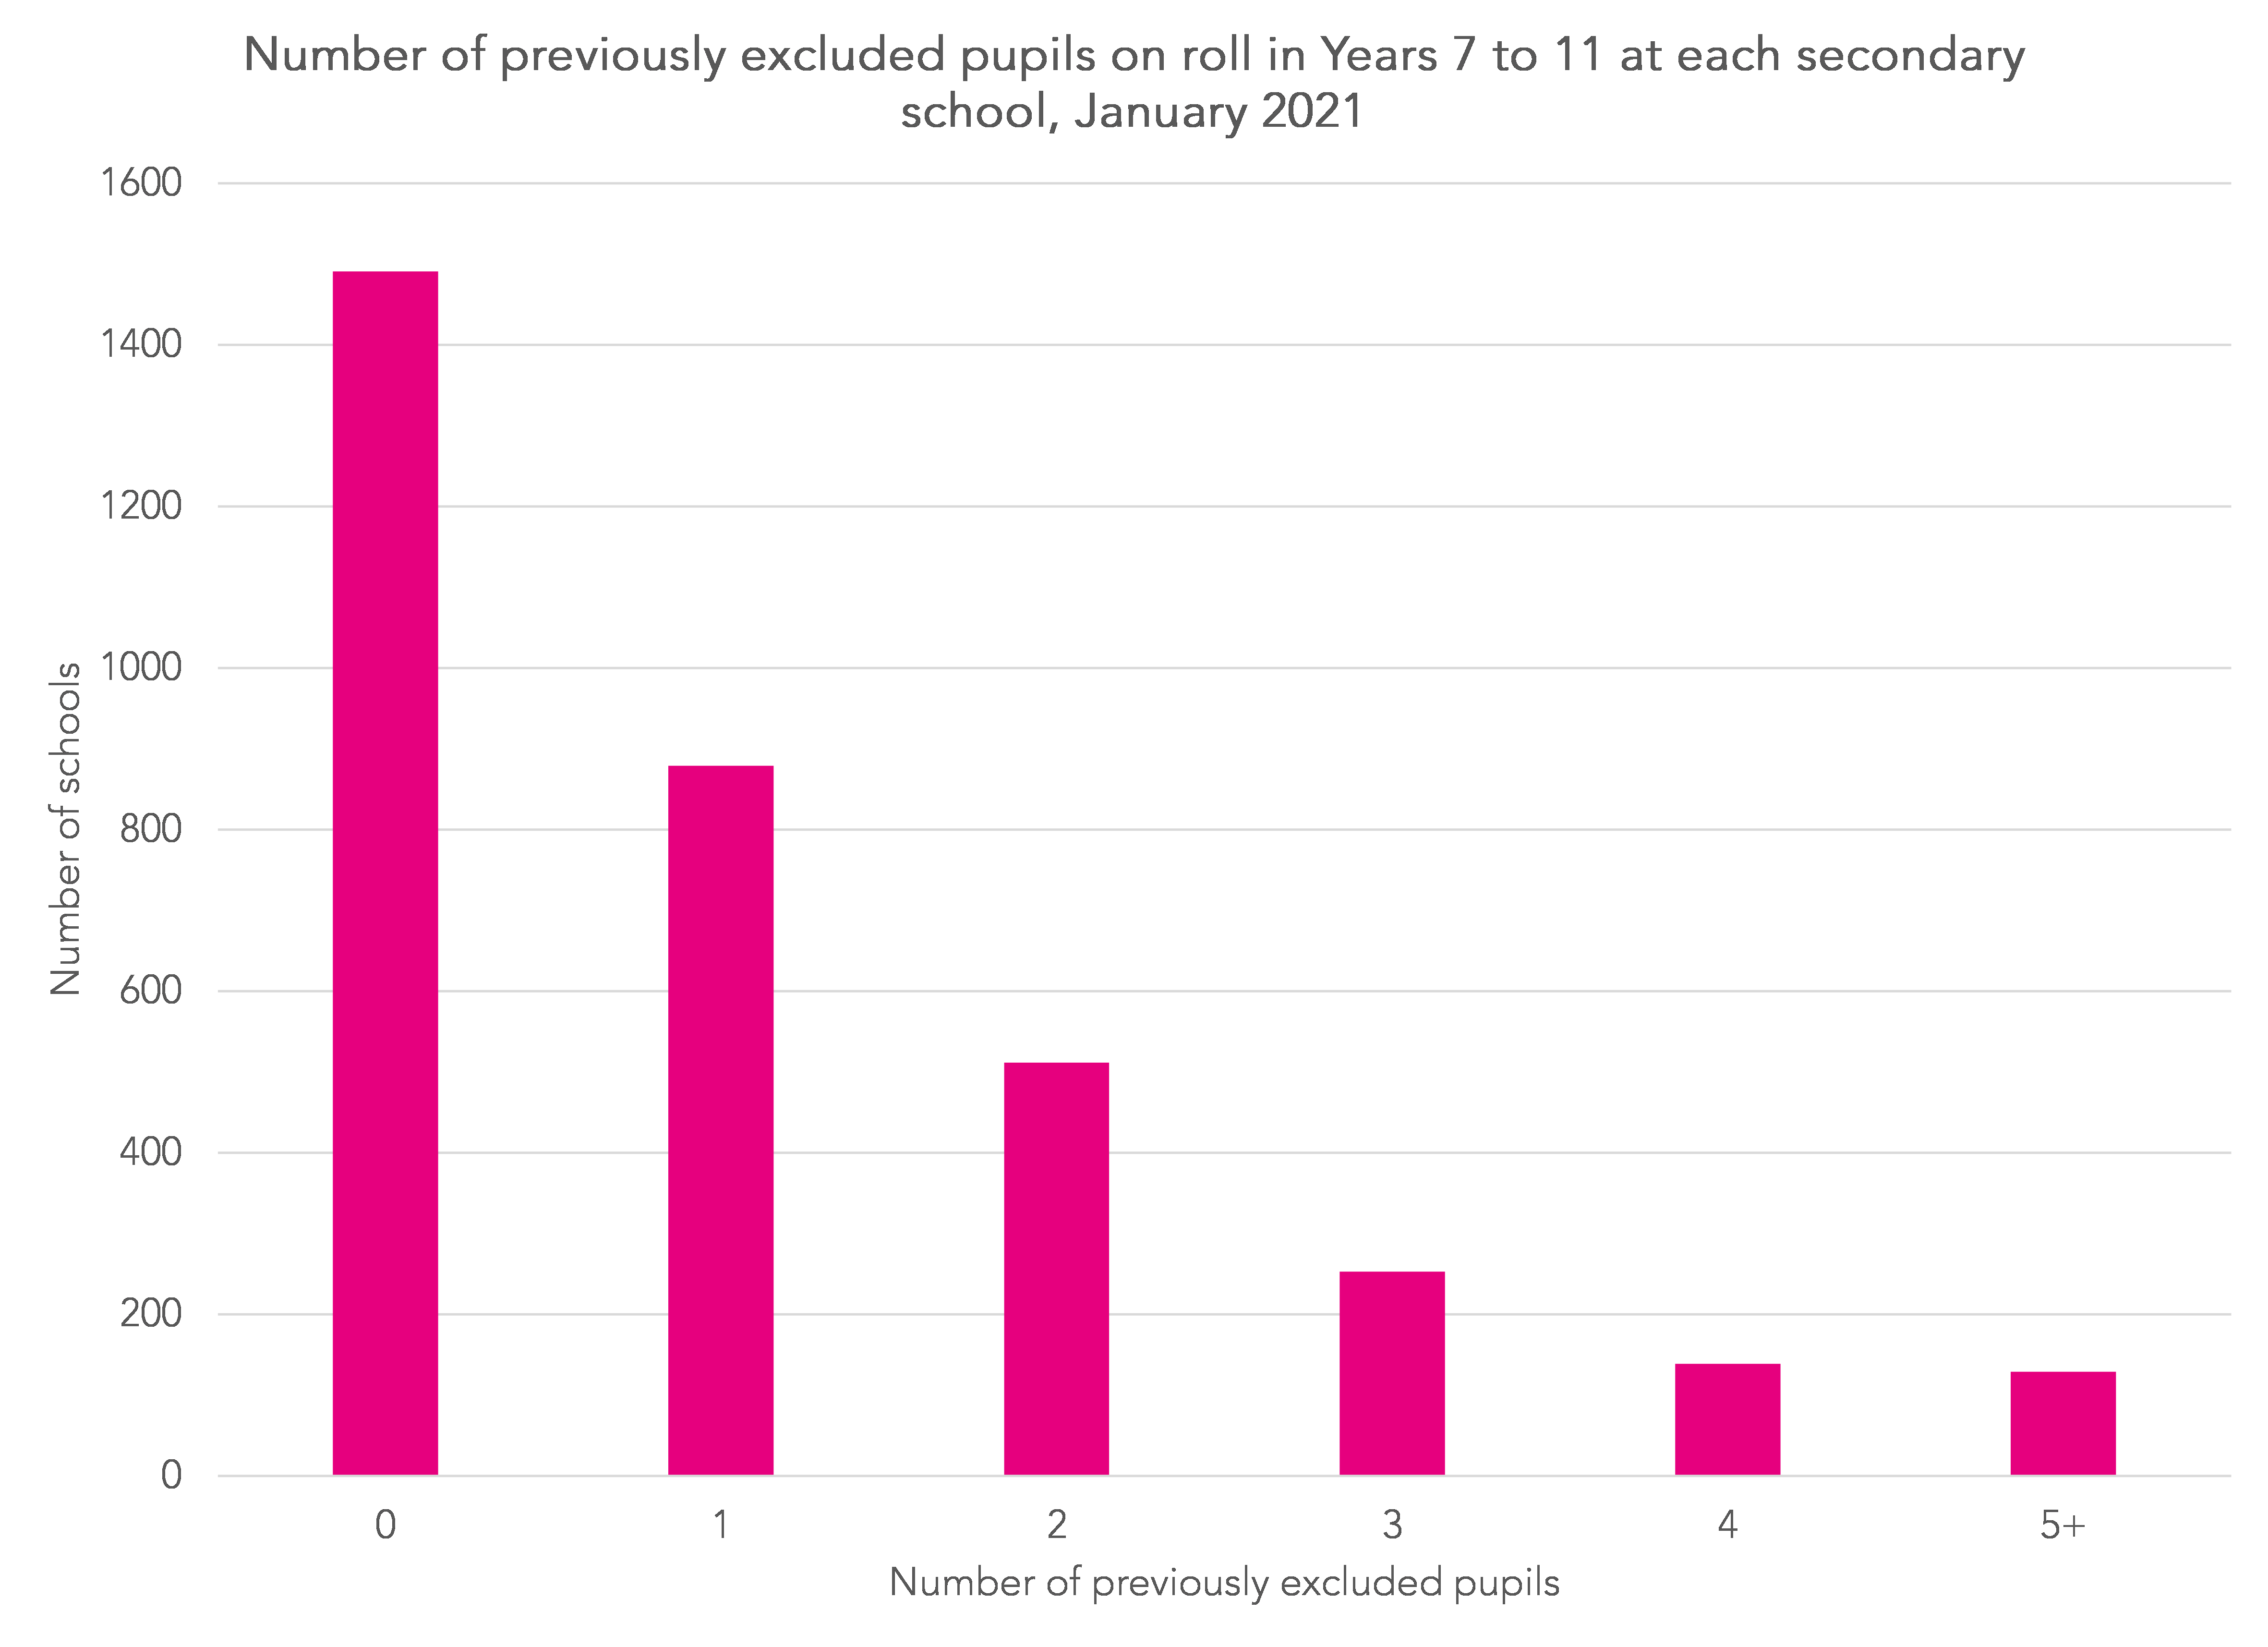
At almost 1,500 of the 3,403 schools (44%) there were zero previously excluded pupils. A small number (<5%) had 5 or more.
Summing up
More often than not, a permanently excluded pupil won’t be admitted to a state-funded mainstream school within 3 years of the exclusion. However pupils excluded while at primary school will be more likely to be admitted as a result of secondary transfer.
Many secondary schools don’t have any previously excluded pupils on roll at all. Those rated requires improvement or inadequate by Ofsted are more likely to have larger proportions.
The data we have presented is a snapshot in time. However, we can now monitor how things changes over the coming years. Exclusions fell during the pandemic, hence we would expect the number of previously excluded pupils on roll in schools to fall further.
- Pupil referral units or alternative provision free schools or academies
Want to stay up-to-date with the latest research from FFT Education Datalab? Sign up to Datalab’s mailing list to get notifications about new blogposts, or to receive the team’s half-termly newsletter.


Leave A Comment