This blog is the second is a five part series. You can read the first part here and the next part here.
We have today published a new academic paper investigating how Ofsted inspection outcomes vary across inspectors with different characteristics. This has been supported by the Nuffield Foundation and uses data we have pulled together on approximately 30,000 school inspections conducted between September 2011 and August 2019.
You can read a full version of our academic working paper along with our responses to some FAQs about the research.
This second blog in the series explores differences between inspectors who hold different contractual relationships with Ofsted – Her Majesty’s Inspectors (HMI) and Ofsted Inspectors (OI).
What is the difference between an HMI and an OI?
Good question!
In a nutshell, HMIs are civil servants who hold a permanent contractual position with Ofsted, often on a full-time basis. Ofsted are their main employer.
On the other hand, OIs work for Ofsted on a freelance basis, and are paid a day-rate for their inspection services (£535 for the lead inspector). They often hold a job elsewhere in the education sector – such as in a school leadership position. Ofsted is hence not typically their main employer.
In the data we have put together, OIs led around 80% of primary and 55% of secondary inspections (excluding short inspections) between September 2011 and August 2019. For short inspections, OIs led around 40% in both primary and secondary schools[1].
How do inspection judgements differ between HMIs and OIs?
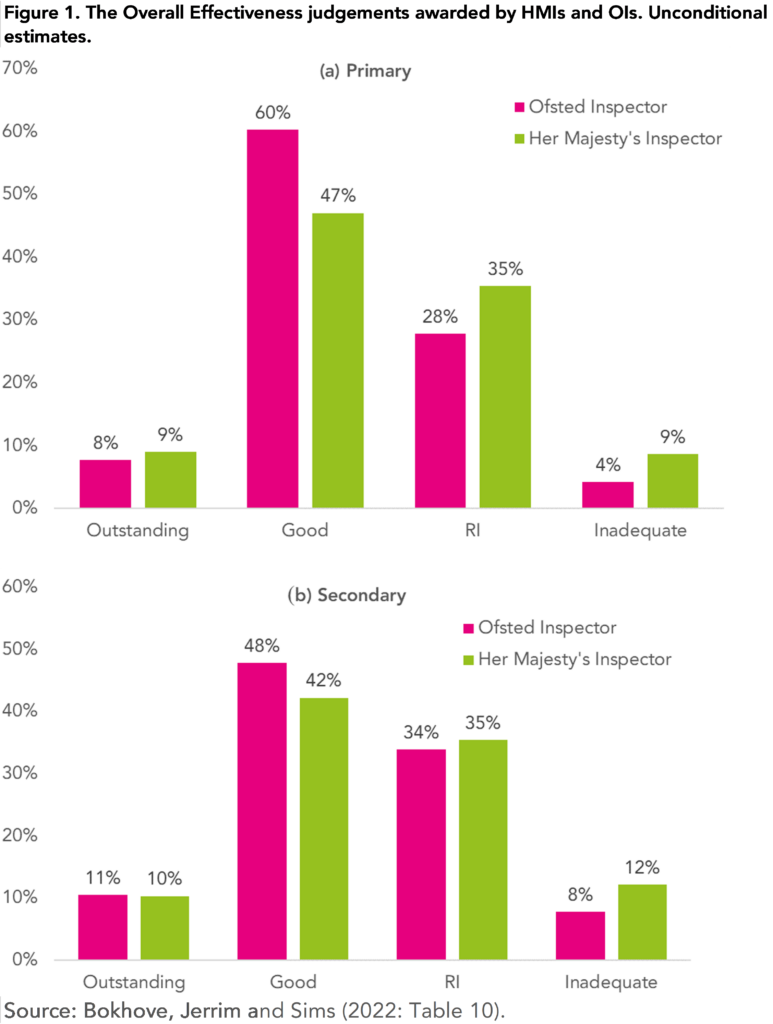
Figure 1 presents the distribution of Overall Effectiveness judgements awarded to schools when the inspection was led by an HMI (pink) compared to an OI (green).
There is a clear, sizeable difference for primary schools. HMIs are less likely than OIs to judge a school to be Good (47% versus 60%), and more likely to award a Requires Improvement or Inadequate grade.
The magnitude of the difference is smaller for secondary schools, though a similar pattern emerges. Most notably, HMIs are 1.5 times more likely to judge a school to be Inadequate than OIs (12% versus 8%) and less likely to rate a school as Good.
But are HMIs and OIs deployed to inspect schools with different characteristics?
Yes they are! And we can see this in our data.
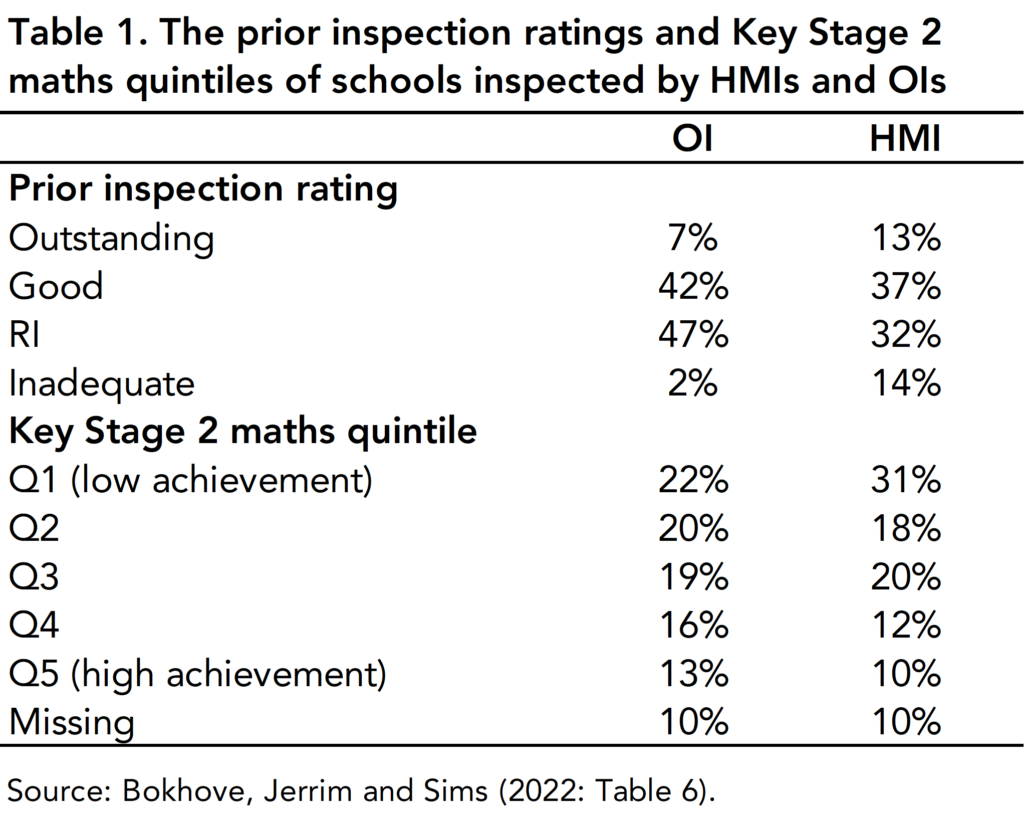
Table 1 presents evidence on this matter for primary schools. HMIs disproportionately lead inspections of schools with lower levels of performance in national examinations and that were judged to be inadequate in their last inspection. In our academic paper, we also show how HMIs are more likely to conduct inspections of “exempt” schools (explaining the higher percentage of HMIs inspecting previously Outstanding schools)[2].
So can this explain what we are seeing in Figure 1?
Only partially, as far as we can tell.
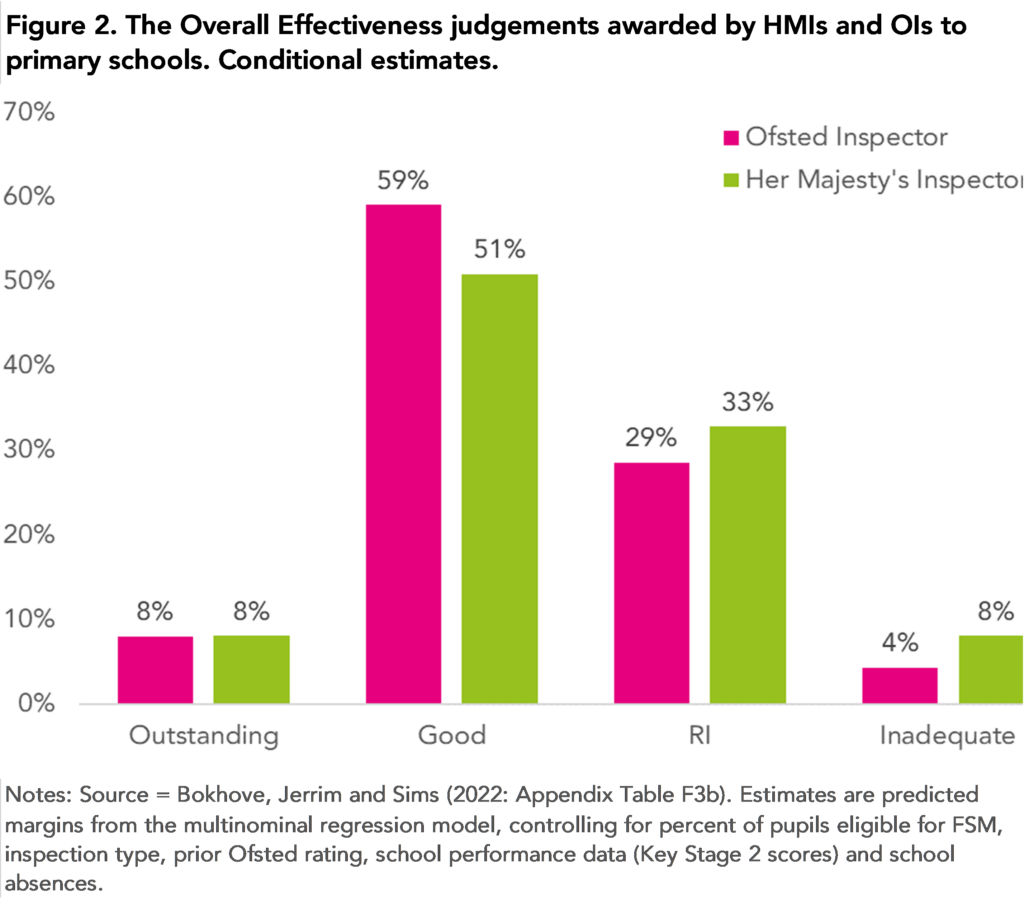
After controlling for differences across HMIs and OIs in the types of inspections they conduct, the difference between them is reduced. There is, however, still a sizeable gap that our controls for the background characteristics of schools (including school performance measures, inspection type, prior inspection judgement and absence rates) cannot explain.
This can be seen in Figure 2 – the gap between the pink (OI) and green (HMI) bars has reduced in comparison to Figure 1 but remains non-trivial and statistically significant at conventional levels.
Interestingly, in the analogous analysis for secondary schools, the only remaining point of difference between HMIs and OIs after adding these controls is in the tendency to award Good (43% versus 47%) compared to Inadequate (12% versus 8%) grades.
What is the take-home message?
Now, in our analysis we have only been able to control for a limited set of background factors. Ofsted may select HMIs and OIs to lead inspections in ways that we cannot observe – and thus are unable to control for in our analysis.
Our hunch is therefore that the differences reported in Figure 2 are probably still a bit too high. At the same time, we believe it unlikely that further differences in HMI and OI deployment would explain all the remaining gap.
Ofsted may wish to dig into this issue some more, particularly with respect to the inadequate grade, where the relative difference between HMIs and OIs is greatest.
[1]: See Table 3 of Bokhove, Jerrim and Sims (2022).
[2]: Between 2012 and 2021, schools previously judged as Outstanding were exempt from routine inspection. They could however be inspected where complaints about the school were received or if Ofsted’s risk assessment process identified concerns.


Leave A Comment