Ofqual have publicly committed to “getting back to normal” in this year’s grading standards. But they have also acknowledged the need for “some protection against any impact of COVID 19 disruption”. So let’s see how Year 11 have been impacted by absence this year.
We’ll be using data from around 2,700 Attendance Tracker secondary schools in England covering the period up until Friday 19th May.
There’s been slightly less absence this year compared with last year
We’ll start by looking at the percentage of morning and afternoon registration sessions missed. In the chart below we compare this year to the same period last year, and with pre-pandemic[1].
For most schools, this year’s data excludes absences due to strikes[2].
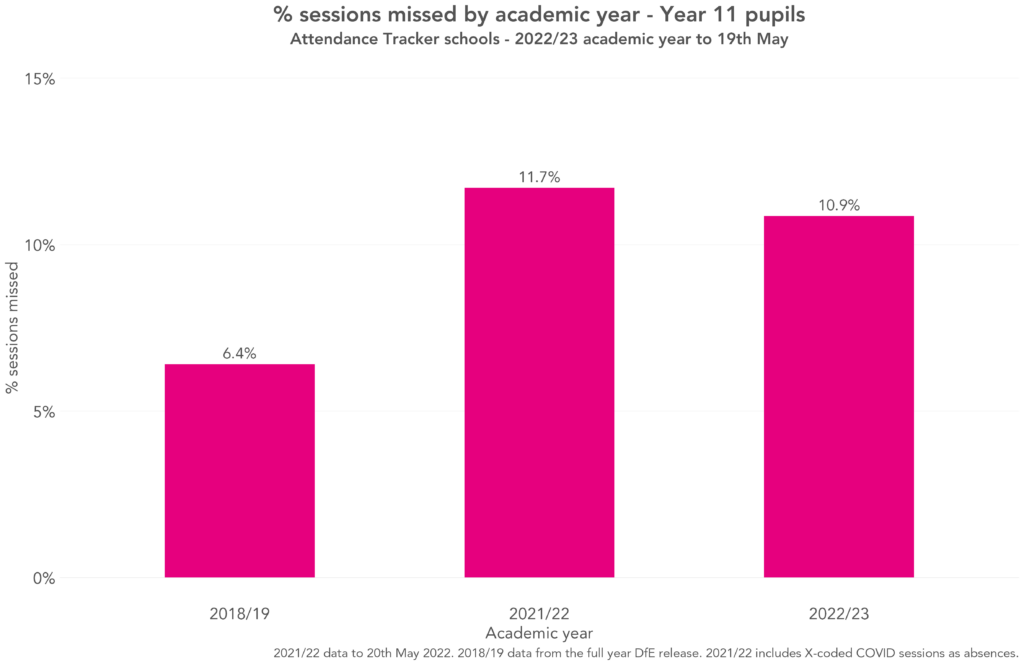
We see that absence has been slightly lower this year than last – the current Year 11 missed 10.9% of sessions while last year’s missed 11.7%. This is equivalent to around a day and a half less over the whole academic year.
Compared with pre-pandemic however, absence remains higher. The difference of 4.5 percentage points (pp) is equivalent to around seven extra days across the academic year.
It looks like this is due to a reduction in illness and unauthorised absence
We can break this down by absence type using the marks recorded in registers. We’ll look at three types:
- absence due to illness, including pupils who have tested positive for COVID
- absence for any other authorised reason, for example medical appointments or authorised leaves of absence. For 2021/22 only, sessions missed due to COVID isolation are included in this category too.
- unauthorised absence, including where the reason for absence is not yet known
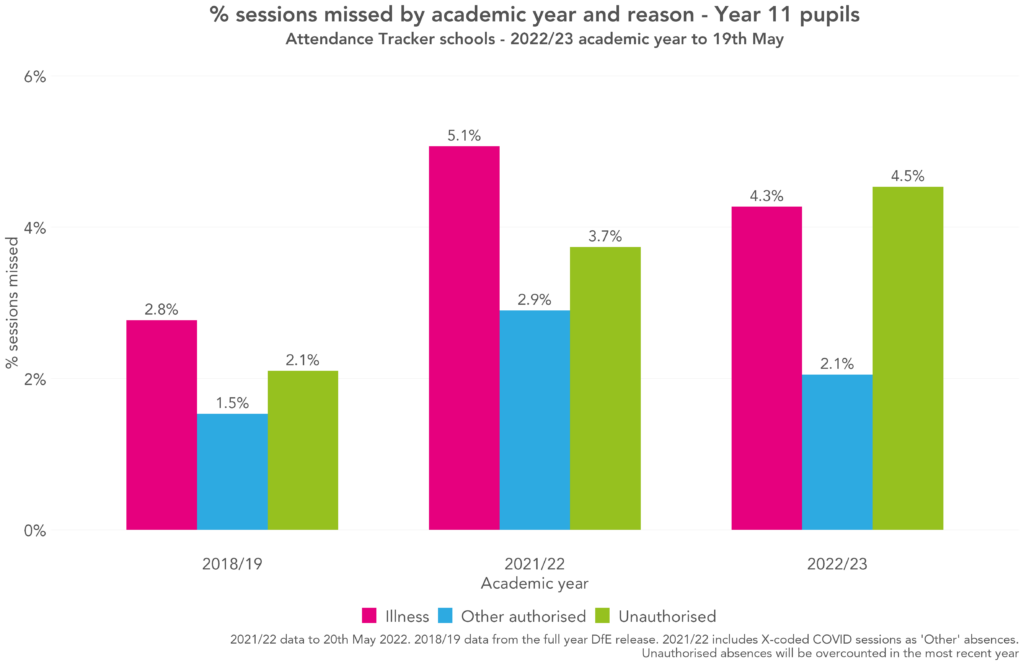
The small improvement compared with last year seems to be driven by a reduction in illness-related absence and other authorised absence (likely due the removal of COVID isolation requirements).
The big increase compared with pre-pandemic is harder to interpret. Because schools are still chasing reasons for absence in the most recent academic year, it’s likely that the proportion of sessions missed for unauthorised reasons will decrease, and for illness and other authorised reasons will increase. Broadly, the increase compared with pre-pandemic is likely to be explained by increases in illness and unauthorised absence in roughly equal measure, with other authorised reasons a smaller factor.
Numbers of pupils missing lots of school remain high
Moving on to persistent absence, we plot the percentage of Year 11 pupils who’ve missed at least 10%, at least 20% and at least 50% of sessions. And again, we compare the picture this year with last year and with pre-pandemic.
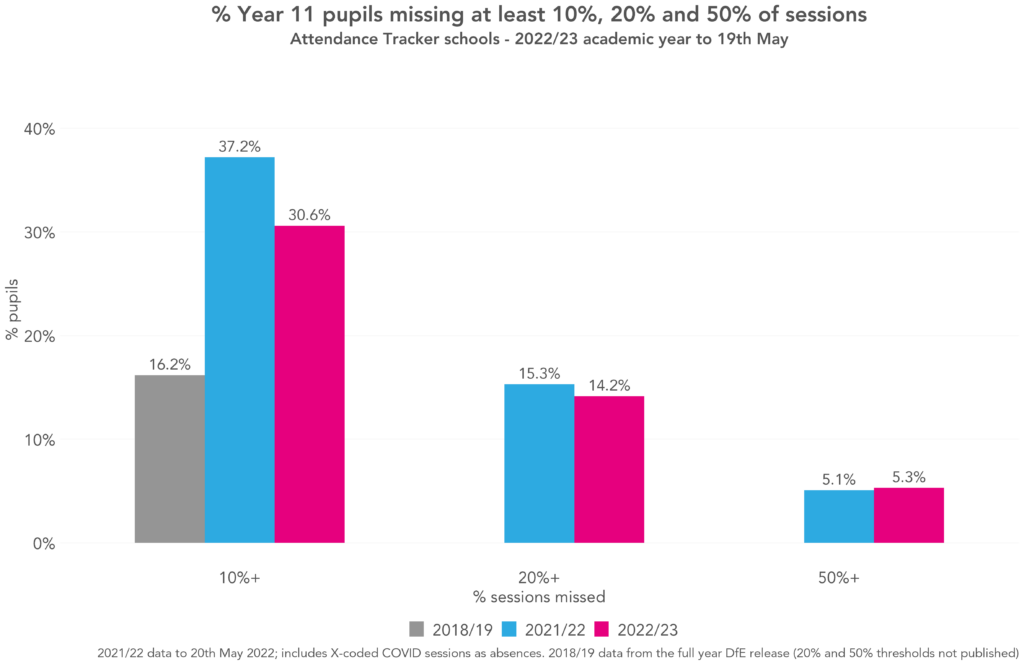
The percentage of pupils missing at least 10% of sessions has decreased by almost 20% compared with last year, but remains around double the pre-pandemic rate (30.6% of this year’s Year 11s, compared with 37.2% of last year’s and 16.2% pre-pandemic.)
The percentage of pupils missing at least 20% of sessions, equivalent to a day a week on average, has dropped only slightly, from 15.3% to 14.2%. And the percentage of pupils missing at least 50% of sessions (those who spent more time absent than present) has stayed roughly the same – 5.1% last year and 5.3% this year. Unfortunately, DfE don’t include this data in their standard attendance releases so we don’t know how much higher these figures are compared with pre-pandemic.
A look around the regions
To finish, we’ll see how the picture varies by region.
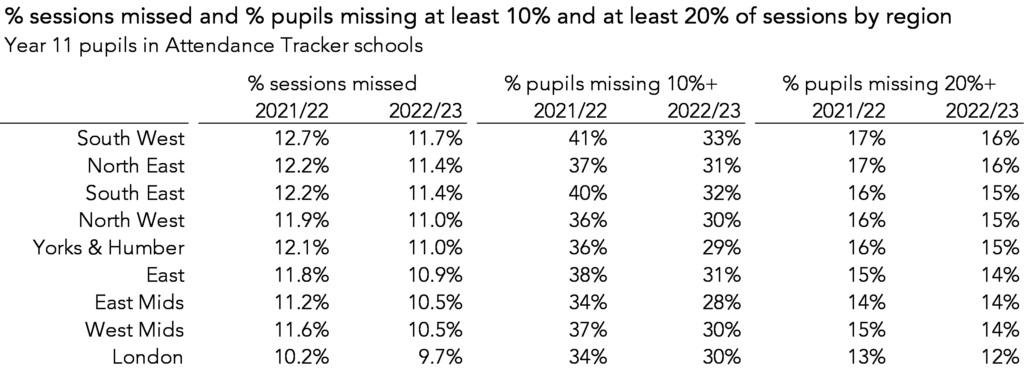
Absence remained high in all regions.
Overall, Year 11 pupils in the South West had the highest absence rates (11.7% of sessions missed) and those in London the lowest (9.7%). This was also true last year.
However, London’s Year 11s did not see the lowest persistent absence rates this year – in the East Midlands (28%) and Yorkshire and the Humber (29%) fewer pupils missed at least 10% of sessions than in London (30%).
Summing up
It looks like Year 11 faced less disruption this year compared with last year’s Year 11s. However, the difference is small, perhaps small enough to be erased completely if we’d been able to capture the impact of strikes this year.
Either way, it looks like Ofqual’s plan to provide some protection will be needed. What this looks like in practice should become clearer on results day.
Aspire Attendance Tracker
Schools can track, analyse and compare their attendance data against 1,000s of other FFT schools using Aspire Attendance Tracker.
Log in to Aspire to access Attendance Tracker – log in here.
Not an FFT Aspire user? Learn more here.
[1] For pre-pandemic we use the 2018/19 full year DfE release (for Year 11 pupils, the final half-term is not counted). Last year’s figures are from our Attendance Tracker schools, and include “X-coded” COVID sessions as absences (the equivalent figure from the 2021/22 DfE release is 11.7%, the same as for our Attendance Tracker schools.)
[2] Sessions missed due to strikes recorded as “X” or “Y” in the register (we think this is most schools) will not be included. Those recorded as “C” will be.
Want to stay up-to-date with the latest research from FFT Education Datalab? Sign up to Datalab’s mailing list to get notifications about new blogposts, or to receive the team’s half-termly newsletter.


Are the attendance tracker schools the same for 2021/22 and 2022/23 or do the figures relate to all schools in the ‘project’ for those years? I’d hypothesize that schools with high absence rates were more likely to be ‘early adopters’ and so as the number of schools participating increases this may give an overall improvement in attendance rates as the sampling changes and becomes ever more representative of all schools .