Exclusions data for the full 2021/22 academic year will be published later this week, just as the 2022/23 academic year is winding down.
There is a lag in the collection of data: exclusions for the summer term 2021/22 were collected in the Spring School Census. This is to allow time for appeals against exclusions to be heard. Although the Census relates to a specific date in January, schools have a longer window to submit the data.
Then statisticians take a few months to clean the data and assemble the exclusions statistics.
Data for previous years has tended to show that pupils with special educational needs (SEN) are disproportionately more likely to be permanently excluded although, as this blog shows, the picture is more nuanced than that.
In this blogpost we’re going to show a couple of things that the exclusions statistics might not show.
Firstly, we dig into the exclusion rate of pupils not classified as having SEN but who had been in the past.
Then we also look at permanent exclusions among pupils who are identified as SEN for the first time at secondary school.
Data
We work with exclusions data from the 2020/21 academic year from the National Pupil Database (NPD). In this dataset there are 3,936 permanent exclusions. This, for reasons we have yet to discern, is slightly more than in the published statistics. It was also a year, lest we forget, affected by disruption arising from Covid-19.
I then add each pupil’s SEN status[1] from the School Census from the term in which the exclusion takes place. For instance, if a pupil is excluded in Spring I use the Spring Census 2020/21, if excluded in Autumn I use the Autumn Census 2020/21 and so on. If a pupil is not found in the relevant Census, I use the value from the previous Census.
Secondly, I add each pupil’s primary SEN type[2] from School Census. Unlike SEN status, primary SEN type is only collected in January. So I use Spring Census 2020/21 for pupils excluded in Spring or summer and Spring Census 2019/20 for those excluded in the Autumn term.
I am unable to replicate the published statistics in which exclusions are broken down by SEN status (although with very few differences) or by SEN type (with larger differences). It doesn’t really affect the interpretation so I’ll park that for another day.
Previously SEN pupils
The published statistics assign pupils to three groups based on SEN status: those with SEN, split into School Support and Education, Health and Care plans (EHCPs), and those without SEN.
However, the group of those without SEN consists of those who have never been identified as having SEN and those who have been.
According to our statistics, 1,551 of the exclusions related to pupils not classified as having SEN. 915 related to pupils who were previously SEN.
In the chart below we show these figures as a proportion of the total school population aged 4 and above in January 2021.
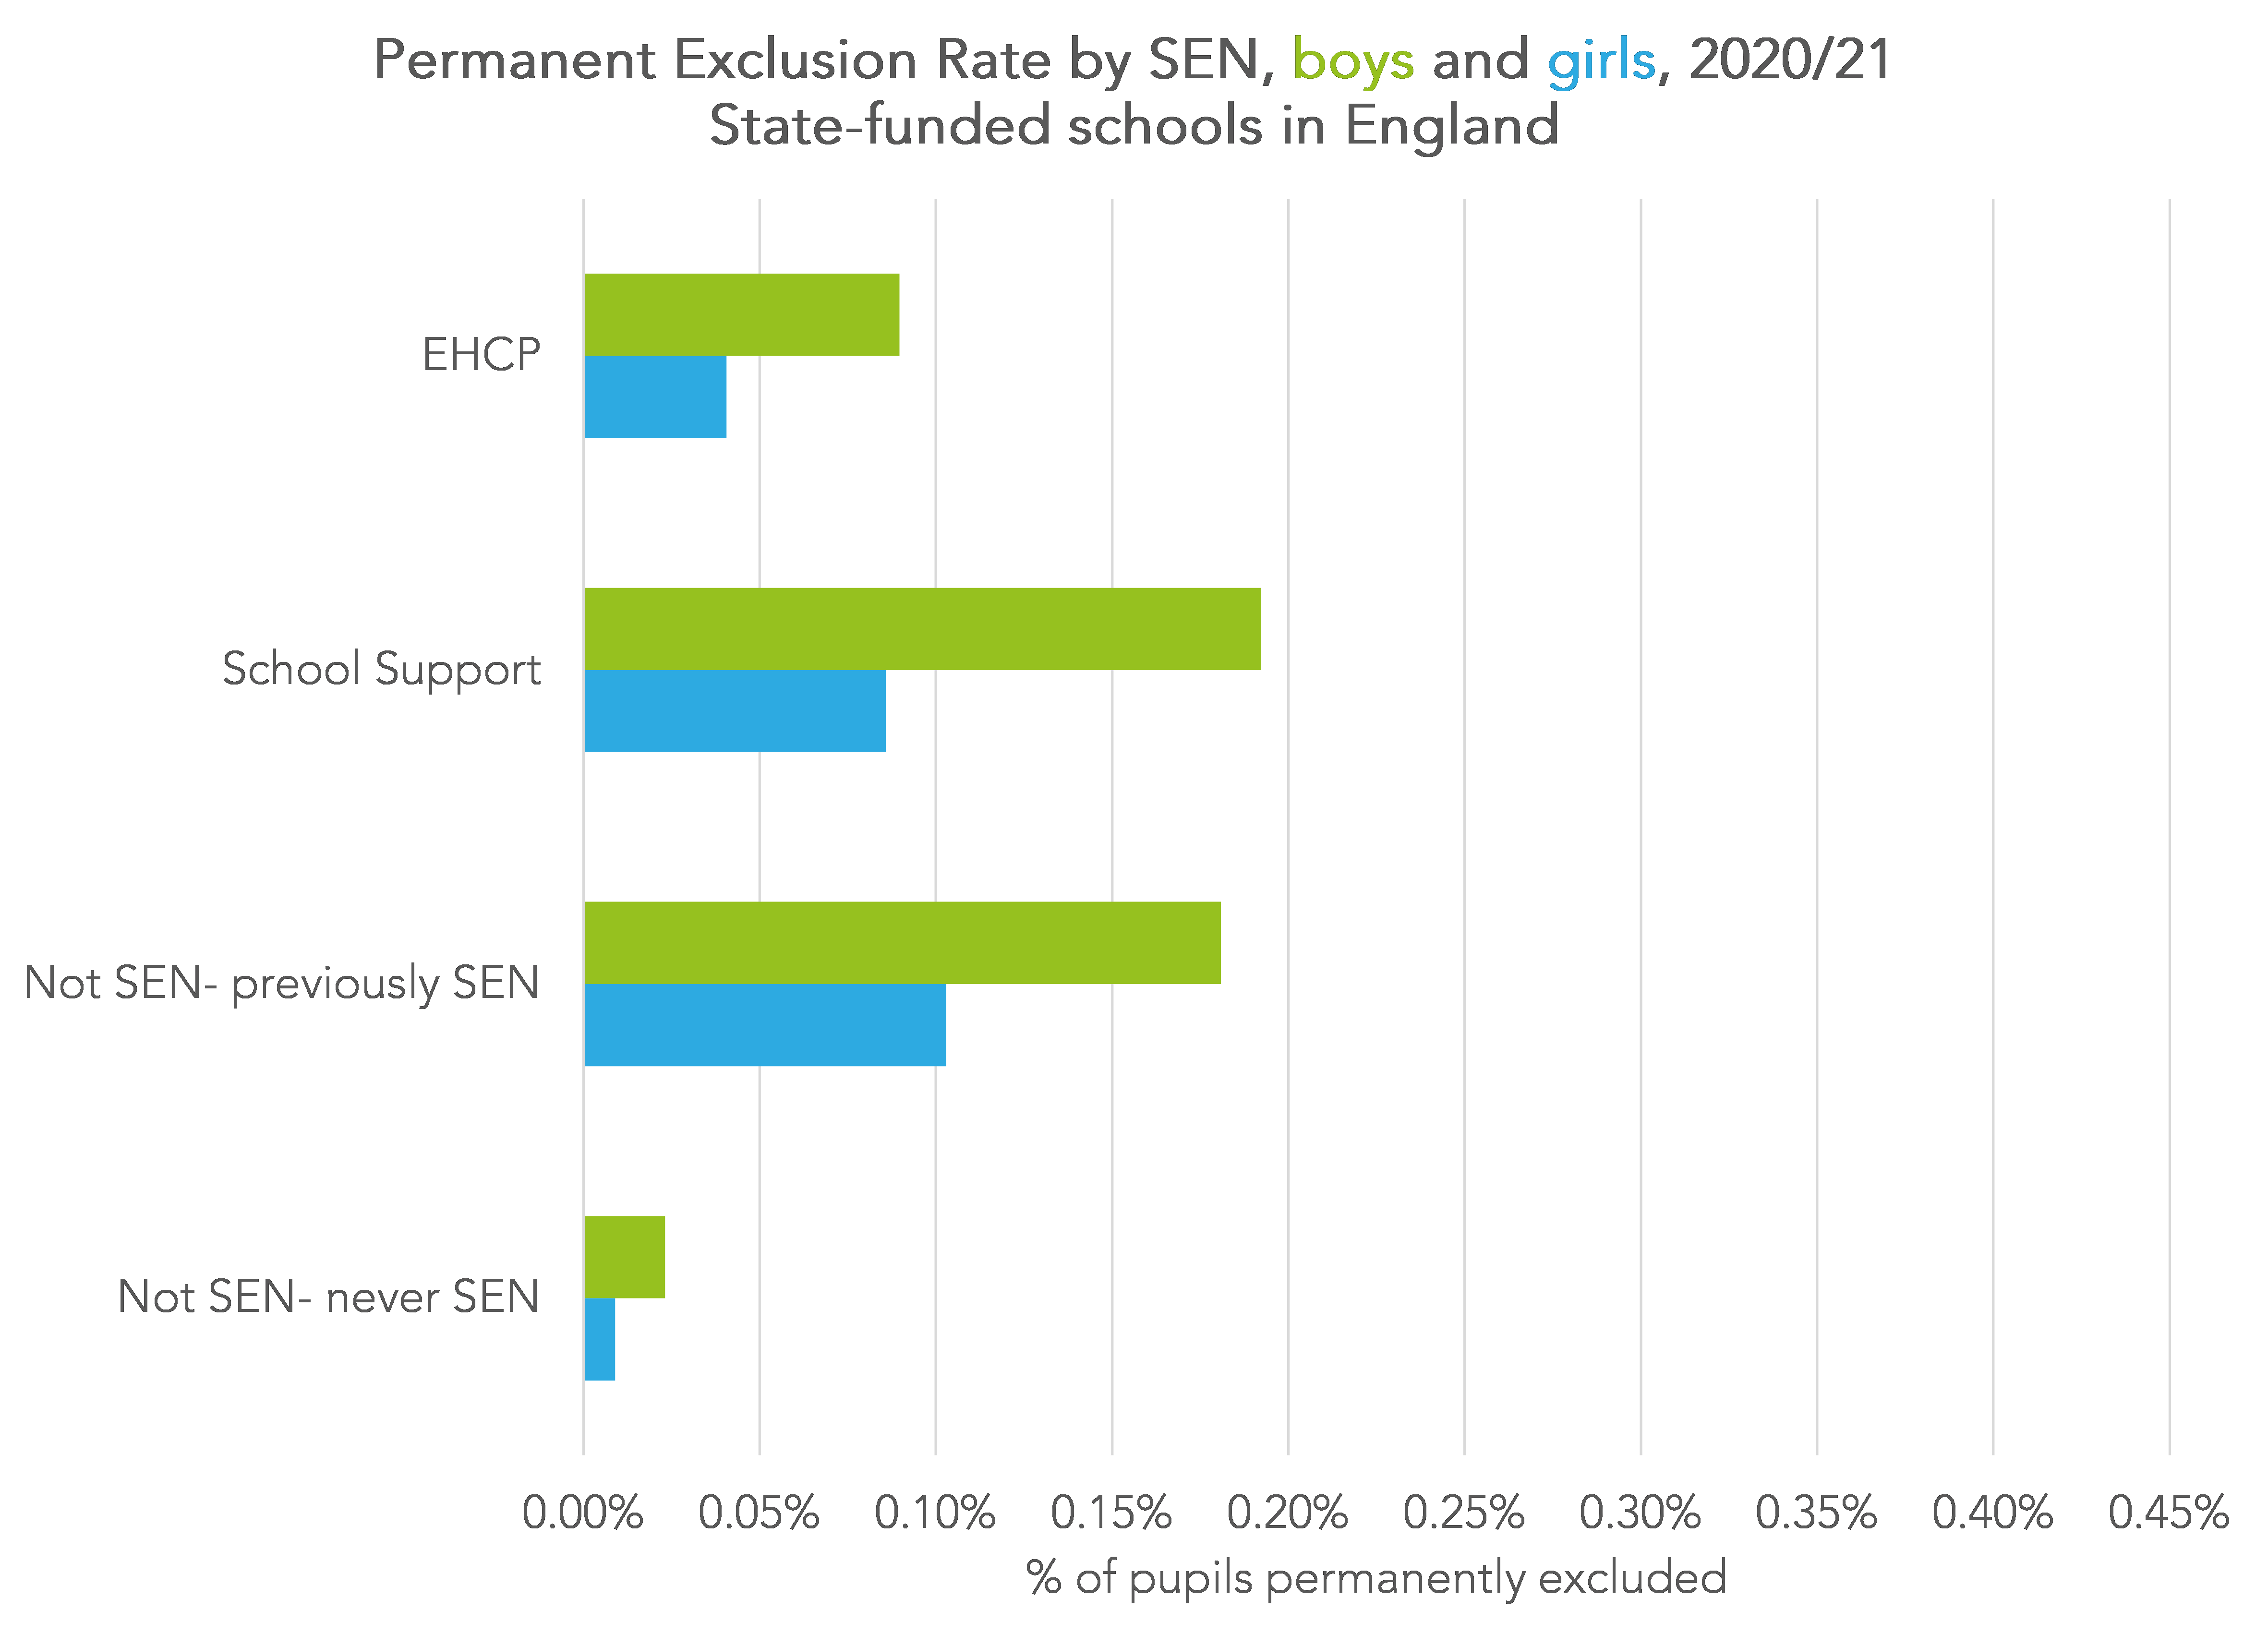
The permanent exclusion rate for previously SEN pupils is very similar to the permanent exclusion rate for those with SEN met by school support.
Among the “never SEN” group, the exclusion rate for boys was 0.02% (i.e. 2 boys in every 10,000) and among girls 0.01% (i.e. 1 girl in every 10,000).
Primary SEN Type
As this blog shows (based on DfE statistics), there are large variations in exclusion rates among pupils with SEN based on their recorded primary SEN type[3].

The exclusion rate for pupils with a primary SEN type of social, emotional and mental health (SEMH) needs far exceeds that of other groups.
The exclusion rate for all groups is higher than the exclusion rate for “never SEN” pupils although some groups, such as speech, language and communication needs (SLCN) are close to average. This may be because this is far more common in primary schools than secondary schools and exclusions are much lower in the primary sector. Rates for secondary-age SLCN pupils would be 0.12% for boys and 0.07% for girls.
Social, emotional and mental health needs
For many pupils identified as having SEMH needs, they are identified as having SEN for the first time relatively recently prior to exclusion.
In the chart below, the left-hand bars for each year represent the year in which pupils with SEN (School Support or a EHC plan) at the time of their exclusion and a primary SEN type of SEMH were first identified as having SEMH. 358 out of 890 (40%) were first identified as having SEMH needs either in 2019/20 or 2020/21. Recall that these pupils were all permanently excluded in the 2020/21 academic year. The majority (283) were not identified as having SEN in Spring 2018/19.
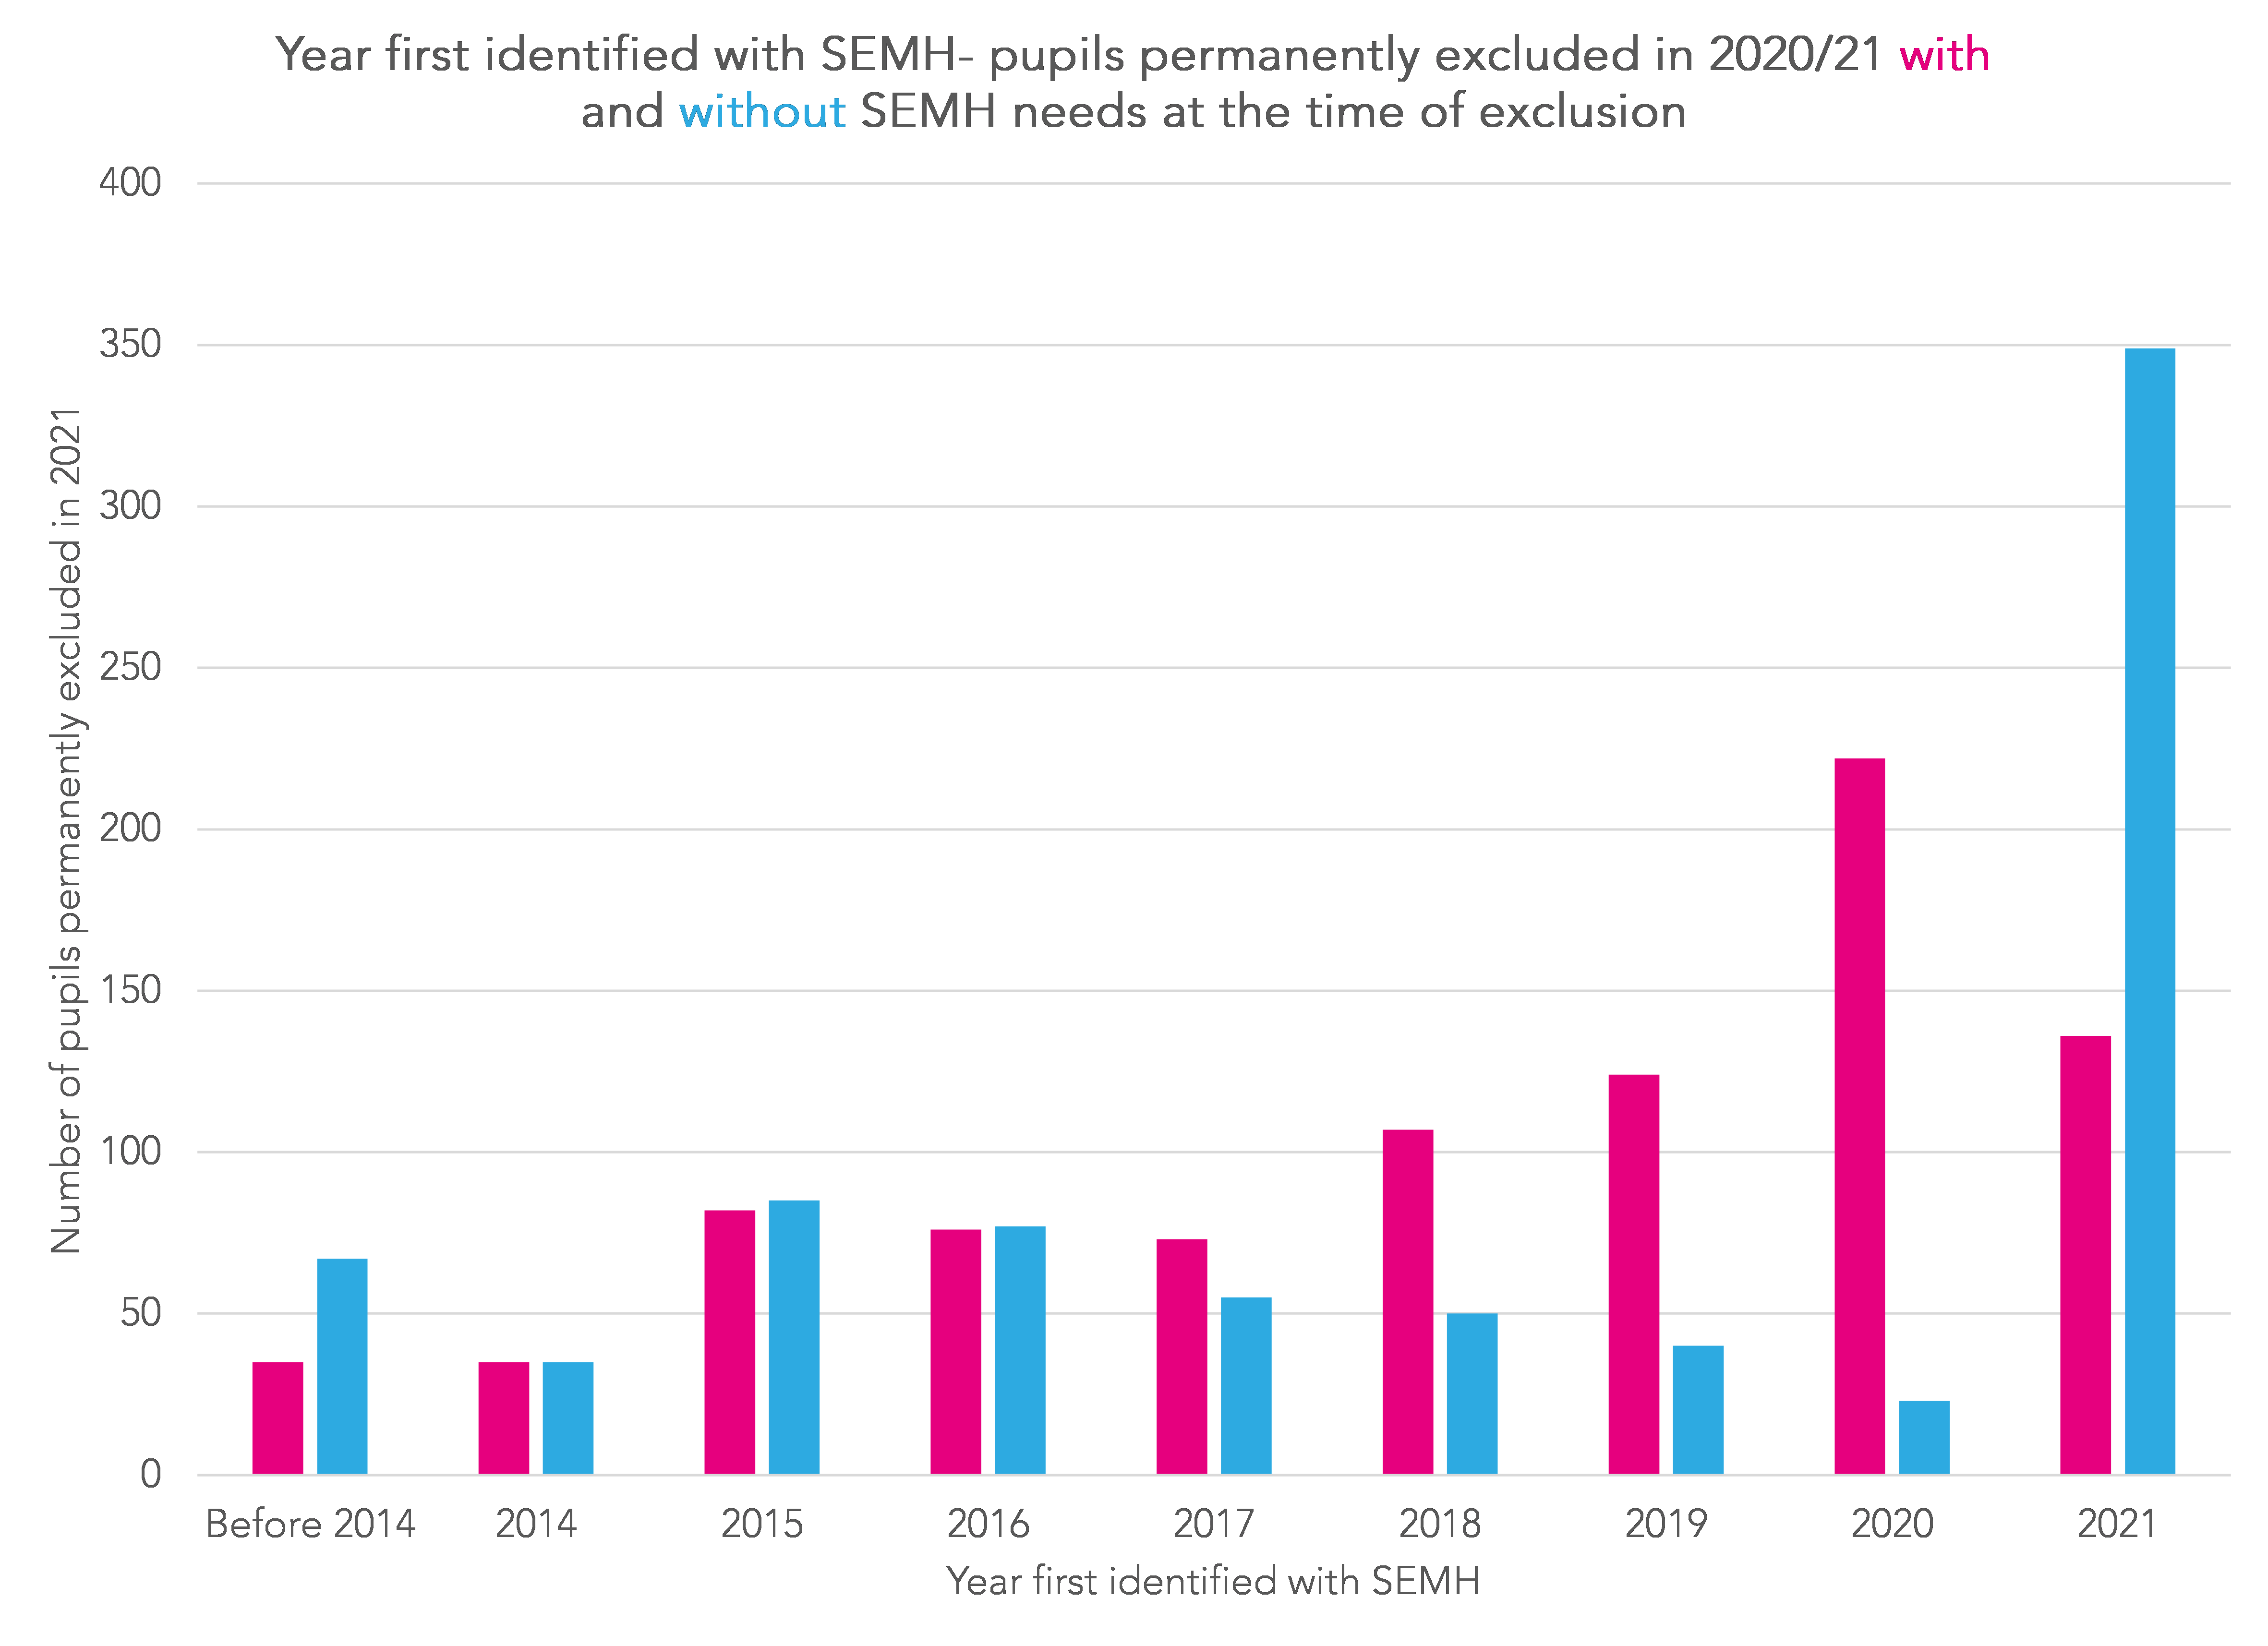
The blue bars relate to pupils who were not classified as having SEN at the time of exclusion (including those who previously had been) and pupils with SEN but with other primary SEN types. 781 pupils fell into this category, including 349 first identified in 2021, all of whom were pupils permanently excluded in Autumn 2020/21 and identified as having SEMH needs in Spring 2020/21.
In addition, 696 pupils who were permanently excluded in Spring or Summer 2020/21 were identified as having SEMH needs for the first time in Spring 2021/22.
Age first identified as having SEN
The probability of a pupil being identified as having SEN (for the first time) decreases as pupils get older.
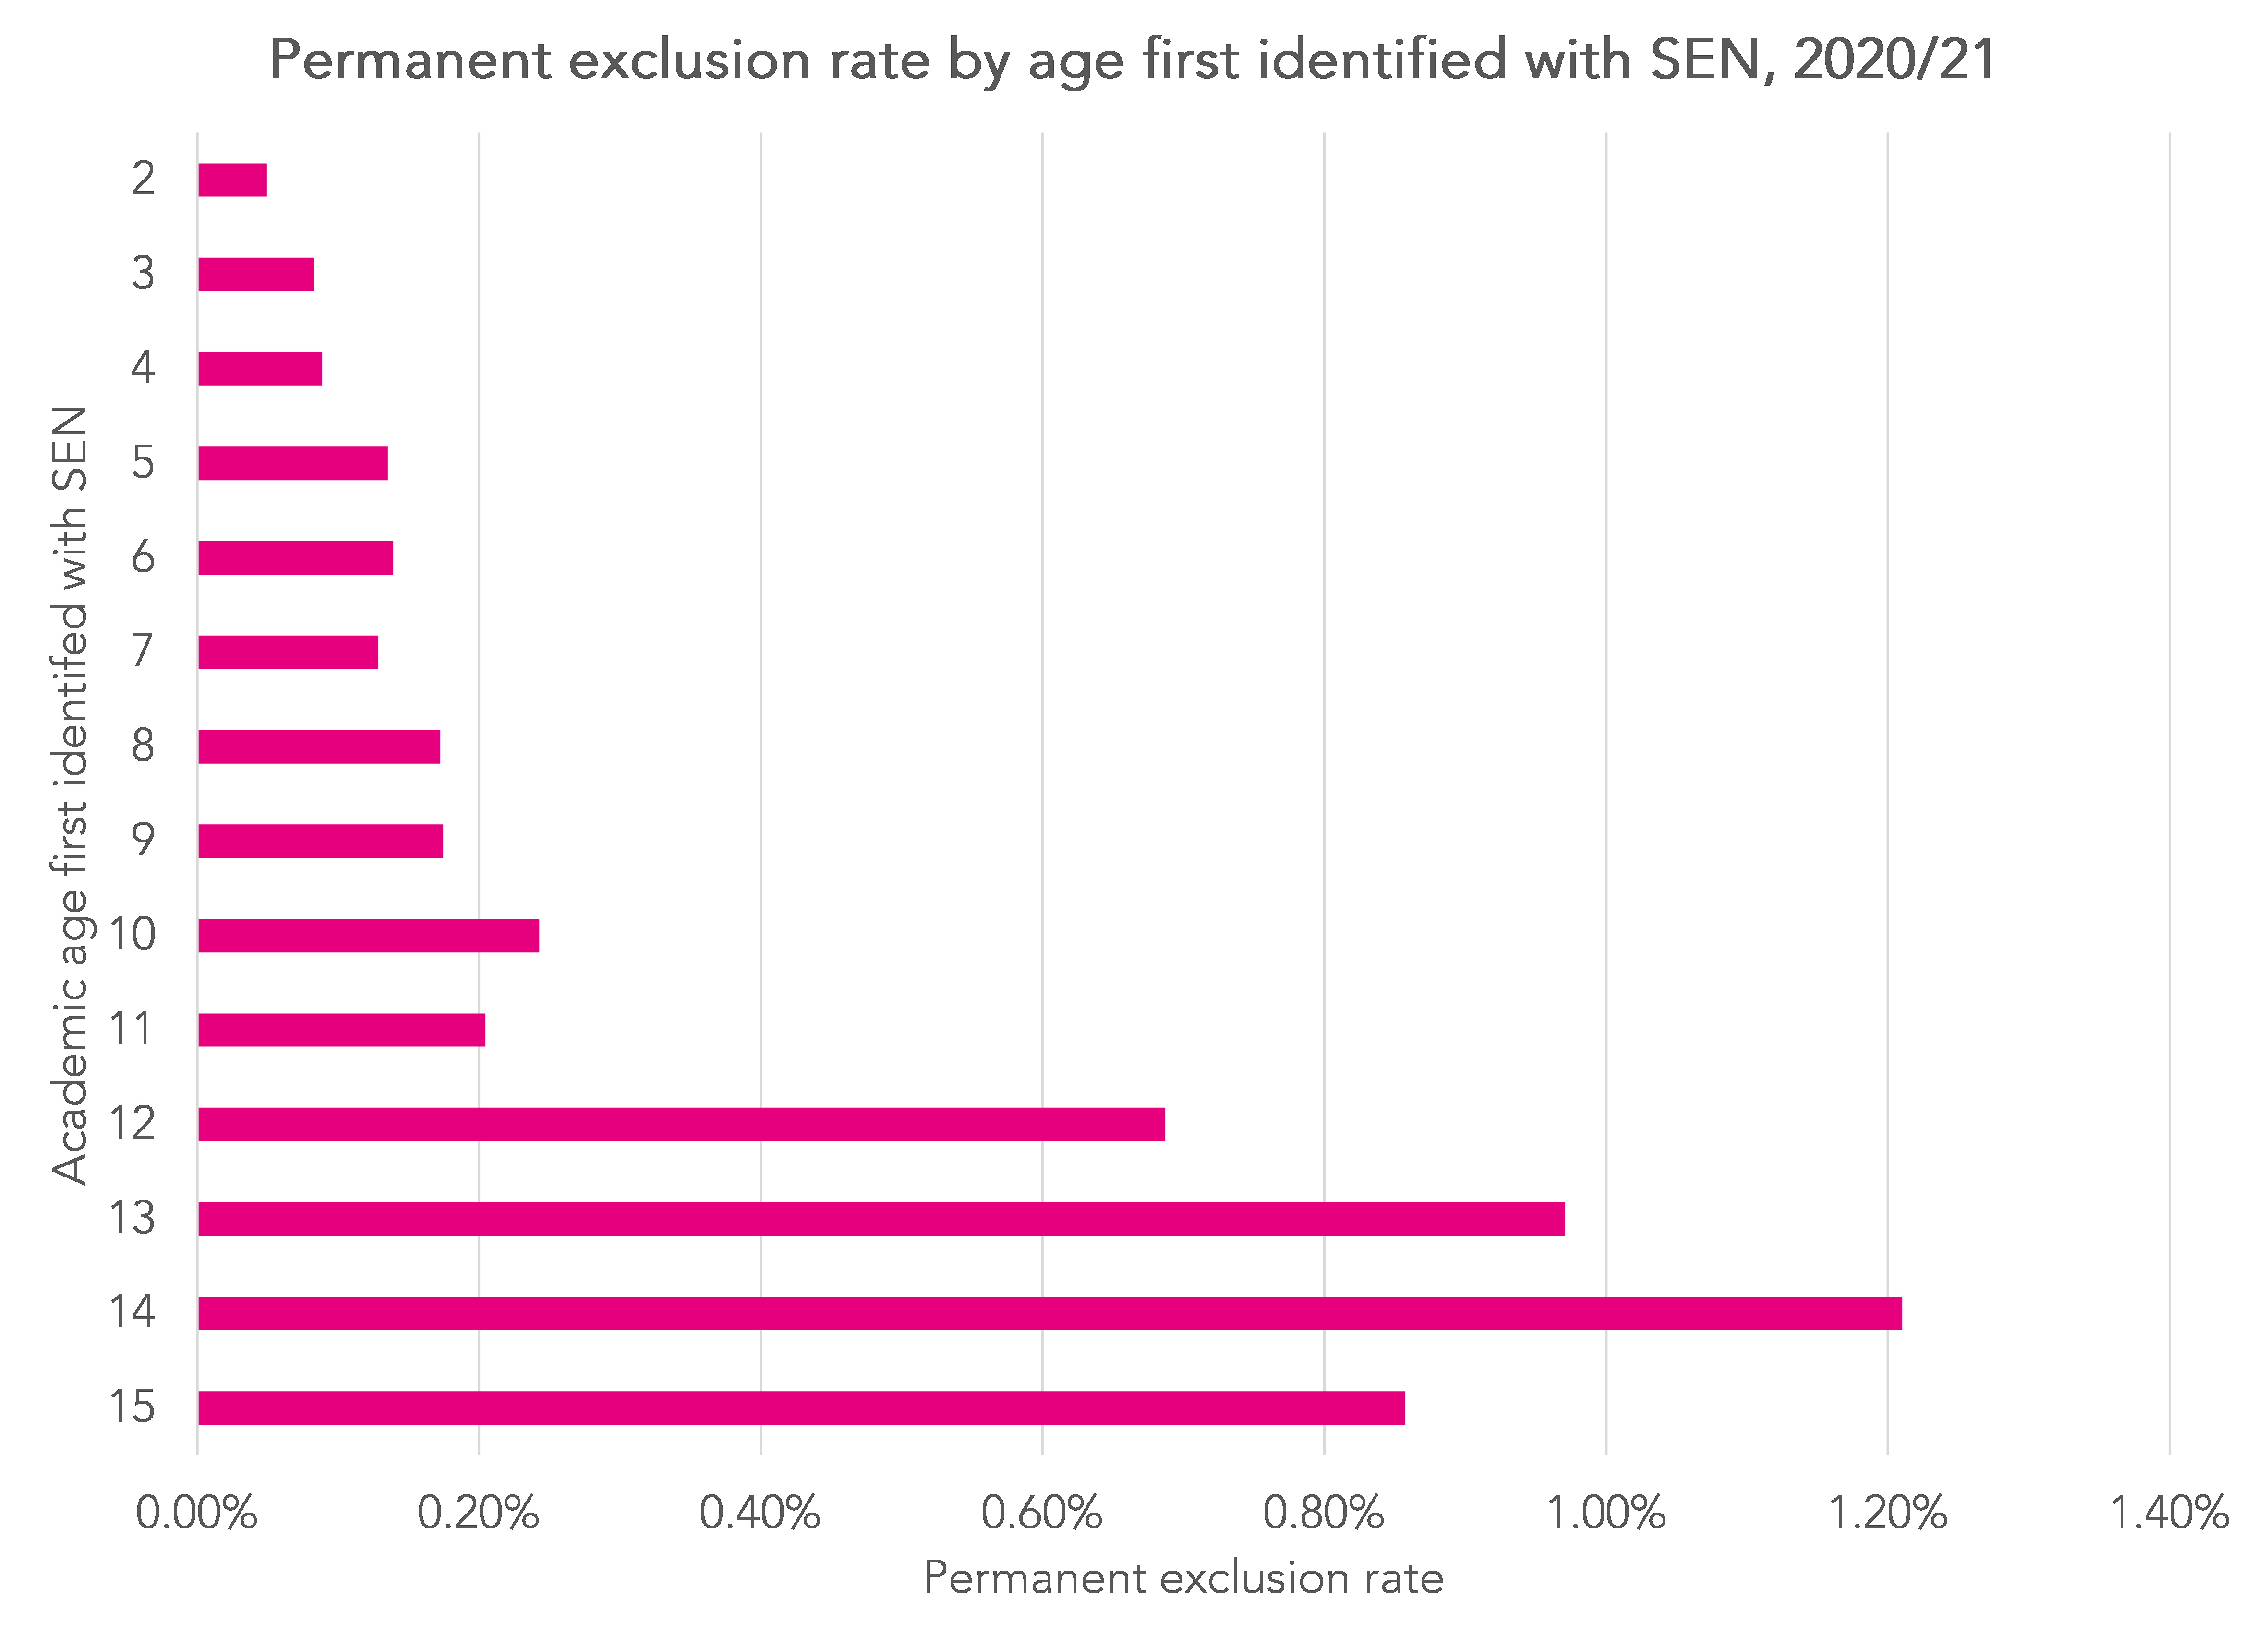
However, pupils who are identified as having SEN for the first time when of secondary-age are much more likely to be permanently excluded, although exclusion remains a relatively rare event.
448 of the excluded pupils were aged between 11 and 15 when first identified as having SEN. In 345 cases, this occurred in 2020/21. The following year (i.e. in 2021/22), 326 of the 448 were identified as having SEMH needs.
In other words, most of those who are identified as having SEN for the first time while at secondary school are identified as having SEMH needs.
Summing up
The relationship between special educational needs and permanent exclusion is complex.
It is certainly the case that published statistics show that pupils with SEN are more likely to be permanently excluded.
But this masks variation in exclusion rates not only between pupils with SEN (based on their primary needs) but also between pupils who are not identified as having SEN when excluded. Among this latter group, pupils previously identified as having SEN have similar exclusion rates to those receiving SEN support from their school.
For some pupils, particularly those identified as having SEMH needs, the identification occurs relatively recently prior to exclusion.
And many young people will be identified as having SEMH after being excluded, even if they hadn’t been previously.
Finally, pupils identified as having SEN for the first time while at secondary school face a greater risk of being permanently excluded.
- Not SEN; SEN- School Support; SEN- Education, Health and Care Plan
- Autistic spectrum disorder, Hearing impairment, Moderate learning difficulties, Multisensory impairment, Physical disability, Profound/multiple learning difficulties, Social, emotional or mental health, Speech, language or communication, Severe learning difficulties, Specific learning difficulties, Visual impairment
- We accept that these categories may be crude and some pupils may have multiple needs.
Want to stay up-to-date with the latest research from FFT Education Datalab? Sign up to Datalab’s mailing list to get notifications about new blogposts, or to receive the team’s half-termly newsletter.


Leave A Comment